- Manejadores y contadores de propietarios de indicadores
- Una forma sencilla de crear instancias de indicadores: iCustom
- Comprobación del número de barras calculadas: BarsCalculated
- Obtención de datos de series temporales a partir de un indicador: CopyBuffer
- Soporte para múltiples símbolos y marcos temporales
- Visión general de los indicadores integrados
- Utilización de los indicadores integrados
- Forma avanzada de crear indicadores: IndicatorCreate
- Creación flexible de indicadores con IndicatorCreate
- Visión general de las funciones de gestión de indicadores en el gráfico
- Combinar salida a ventanas principal y auxiliar
- Leer datos de gráficos que tienen un desplazamiento
- Borrar instancias de indicadores: IndicatorRelease
- Obtener la configuración del indicador por su manejador
- Definir la fuente de datos de un indicador
Soporte para múltiples símbolos y marcos temporales
Hasta ahora, en todos los ejemplos de indicadores hemos creado descriptores para el mismo símbolo y marco temporal que en el gráfico actual. Sin embargo, no existe tal limitación. Podemos crear indicadores auxiliares en cualquier símbolo y marco temporal. Por supuesto, en este caso, es necesario esperar a la disposición de las series temporales de terceros, como hicimos antes, por ejemplo, por temporizador.
Implementemos el indicador WPR de marco temporal múltiple (véase el archivo UseWPRMTF.mq5), al que también se le puede asignar un cálculo sobre un símbolo arbitrario (distinto del gráfico).
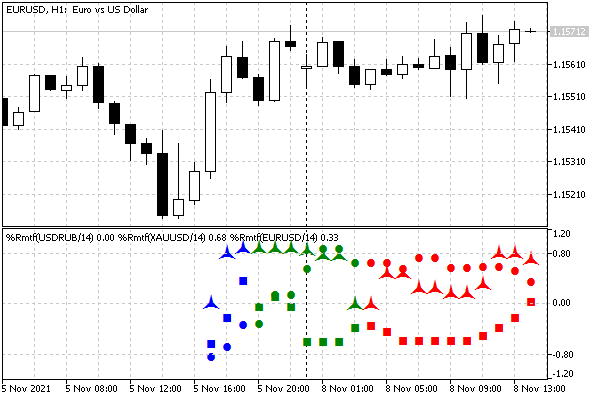
Mostraremos los valores WPR de un periodo determinado para todos los marcos temporales estándar de la enumeración ENUM_TIMEFRAMES. El número de marcos temporales es 21, por lo que el indicador siempre se mostrará en las últimas 21 barras. La barra cero más a la derecha contendrá WPR para M1, la siguiente contendrá WPR para M2, y así sucesivamente hasta la vigésima barra con WPR para el marco temporal mensual. Para facilitar la lectura, colorearemos los trazados con diferentes colores: los marcos temporales de minutos serán rojos, los de horas, verdes, y los diarios y más antiguos, azules.
Dado que será posible establecer un símbolo de trabajo en el indicador y crear varias copias para diferentes símbolos en el mismo gráfico, seleccionaremos el estilo de dibujo DRAW_ARROW y proporcionaremos un parámetro de entrada para asignar un símbolo. De este modo, será posible distinguir las indicaciones para los distintos símbolos. El coloreado requiere un búfer adicional.
#property indicator_separate_window
|
Los valores WPR se convierten al rango [-1,+1]. Vamos a escoger la escala de la subventana con cierto margen del rango. Los niveles con valores de ±0.6 corresponden a las normas -20 y -80 antes de la conversión WPR.
#property indicator_maximum +1.2
|
En variables de entrada: periodo WPR, símbolo de trabajo y código de la flecha mostrada. Cuando el símbolo se deja en blanco, se utiliza el símbolo del gráfico actual.
input int WPRPeriod = 14;
|
Para facilitar la codificación, el conjunto de marcos temporales figura en el array TF.
#define TFS 21
|
Los descriptores de los indicadores de cada marco temporal se almacenan en el array Handle.
int Handle[TFS]; |
Configuraremos búferes de indicadores y obtendremos manejadores en OnInit.
double WPRBuffer[];
|
El cálculo en OnCalculate sigue el esquema habitual: espera a que los datos estén listos, inicialización, rellenado en nuevas barras. Las funciones auxiliares IsDataReady y FillData realizan un trabajo directo con los descriptores (véase más adelante).
int OnCalculate(const int rates_total,
|
Si es necesario, iniciamos el recálculo por temporizador.
void OnTimer()
|
Y aquí están las funciones IsDataReady y FillData.
bool IsDataReady()
|
Vamos a compilar el indicador y ver cómo se ve en el gráfico. Por ejemplo, vamos a crear tres copias para EURUSD, USDRUB y XAUUSD.

Tres instancias de WPR de marco temporal múltiple para distintos símbolos de trabajo
Durante el primer cálculo, el indicador puede requerir una cantidad de tiempo considerable para preparar las series temporales de todos los marcos temporales.
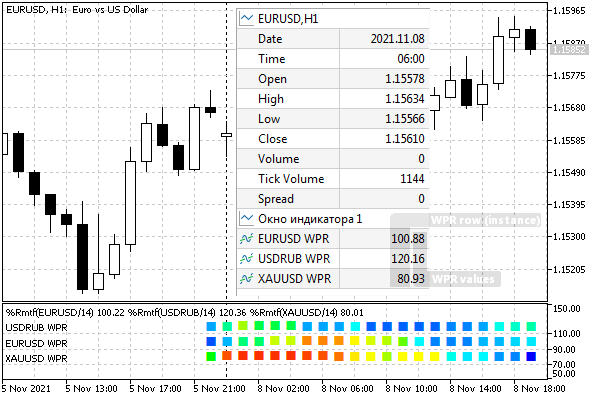
En cuanto a la parte calculada, exactamente el mismo indicador UseWPRMTFDashboard.mq5 está diseñado en forma de un panel informativo popular entre los operadores de trading. Para cada símbolo establecemos sangrías verticales individuales en el parámetro Level del indicador. Aquí es donde los valores WPR de todos los marcos temporales se muestran como una línea de marcadores, y los valores están codificados por colores. En esta versión, los valores WPR están normalizados en el intervalo [0..1], por lo que el uso de reglas en niveles separados por varias decenas (por ejemplo, 20, como en la captura de pantalla siguiente) permite colocar varias instancias del indicador en la subventana sin que se solapen (80 , 100, 120, etc.). Cada copia se utiliza para su propio símbolo de trabajo. Además, debido a que Level es mayor que 1.0, y los valores de WPR son menores, son visibles en los valores de Data window por separado: a la izquierda y a la derecha del punto decimal.
Las etiquetas para las reglas de etiquetas se proporcionan mediante niveles añadidos dinámicamente en OnInit.

Panel de tres líneas WPR de marco temporal múltiple para distintos símbolos de trabajo
Puede explorar el código fuente de UseWPRMTFDashboard.mq5 y compararlo con UseWPRMTF.mq5. Para generar una paleta de tonos de color, utilizamos el archivo ColorMix.mqh.
Cuando terminemos de estudiar los indicadores integrados, incluido iWPR, podemos sustituir el IndWPR personalizado por el iWPR integrado.
Eficacia e intensidad de recursos de los indicadores compuestos
El enfoque mostrado anteriormente, con la generación de muchos indicadores auxiliares, no es eficiente en términos de velocidad y consumo de recursos. Se trata principalmente de un ejemplo de integración de programas MQL y de intercambio de datos entre ellos. Pero, como cualquier tecnología, debe utilizarse adecuadamente.
Cada uno de los dos indicadores creados calcula WPR en todas las barras de la serie temporal, y luego sólo el último valor se toma en el indicador de llamada. Desperdiciamos tanto memoria como tiempo de procesador.
Si se dispone del código fuente de los indicadores auxiliares o se conoce el concepto de su funcionamiento, lo más óptimo es ubicar el algoritmo de cálculo dentro del indicador principal (o Asesor Experto) y aplicarlo para un historial limitado e inmediato de la profundidad mínima requerida.
En algunos casos, puede prescindir de referirse a marcos temporales superiores realizando cálculos equivalentes en el marco temporal actual: por ejemplo, en lugar de un rango de precios en 14 barras diarias (lo que requiere construir una serie temporal D1 completa), puede tomar un rango en 14 * 24 barras H1, sujeto a una operación de trading de 24 horas y lanzar el indicador en el gráfico H1.
Al mismo tiempo, cuando se utiliza un indicador comercial en un sistema de trading (sin código fuente), sólo se pueden obtener datos de él a través de interfaces de programación abiertas. En este caso, crear un manejador y luego leer los datos del búfer del indicador a través de CopyBuffer es la única opción disponible, pero al mismo tiempo es la forma práctica y universal. Sólo debe tener siempre en cuenta que llamar a funciones de la API es una operación más «cara» que manipular su propio array dentro de un programa MQL y llamar a funciones locales. Si necesita mantener abiertos muchos terminales, probablemente cada uno con un conjunto de programas MQL no optimizados de este tipo, y si tiene recursos limitados, es probable que el rendimiento disminuya.