- Descripción de recursos mediante la directiva #resource
- Uso compartido de recursos de distintos programas MQL
- Variables de recursos
- Conectar indicadores personalizados como recursos
- Creación de recursos dinámicos: ResourceCreate
- Eliminar recursos dinámicos: ResourceFree
- Leer y modificar datos de recursos: RecursoReadImage
- Guardar imágenes en un archivo: ResourceSave
- Fuentes y salida de texto a recursos gráficos
- Aplicación de recursos gráficos en trading
Aplicación de recursos gráficos en trading
Por supuesto, embellecer no es el objetivo principal de los recursos. Veamos cómo crear una herramienta útil basada en ellos. También eliminaremos una omisión más: hasta ahora solo hemos utilizado recursos dentro de objetos OBJ_BITMAP_LABEL, que se posicionan en coordenadas de pantalla. Sin embargo, los recursos gráficos también pueden incrustarse en objetos OBJ_BITMAP con referencia a coordenadas de cotización: precios y hora.
Anteriormente en el libro hemos visto el indicador IndDeltaVolume.mq5 que calcula el volumen delta (tick o real) para cada barra. Además de esta representación del volumen delta, existe otra no menos popular entre los usuarios: el perfil de mercado. Se trata de la distribución de volúmenes en el contexto de los niveles de precios. Dicho histograma puede construirse para toda la ventana, para una profundidad determinada (por ejemplo, dentro de un día) o para una sola barra.
Es la última opción la que aplicamos en forma de nuevo indicador DeltaVolumeProfile.mq5. Ya hemos considerado los principales detalles técnicos de la solicitud del historial de ticks en el marco del indicador anterior, por lo que ahora nos centraremos principalmente en el componente gráfico.
La bandera ShowSplittedDelta en la variable de entrada controlará cómo se muestran los volúmenes: desglosados por direcciones de compra/venta o colapsados.
input bool ShowSplittedDelta = true; |
No habrá búferes en el indicador. Calculará y mostrará un histograma para una barra específica a petición del usuario, y en concreto, haciendo clic en dicha barra. Por lo tanto, utilizaremos el manejador OnChartEvent. En este manejador, obtenemos las coordenadas de la pantalla, las recalculamos en precio y tiempo, y llamamos a alguna función de ayuda RequestData, que inicia el cálculo.
void OnChartEvent(const int id, const long &lparam, const double &dparam, const string &sparam)
|
Para rellenarlo, necesitamos la clase DeltaVolumeProfile, que está construida para ser similar a la clase CalcDeltaVolume de IndDeltaVolume.mq5.
La nueva clase describe variables que tienen en cuenta el método de cálculo del volumen (tickType), el tipo de precio sobre el que se construye el gráfico (barType), el modo de la variable de entrada ShowSplittedDelta (se colocará en una variable miembro delta), así como un prefijo para los objetos generados en el gráfico.
class DeltaVolumeProfile
|
La dirección tick type puede cambiarse al valor TRADE_TICKS solo para los instrumentos de trading para los que se dispone de volúmenes reales. De manera predeterminada, está activado el modo INFO_TICKS, que funciona en todos los instrumentos.
Los ticks de una barra concreta se solicitan mediante el método createProfileBar.
int createProfileBar(const int i)
|
El análisis directo de los ticks y el cálculo de los volúmenes se realiza en el método protegido calcProfile. En él, en primer lugar, averiguamos el rango de precios de la barra y su tamaño en píxeles.
void calcProfile(const int b, const datetime time, const MqlTick &ticks[])
|
Basándonos en esta información, creamos un objeto OBJ_BITMAP, asignamos un array para la imagen y creamos un recurso. El fondo de toda la imagen está vacío (transparente). Cada objeto está anclado por el punto medio superior al precio High de su barra y tiene una anchura de una barra.
uint data[];
|
A continuación se calculan los volúmenes en ticks del array pasado. El número de niveles de precios es igual a la altura de la barra en píxeles (h). Suele ser inferior al rango de precios en puntos, por lo que los píxeles actúan como una especie de cesta para calcular las estadísticas. Si en un marco temporal pequeño, el rango de puntos es menor que el tamaño en píxeles, el histograma será visualmente escaso. Los volúmenes de compras y ventas se acumulan por separado en los arrays plus y minus.
long plus[], minus[], max = 0;
|
Para normalizar el histograma, buscamos el valor máximo.
if(delta)
|
Por último, las estadísticas resultantes se envían al búfer gráfico data y se envían al recurso. Los volúmenes de compra aparecen en azul y los de venta, en rojo. Si el modo neto está activado, el importe aparece en verde.
for(int i = 0; i < h; i++)
|
Ahora podemos volver a la función RequestData: su tarea es llamar al método createProfileBar y gestionar los errores (si los hay).
void RequestData(const int b, const datetime time, const int count = 0)
|
La única estrategia de gestión de errores es intentar solicitar de nuevo los ticks porque puede que no hayan tenido tiempo de cargarse. Para ello, la función envía un mensaje TRY_AGAIN personalizado al gráfico y lo procesa ella misma.
void OnChartEvent(const int id, const long &lparam, const double &dparam, const string &sparam)
|
Repetimos este proceso no más de 5 veces, porque el historial de ticks puede tener una profundidad limitada, y no tiene sentido cargar el ordenador sin motivo.
La clase DeltaVolumeProfile también dispone del mecanismo para procesar el mensaje CHARTEVENT_CHART_CHANGE con el fin de redibujar los objetos existentes en caso de cambio de tamaño o escala del gráfico. Los detalles se pueden encontrar en el código fuente.
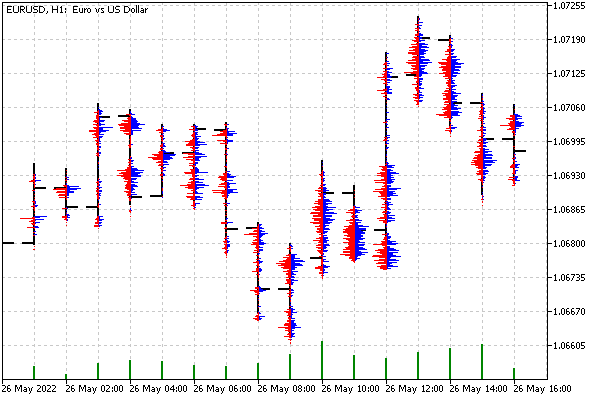
El resultado de este indicador se muestra en la siguiente imagen:

Visualización de histogramas por barras de volúmenes separados en recursos gráficos
Tenga en cuenta que los histogramas no se muestran inmediatamente después de dibujar el indicador: tiene que hacer clic en la barra para calcular su histograma.