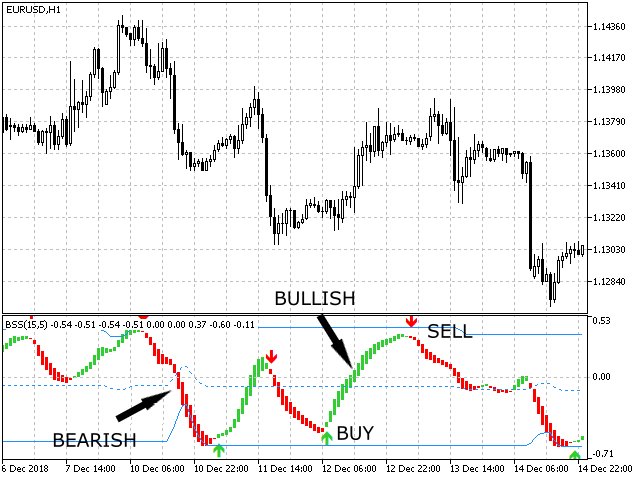
Buy Sell Strength (BSS) is a stock technical analysis oscillator, showing bullish (buy) and bearish (sell) strength by comparing upward and downward stock momentum movements. The BSS is easy to interpret: When BBS Histogram is Green, it is bullish, when it is Red, it is bearish. BSS is considered overbought when it is closer to Top Line and oversold when it is closer to Bottom Line. When it shows Buy signal near the Bottom line, it is a more reliable signal. ver 2.0 fixed a bug, the indicator works in real time charting.
Trend Reversal (TR) is a technical analysis indicator, showing moving trend reversal and bullish, bearish signals by comparing stock momentum. The Trend Reversal is easy to interpret: 1. When candle is Green, shows bullish, when it is Red, shows bearish. 2. when candle changes to Blue, shows the trend might reverse, a buy or sell signal might appear. 3. When bullish or bearish is confirmed, a Buy or Sell signal is given. 4. Sound, Pop-up message, Push notification and email alerts after signal
Buy Sell Strength (BSS) (For MT4 ) is a stock technical analysis oscillator, showing bullish (buy) and bearish (sell) strength by comparing upward and downward stock momentum movements. The BSS is easy to interpret: 1. When BBS Histogram is moving Upward, it is bullish, when it is Downward, it is bearish. 2. When the Orange rectangle is changing shorter and shorter, it shows the trend will change direction. when it dispears, it shows Buy or Sell signals. 3. BSS is considered overbought when it
Buy Sell Strength (BSS) is a technical analysis oscillator, showing bullish (buy) and bearish (sell) strength by comparing upward and downward stock momentum movements. The BSS is easy to interpret: 1. When BBS Histogram is Green, it is bullish, when it is Red, it is bearish. 2. BSS is considered overbought when it is closer to Top Line and oversold when it is closer to Bottom Line. 3. When it shows Buy signal near the Bottom line, it is a more reliable signal. 4. Sound, Pop-up message, Push