|
3 years
experience
|
0
products
|
0
demo versions
|
|
0
jobs
|
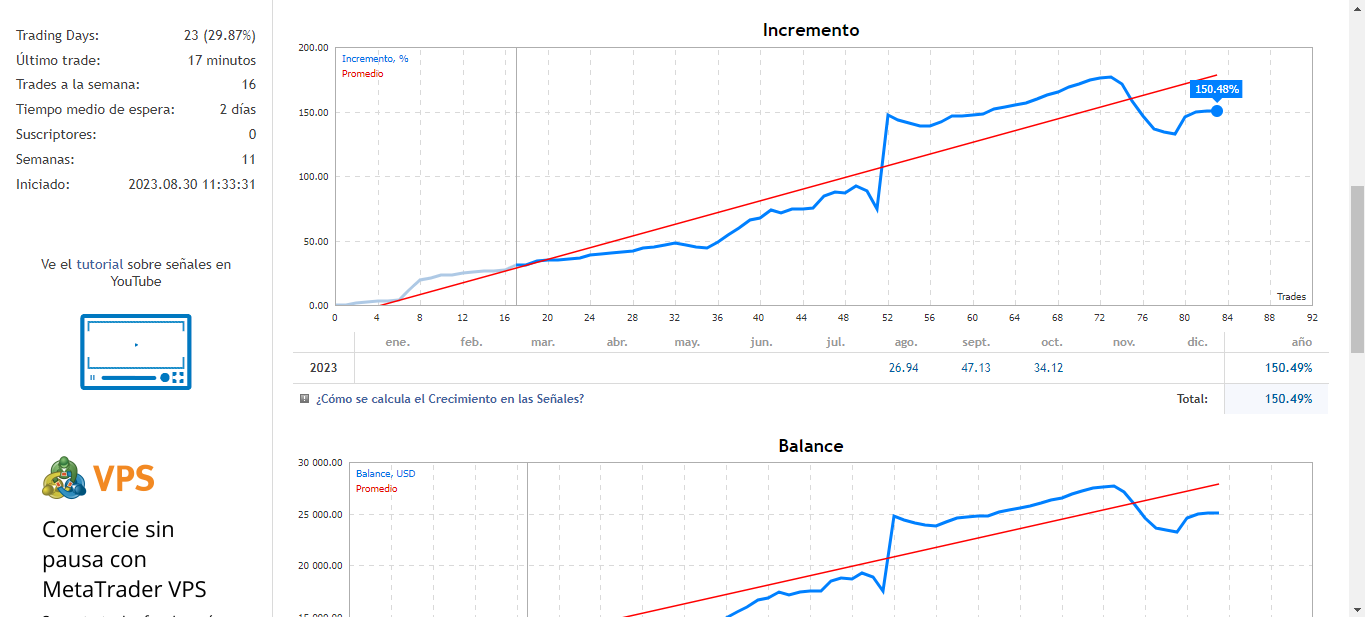
2
signals
|
0
subscribers
|
I am an economist and trader with extensive experience in the financial markets. Throughout my professional journey, I have developed a deep understanding of market behavior, combining economic analysis, technical reading, risk management, and a comprehensive view of the global factors that influence price movements.
For more than a decade, I have been involved in the financial sector, working in environments where market analysis, strategic decision-making, and the interpretation of economic conditions have played a fundamental role. This experience has allowed me to build a solid perspective, both from a technical standpoint and from a broader macroeconomic understanding of the markets.
My approach as a trader is based on discipline, patience, and responsible capital management. I understand that success in the financial markets does not depend only on finding good opportunities, but also on knowing how to wait for the right moment, execute with precision, and maintain emotional control even during periods of high volatility.
Over time, I have developed a structured trading methodology with clear rules and a well-defined risk management approach. My goal is not to trade impulsively, but to identify high-probability scenarios where strategy, experience, and discipline work together.
For me, trading is much more than buying or selling financial assets. It is a continuous process of analysis, adaptation, and professional growth. Every trade must respond to a clear logic, a defined plan, and proper risk management.
It is a pleasure for me to share this trading approach with each of you and to present a serious, selective, and consistency-focused way of working.
Best regards.