Oleg Rodin / Profile
- Information
|
12+ years
experience
|
50
products
|
554
demo versions
|
|
0
jobs
|
0
signals
|
0
subscribers
|
Hello!
I've been a trader and trading software developer for more than 15 years already. Here I do my best to share my experience with other traders providing them with high-quality trading tools which can be used for trading different markets.
My goal is to help traders get success in trading no matter what level of experience they currently have.
I truly believe with my support and trading tools every trader can become better in forex trading.
I wish you great success and good luck in trading!
I've been a trader and trading software developer for more than 15 years already. Here I do my best to share my experience with other traders providing them with high-quality trading tools which can be used for trading different markets.
My goal is to help traders get success in trading no matter what level of experience they currently have.
I truly believe with my support and trading tools every trader can become better in forex trading.
I wish you great success and good luck in trading!
Oleg Rodin
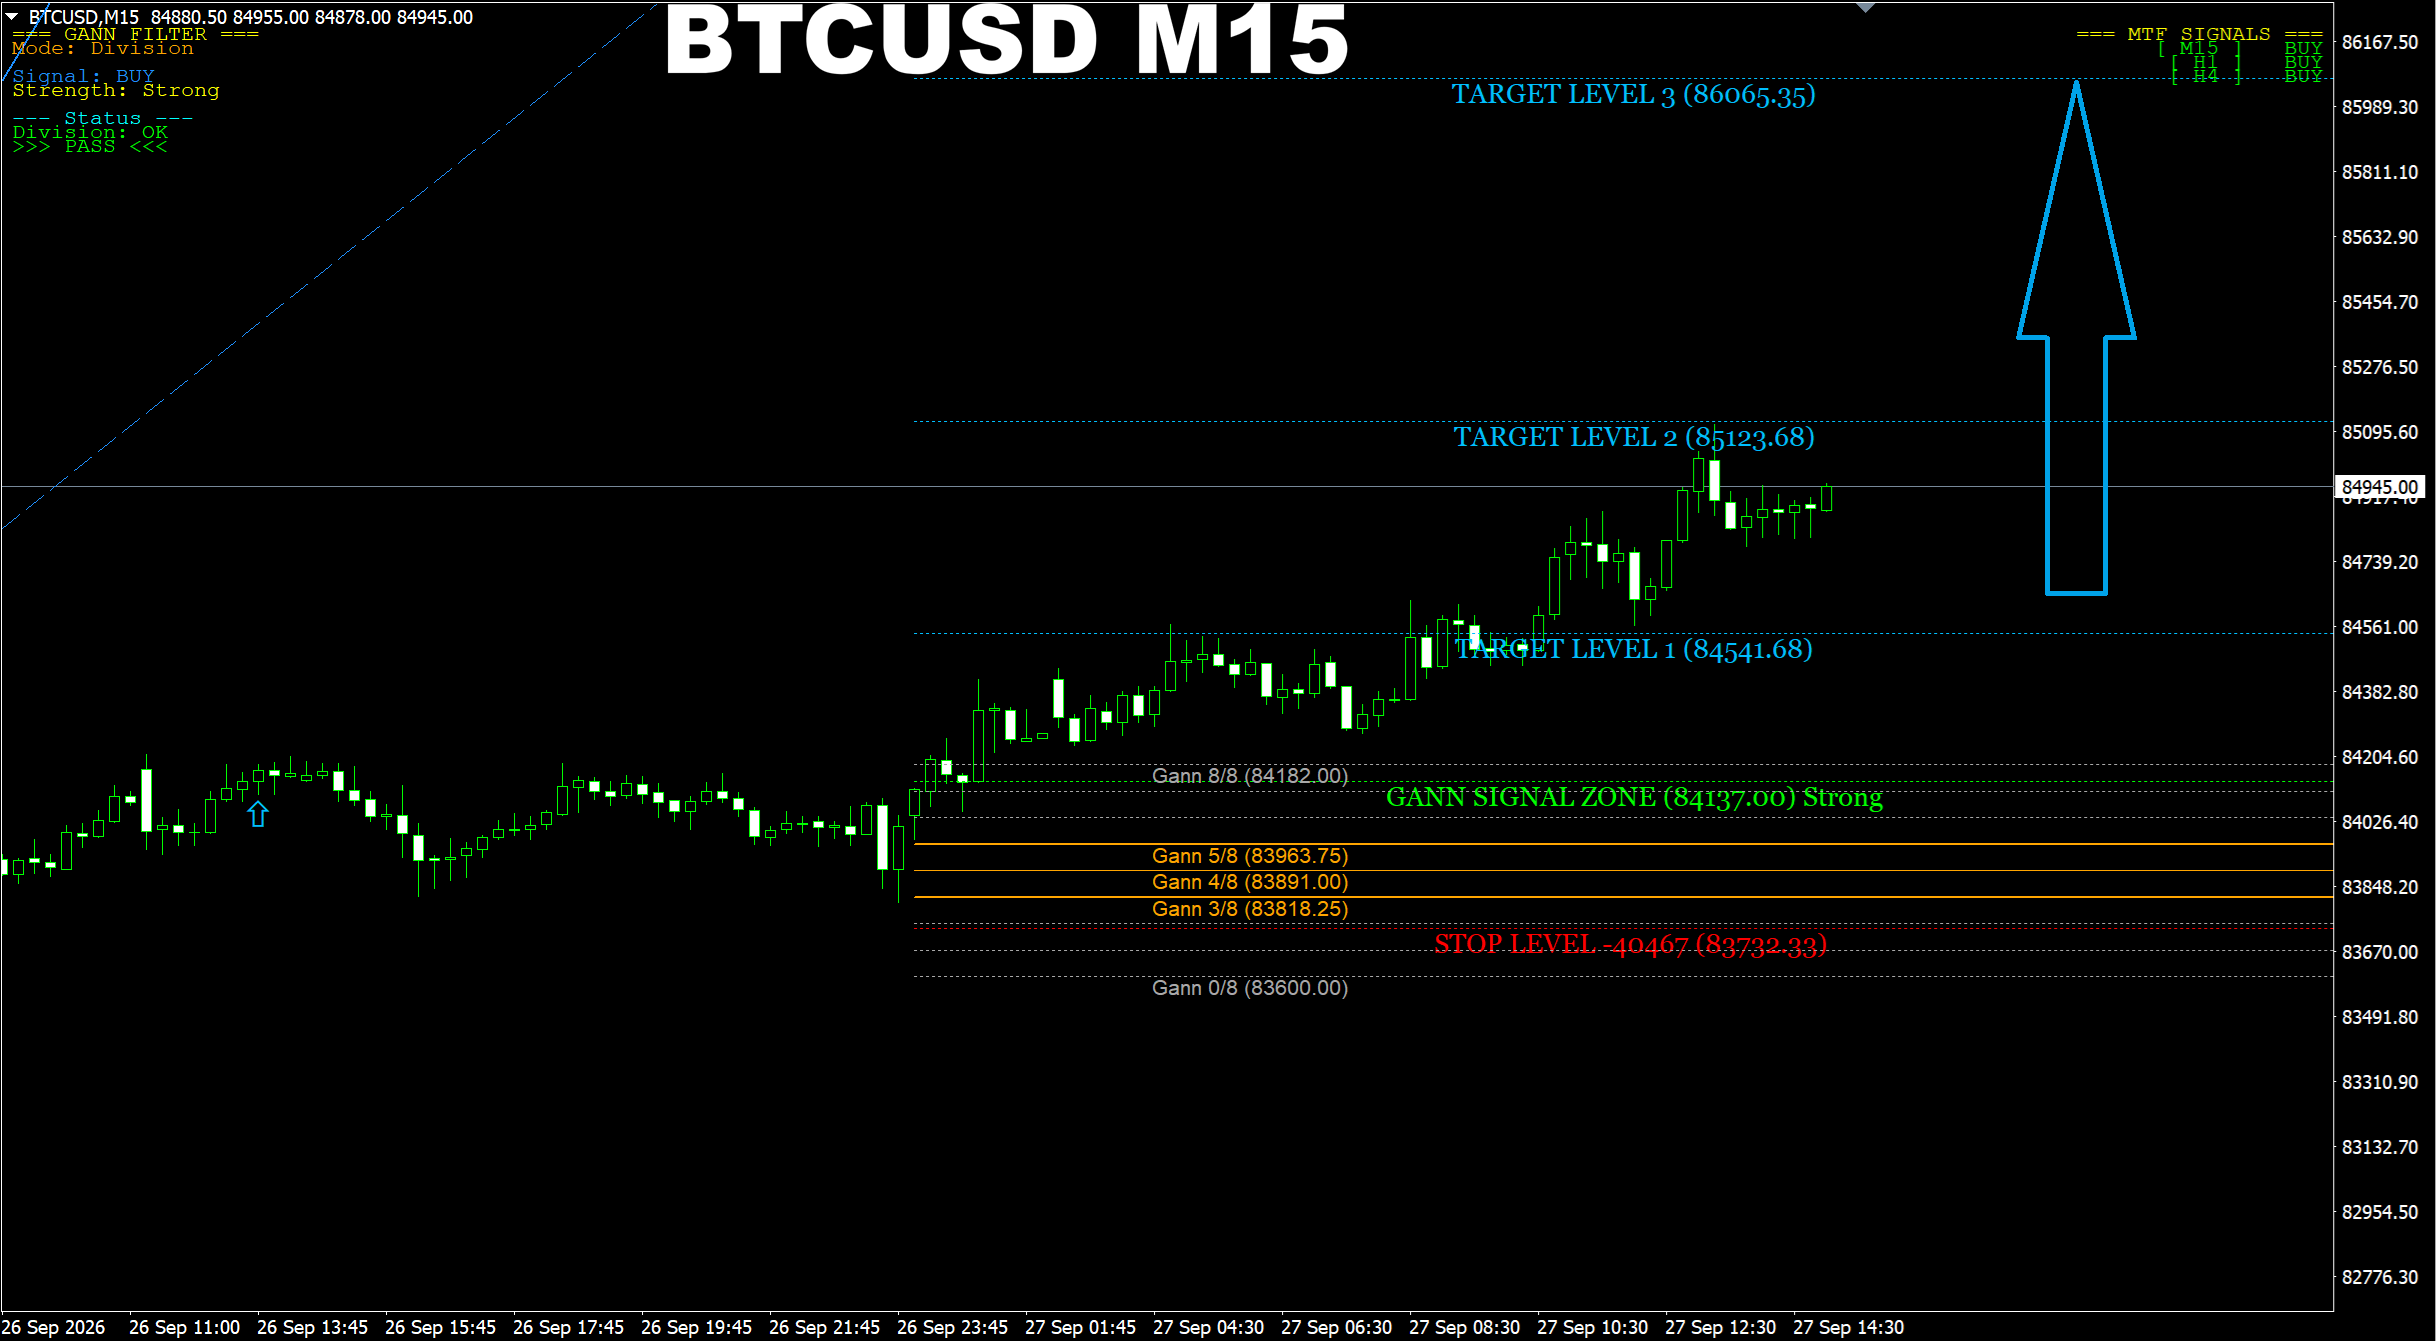
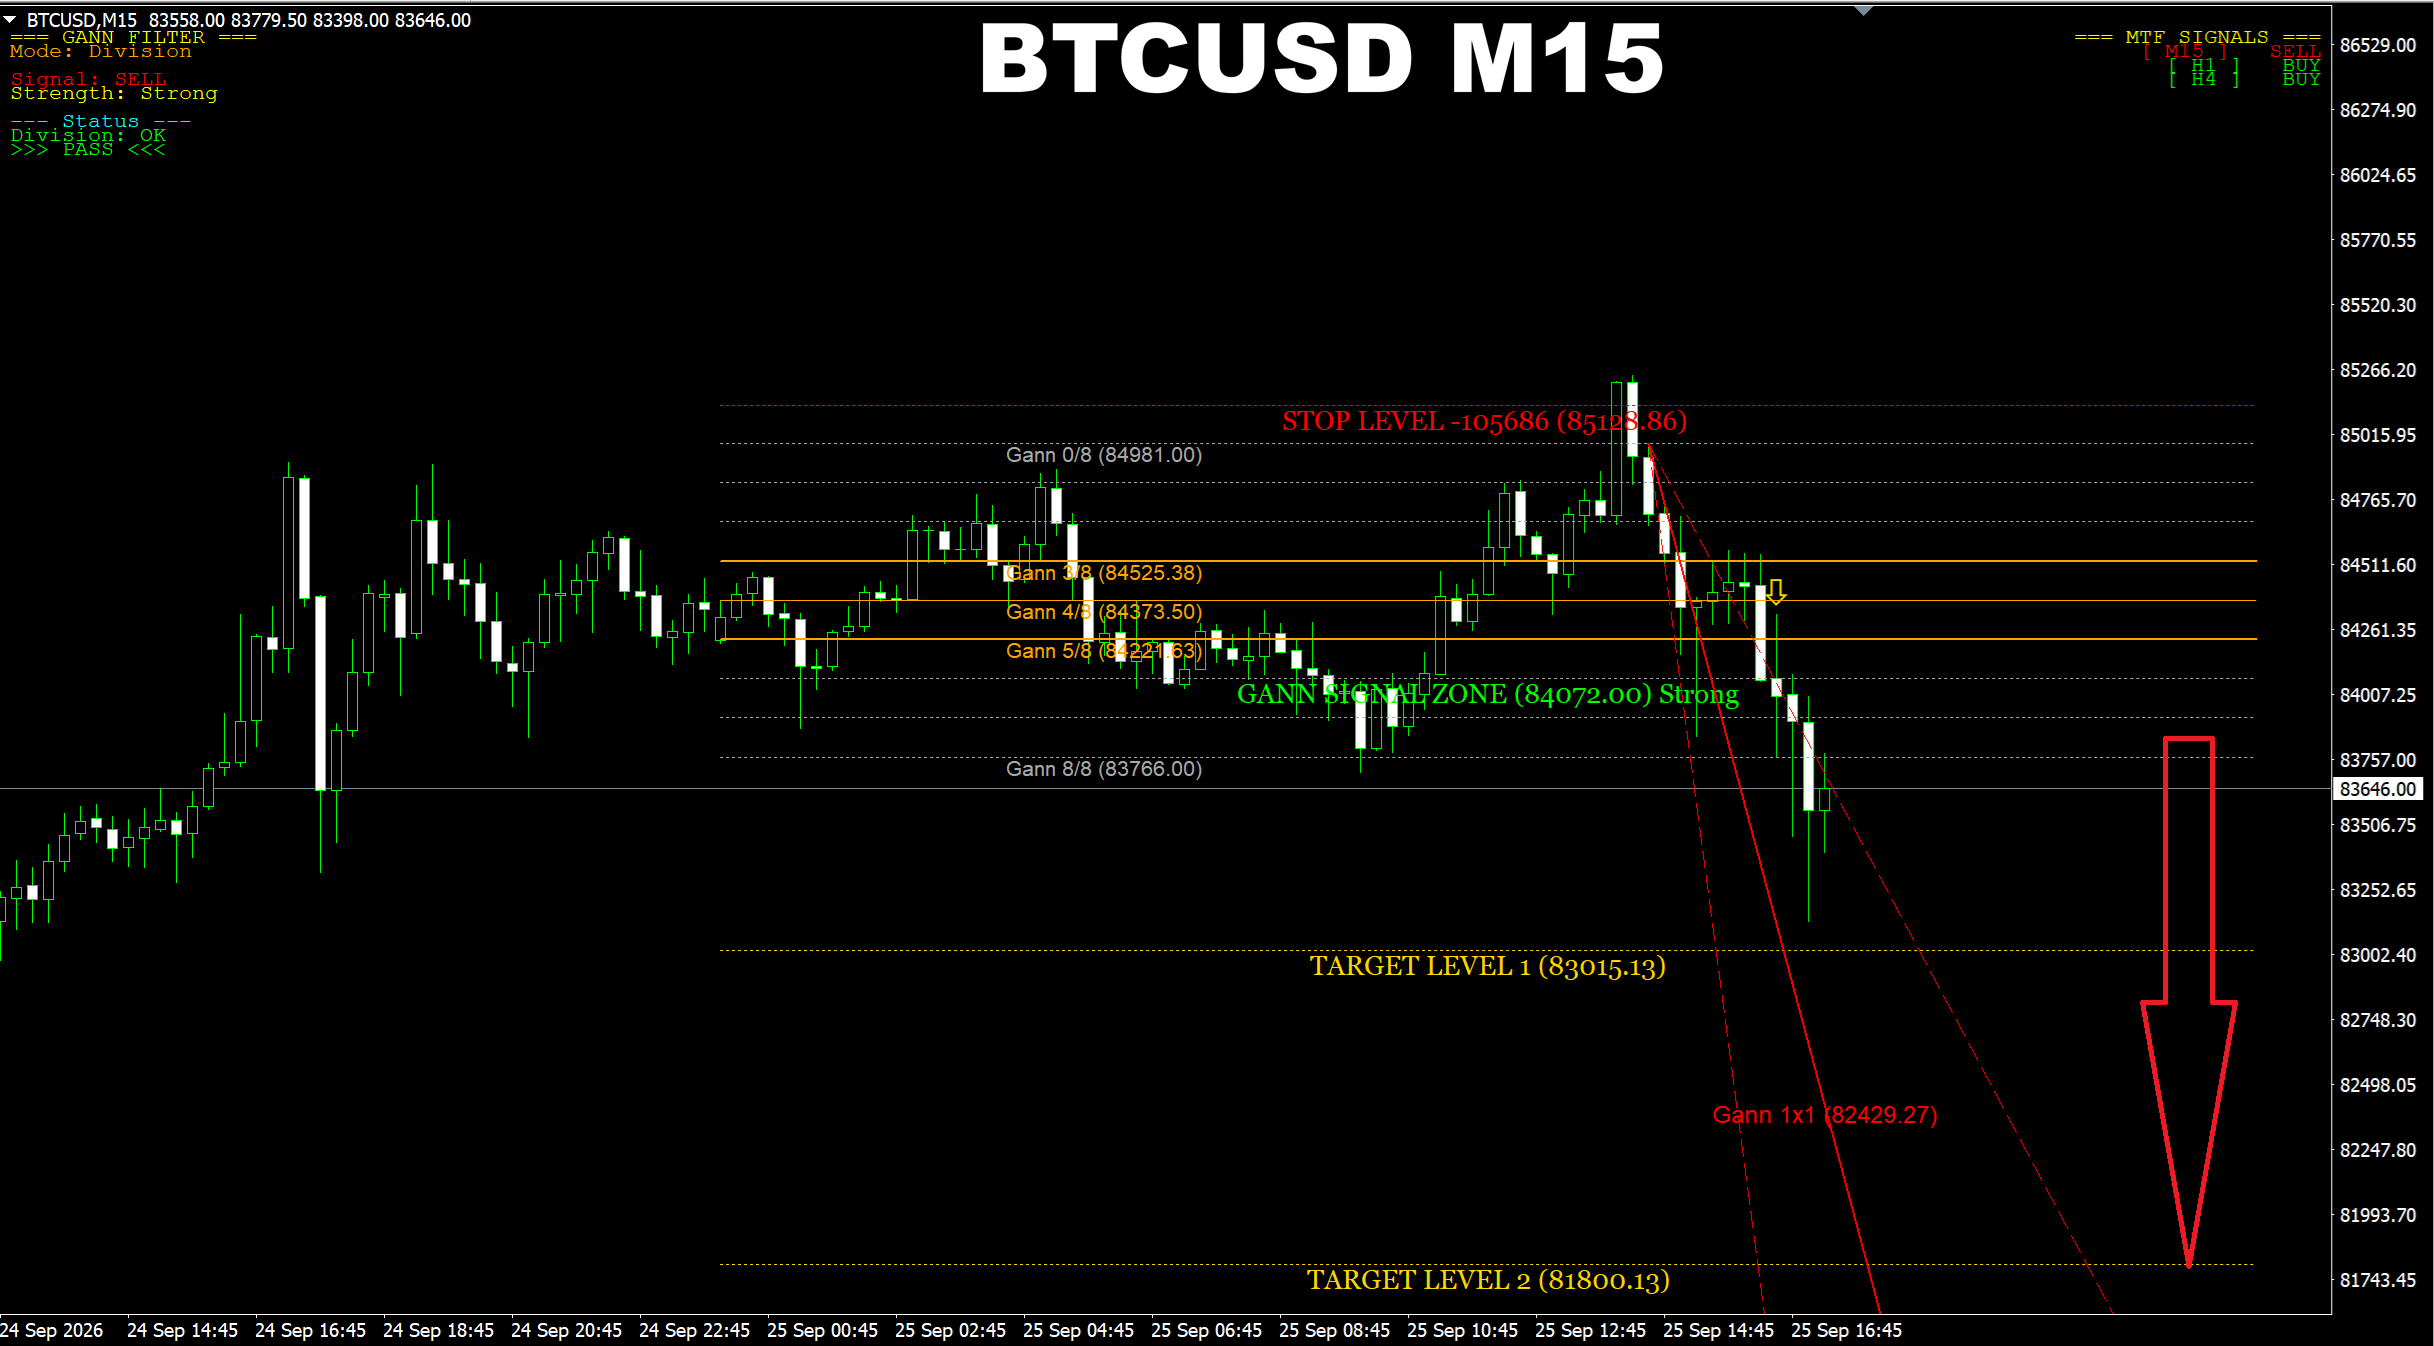
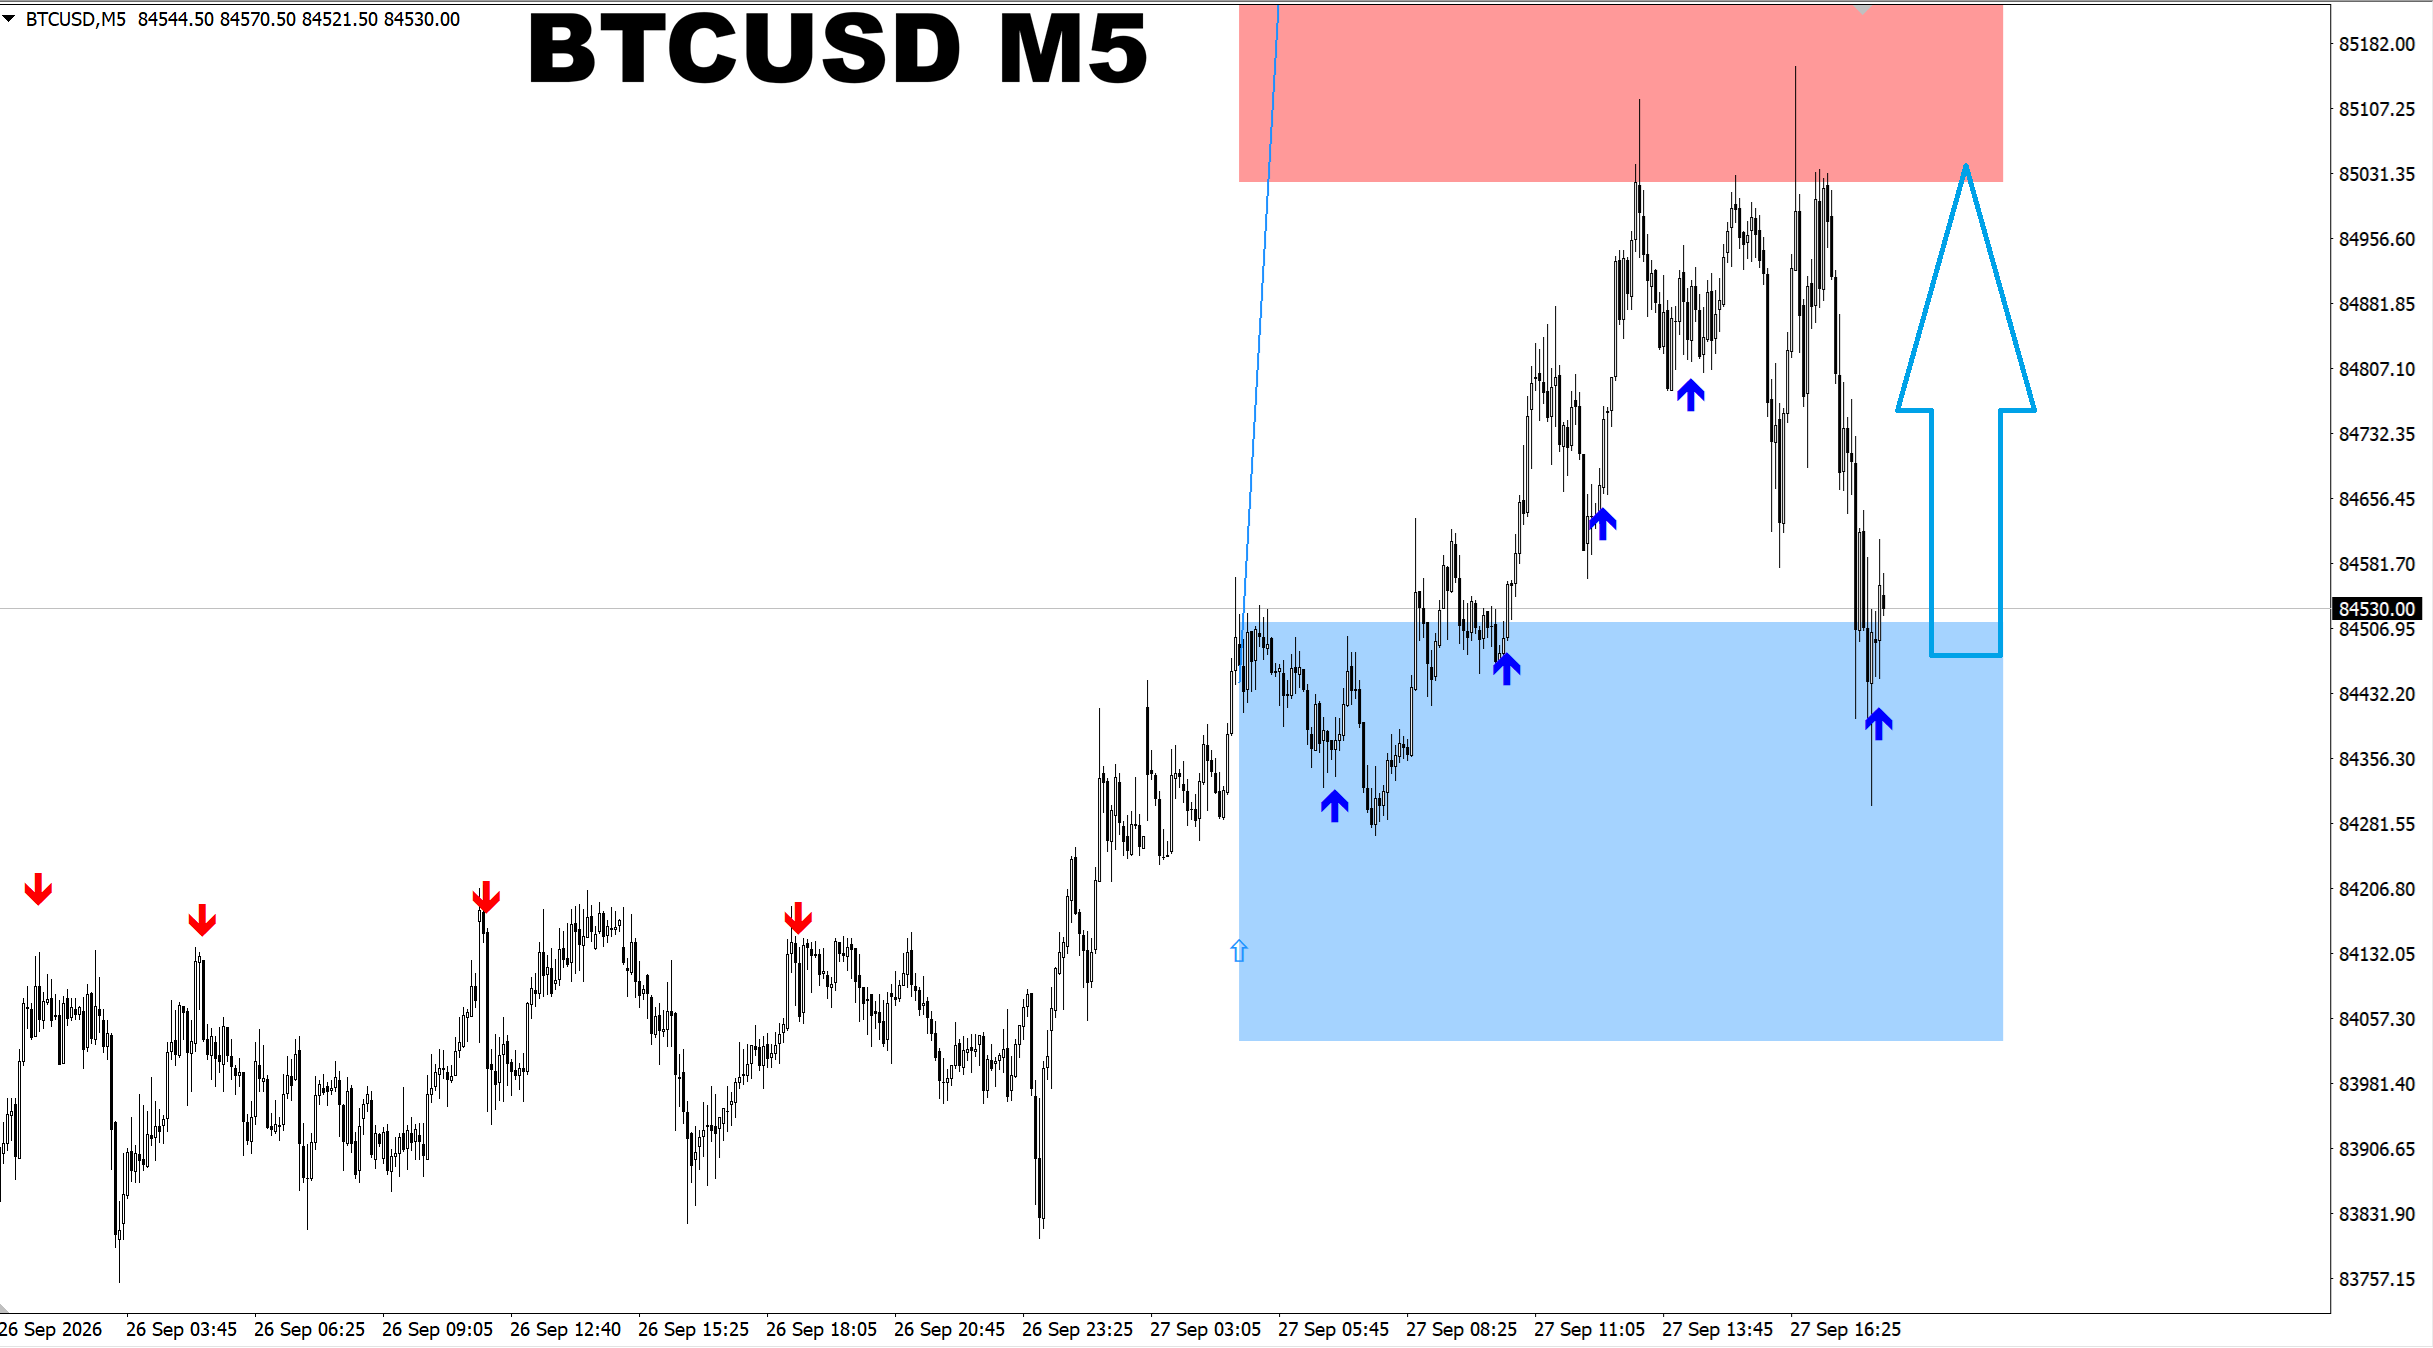
Gann Made Easy. BTCUSD M15. Update on my previous posts. Here I want to show you the target the price is aiming for based on the Gann system. By the way, pay attention how accurately it predicted the start of the new BUY wave. While some other indicators could not "see" the true direction, the Gann system already knew the price was going up. I will remind you the M15 time frame is the optimal time frame when we want to catch a new wave.
Oleg Rodin
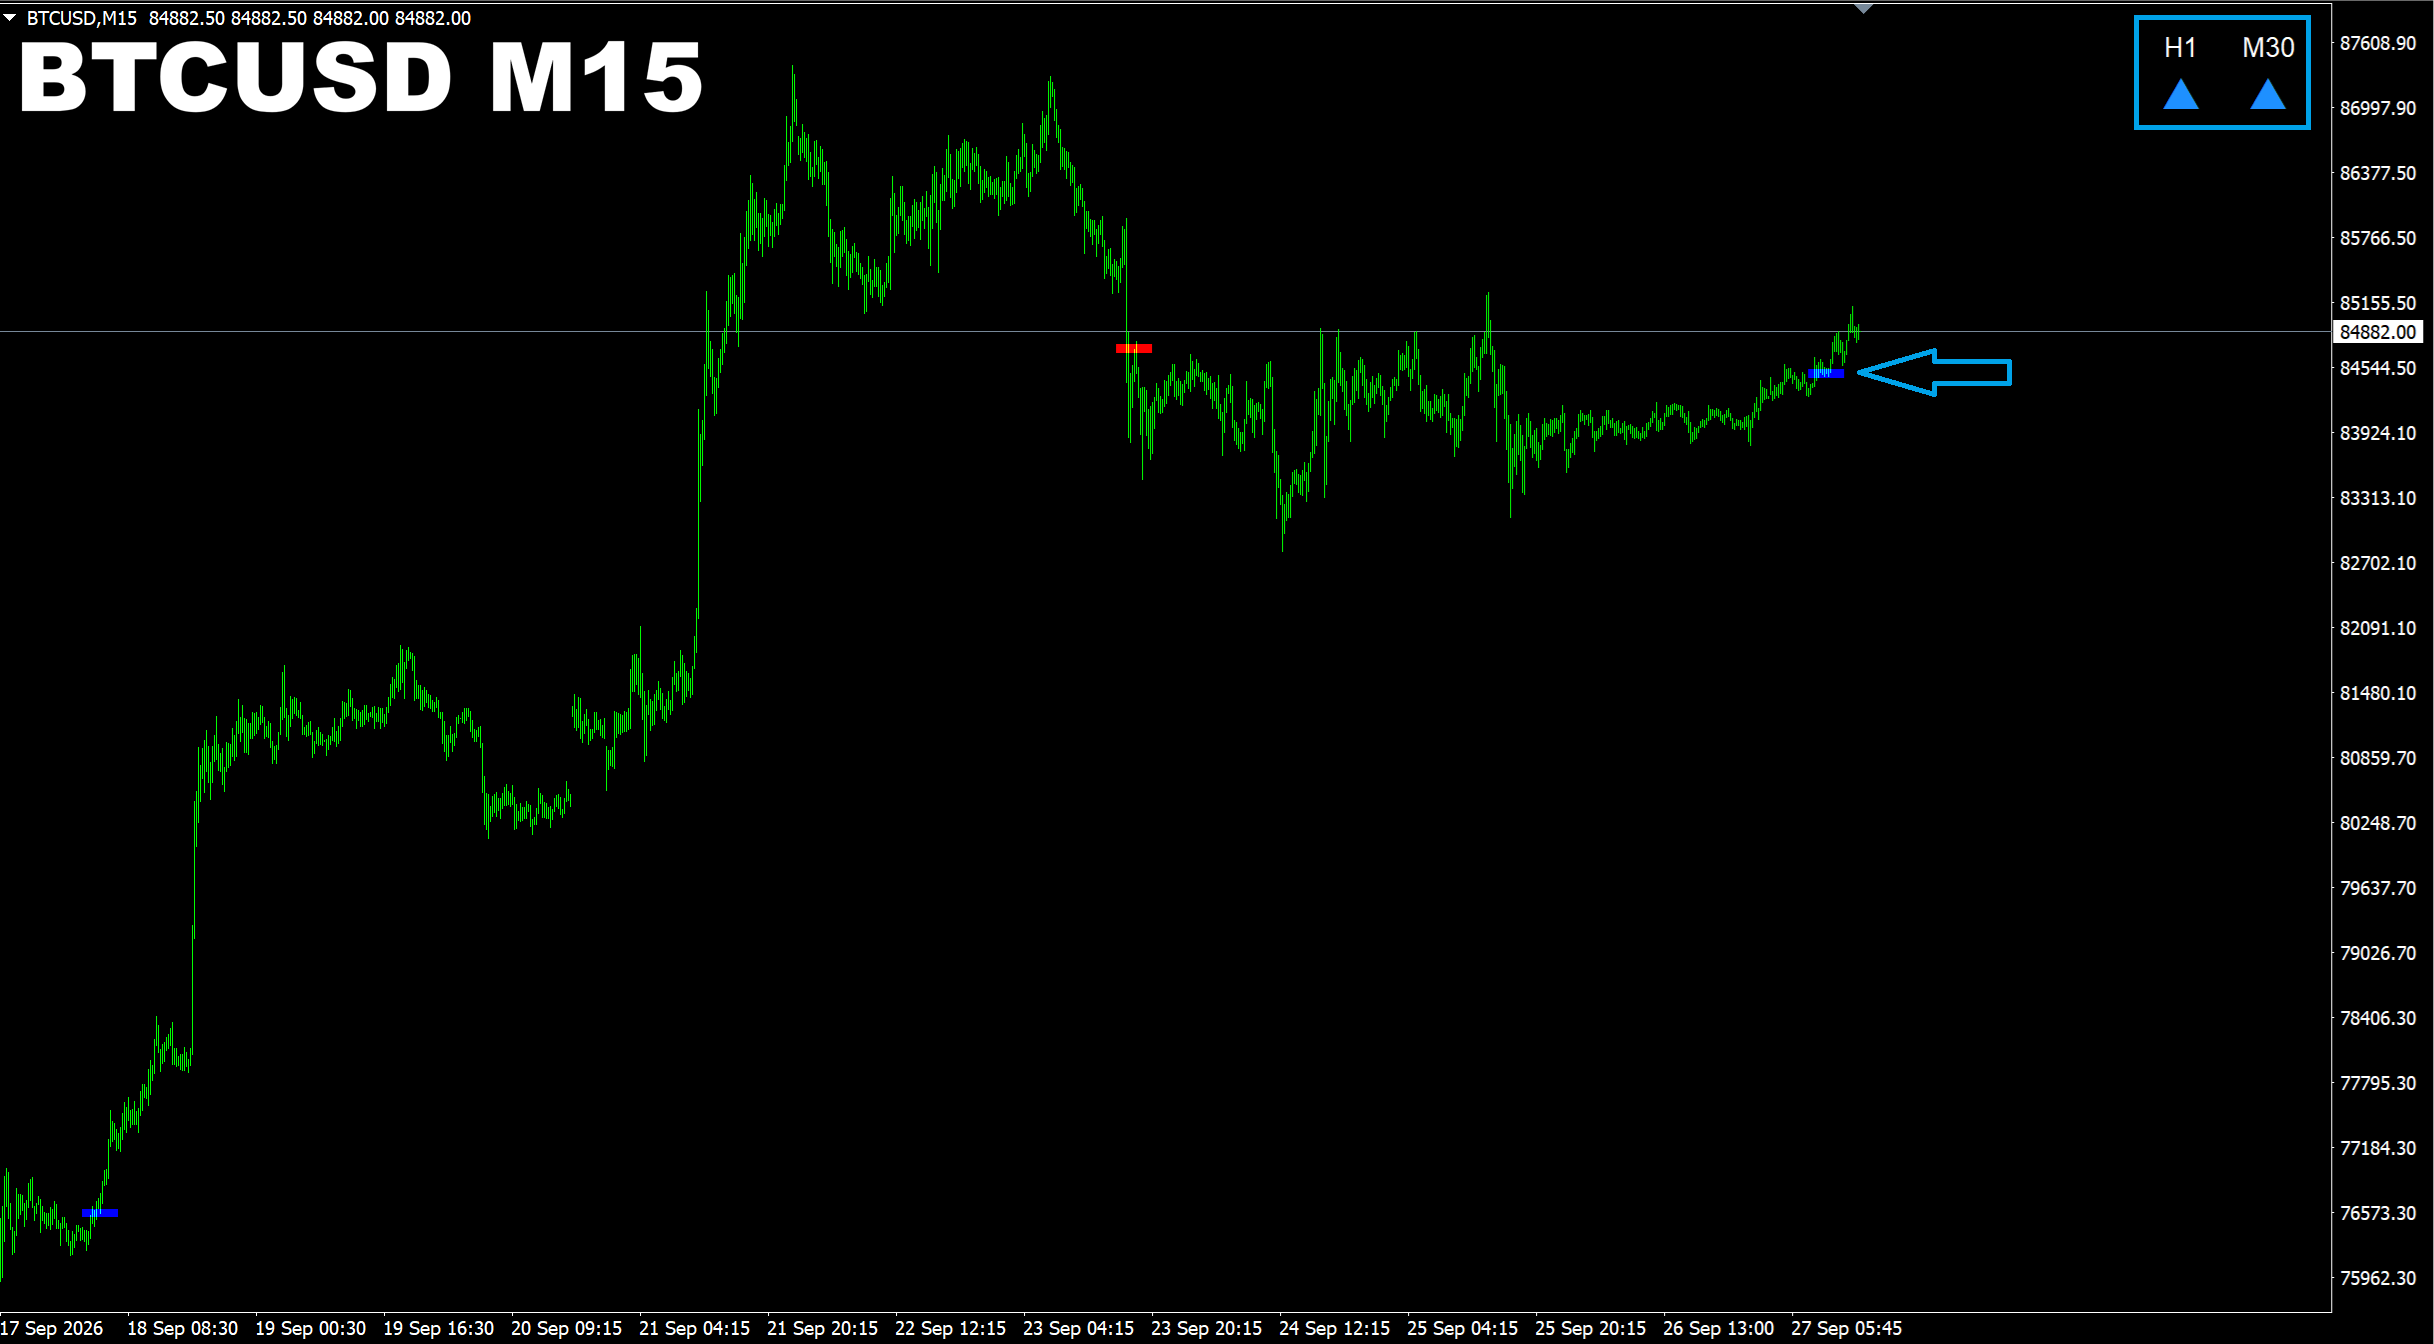
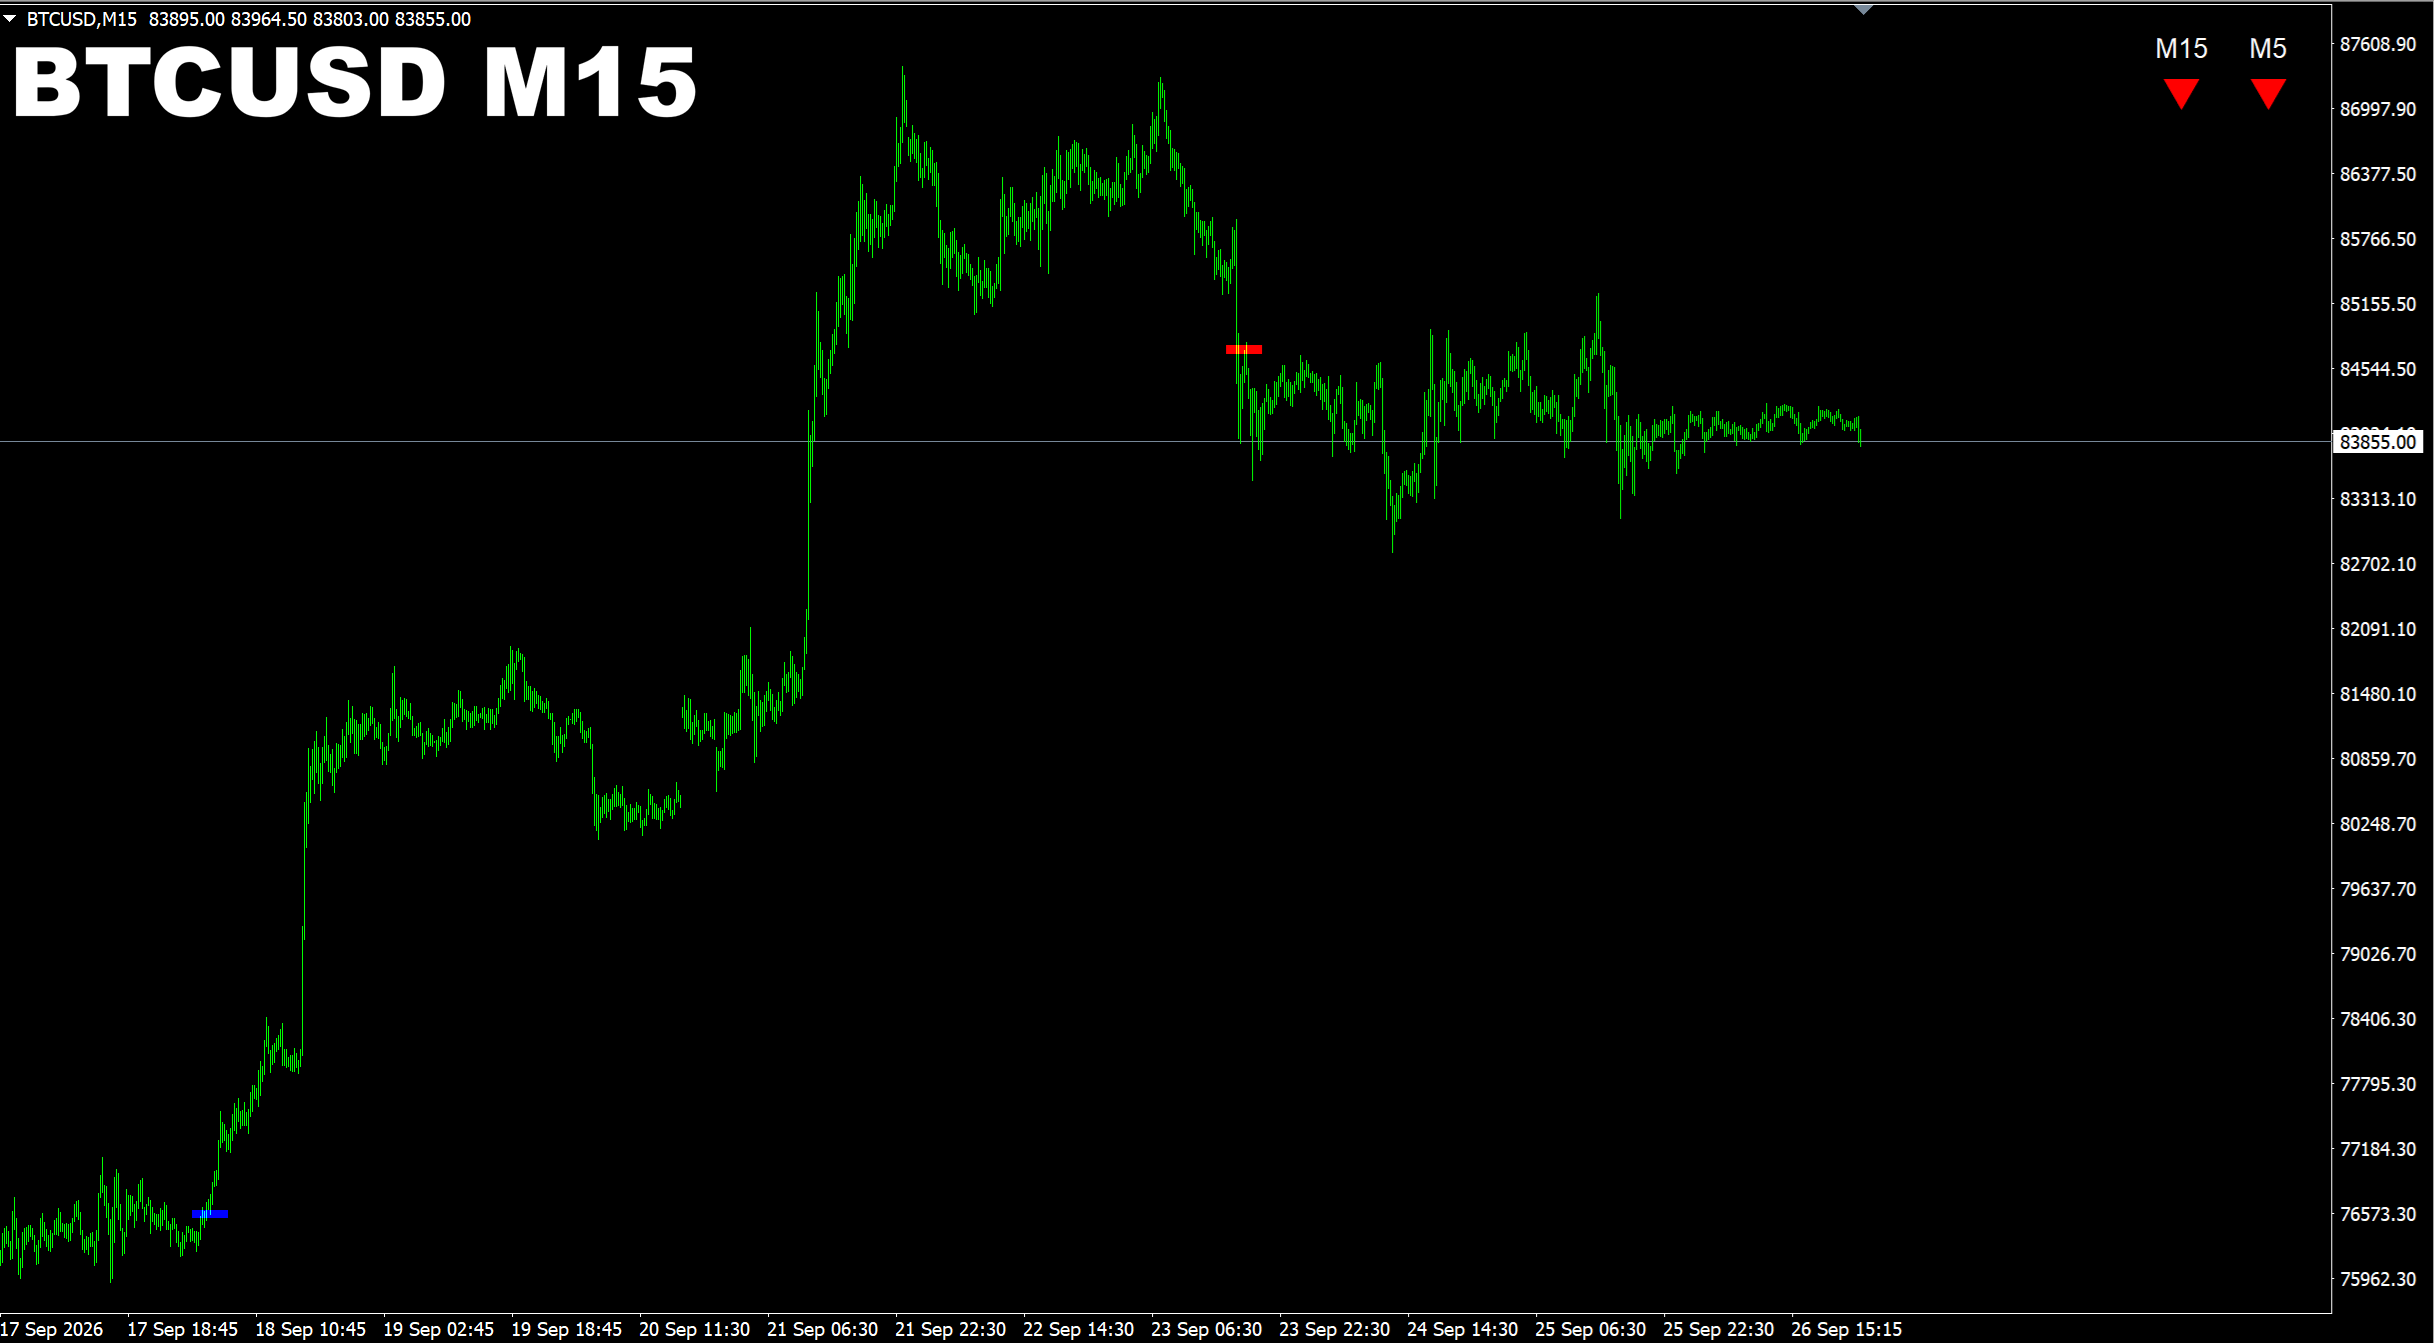
SR Liquidity. BTCUSD M15. Update on current market. We have a BUY signal confirmed by the higher time frames. We need to be prepared that the price will be going UP! Watch my recent two posts based on the CSW indicator to have a better picture of the market.
Oleg Rodin
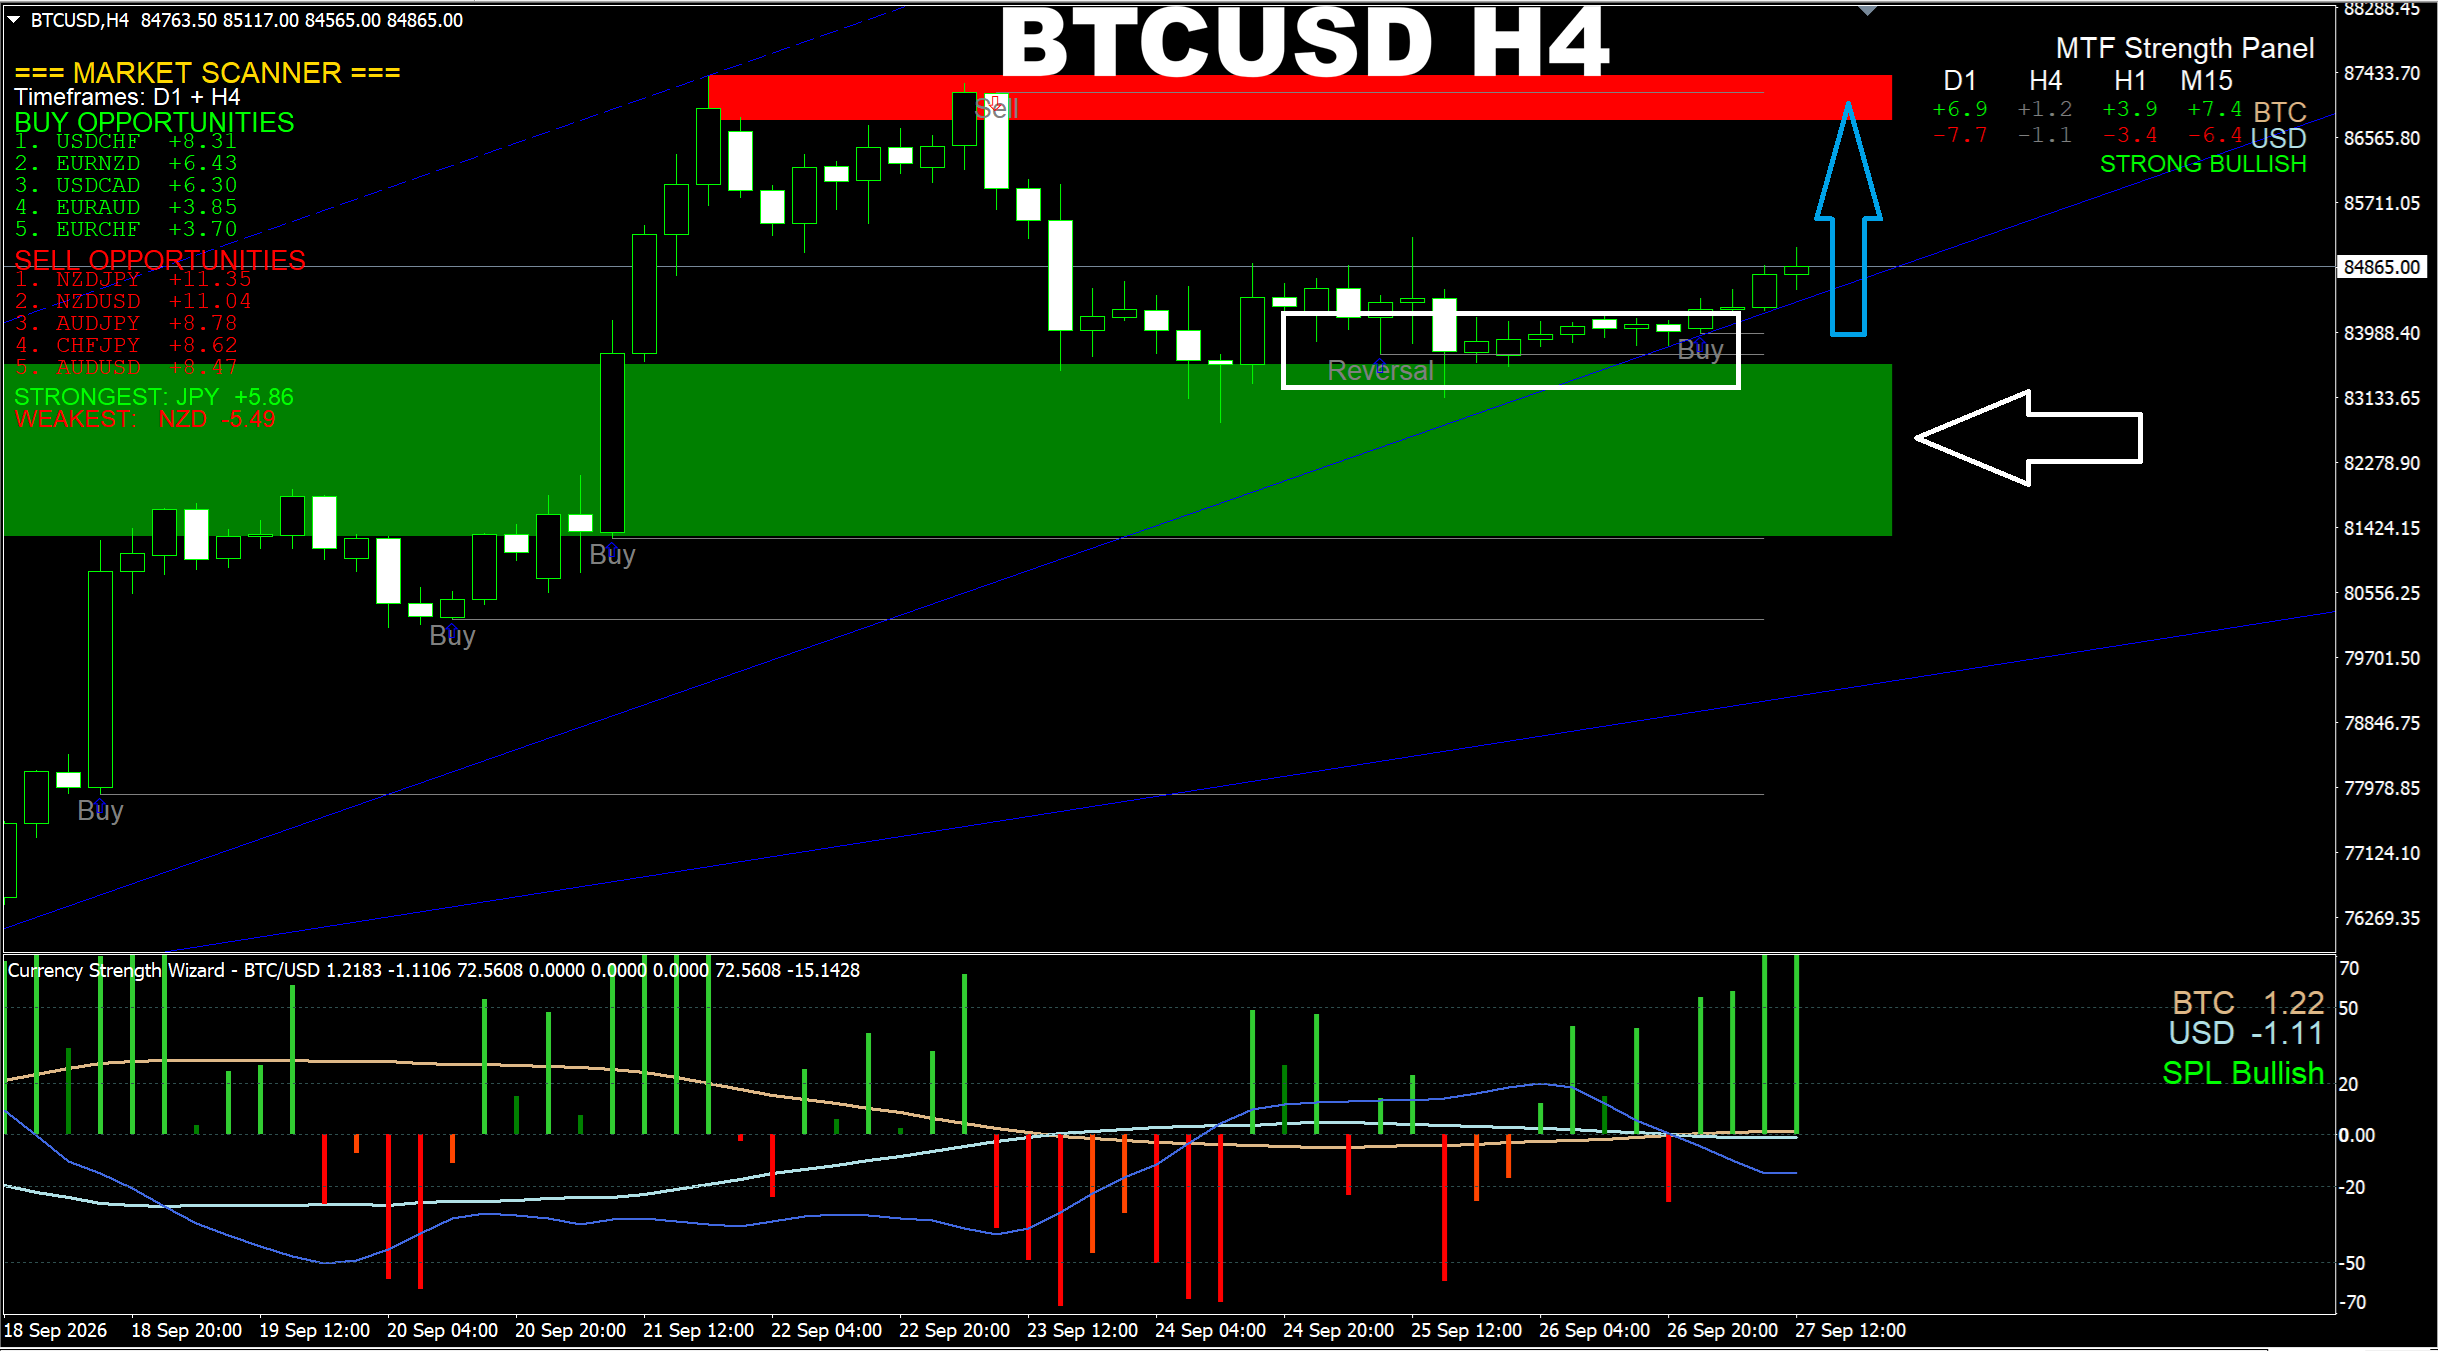
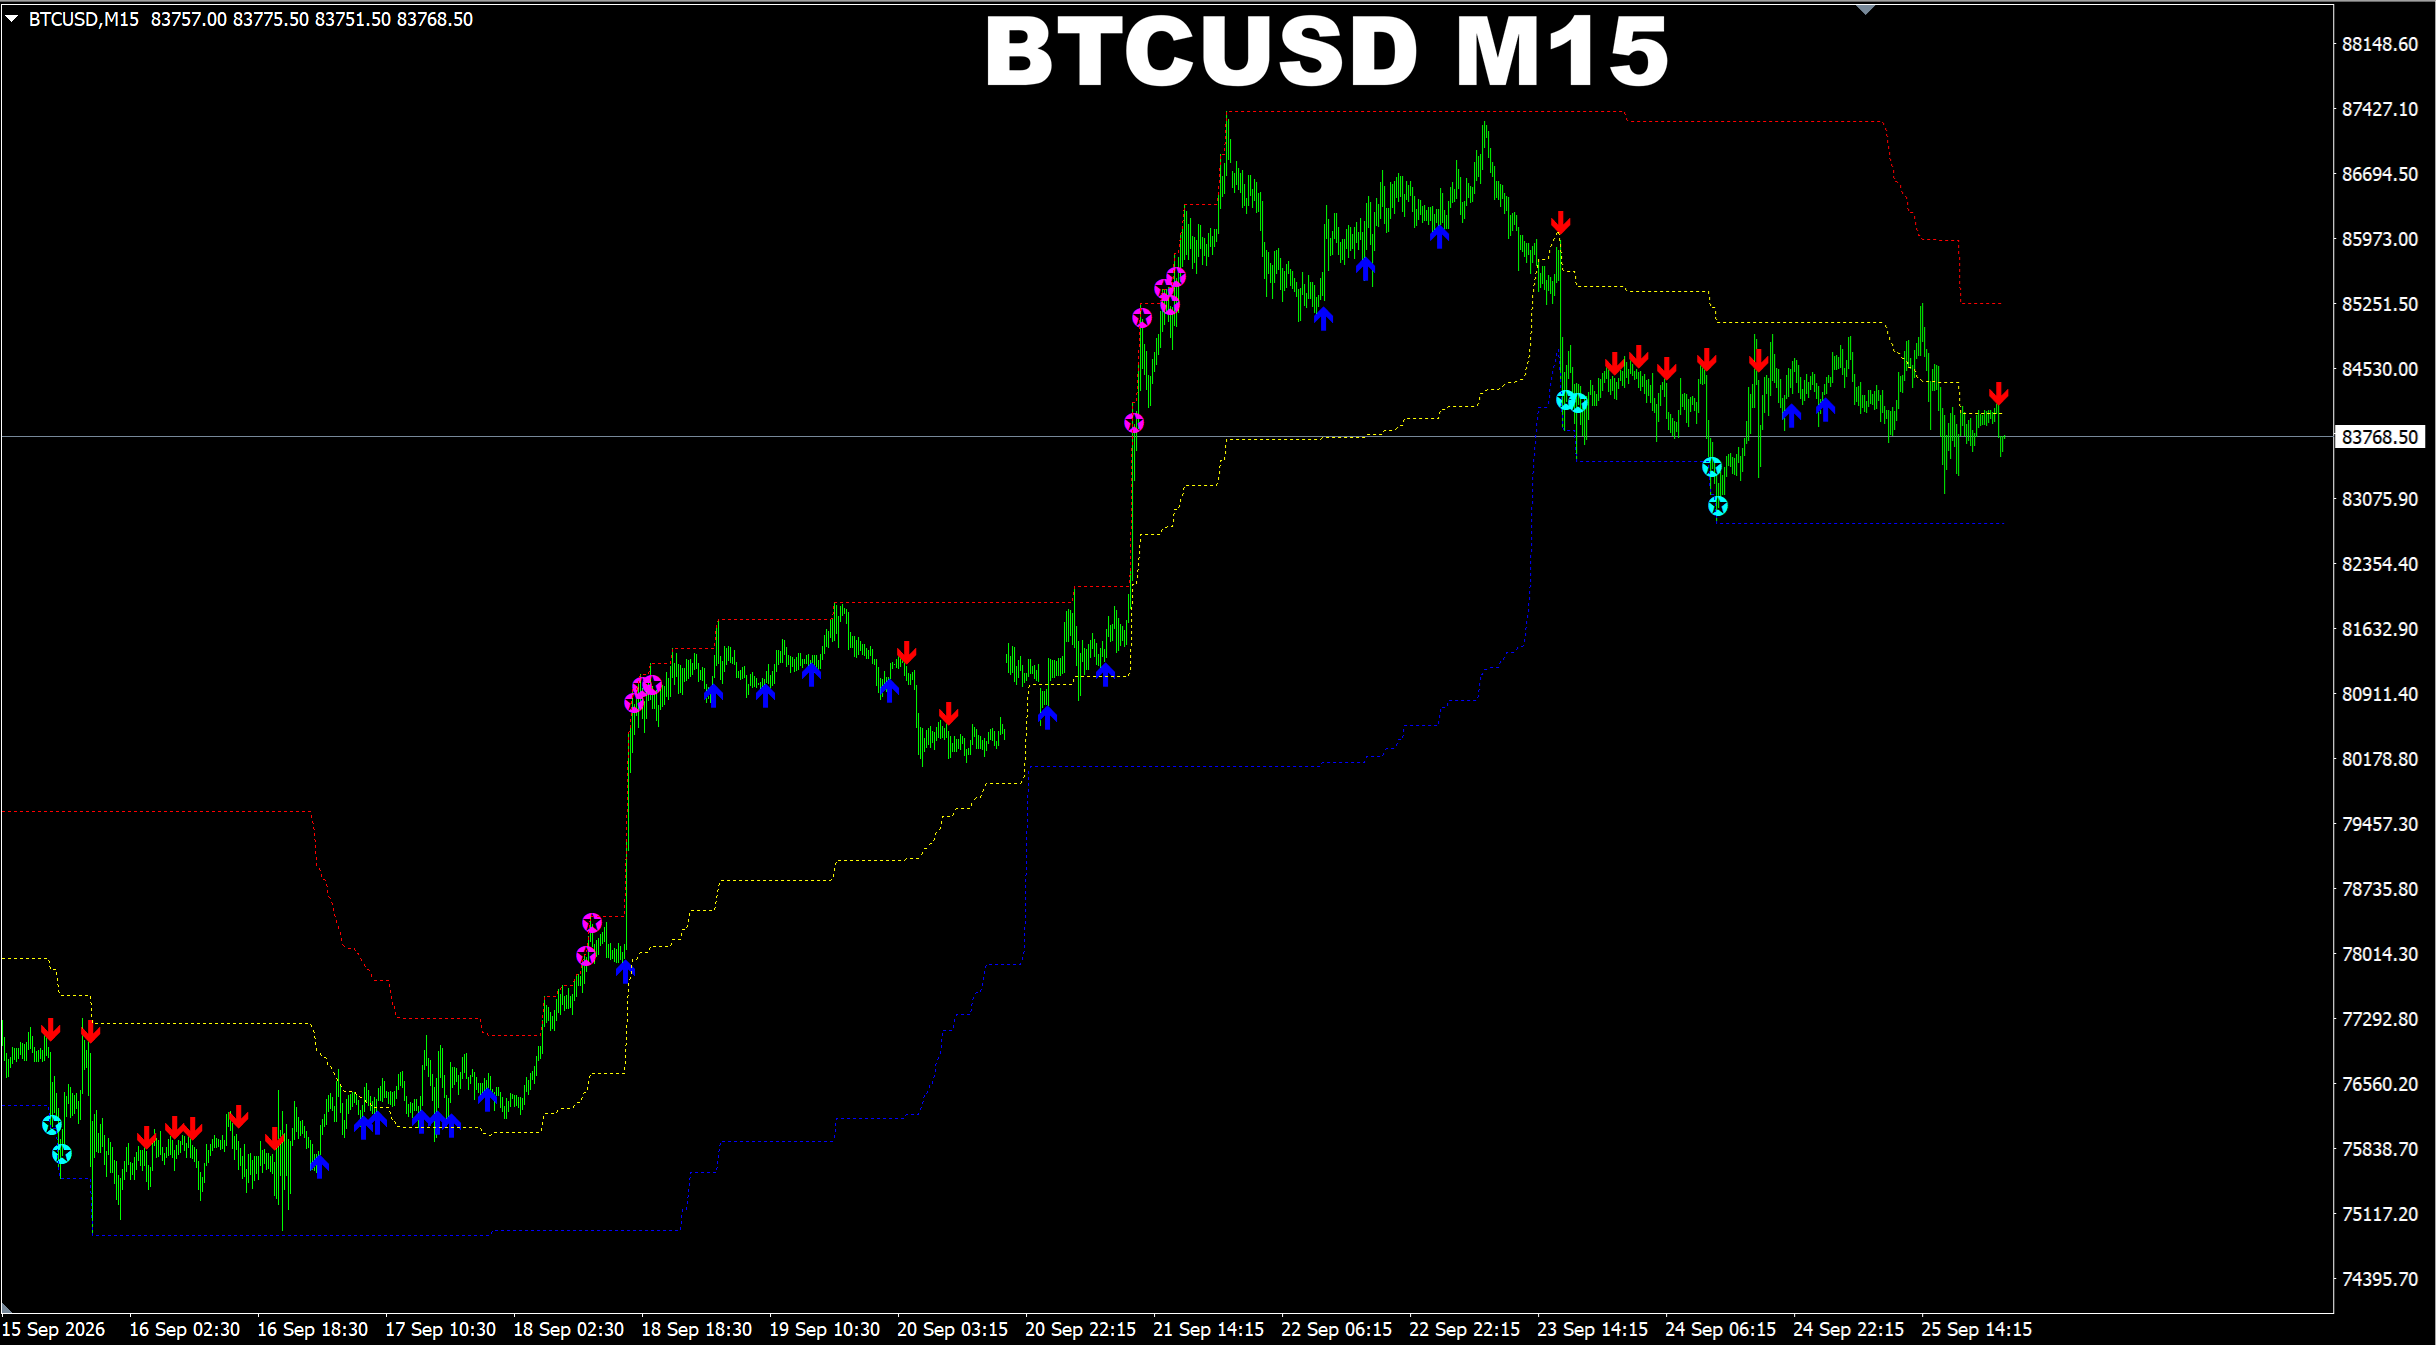
Currency Strength Wizard. BTCUSD H4. Update on my previous post. Here I want to share with you what we have on H4 chart based on the CSW system. There are many buy orders are sitting down below aiming for the 87K area.
Oleg Rodin
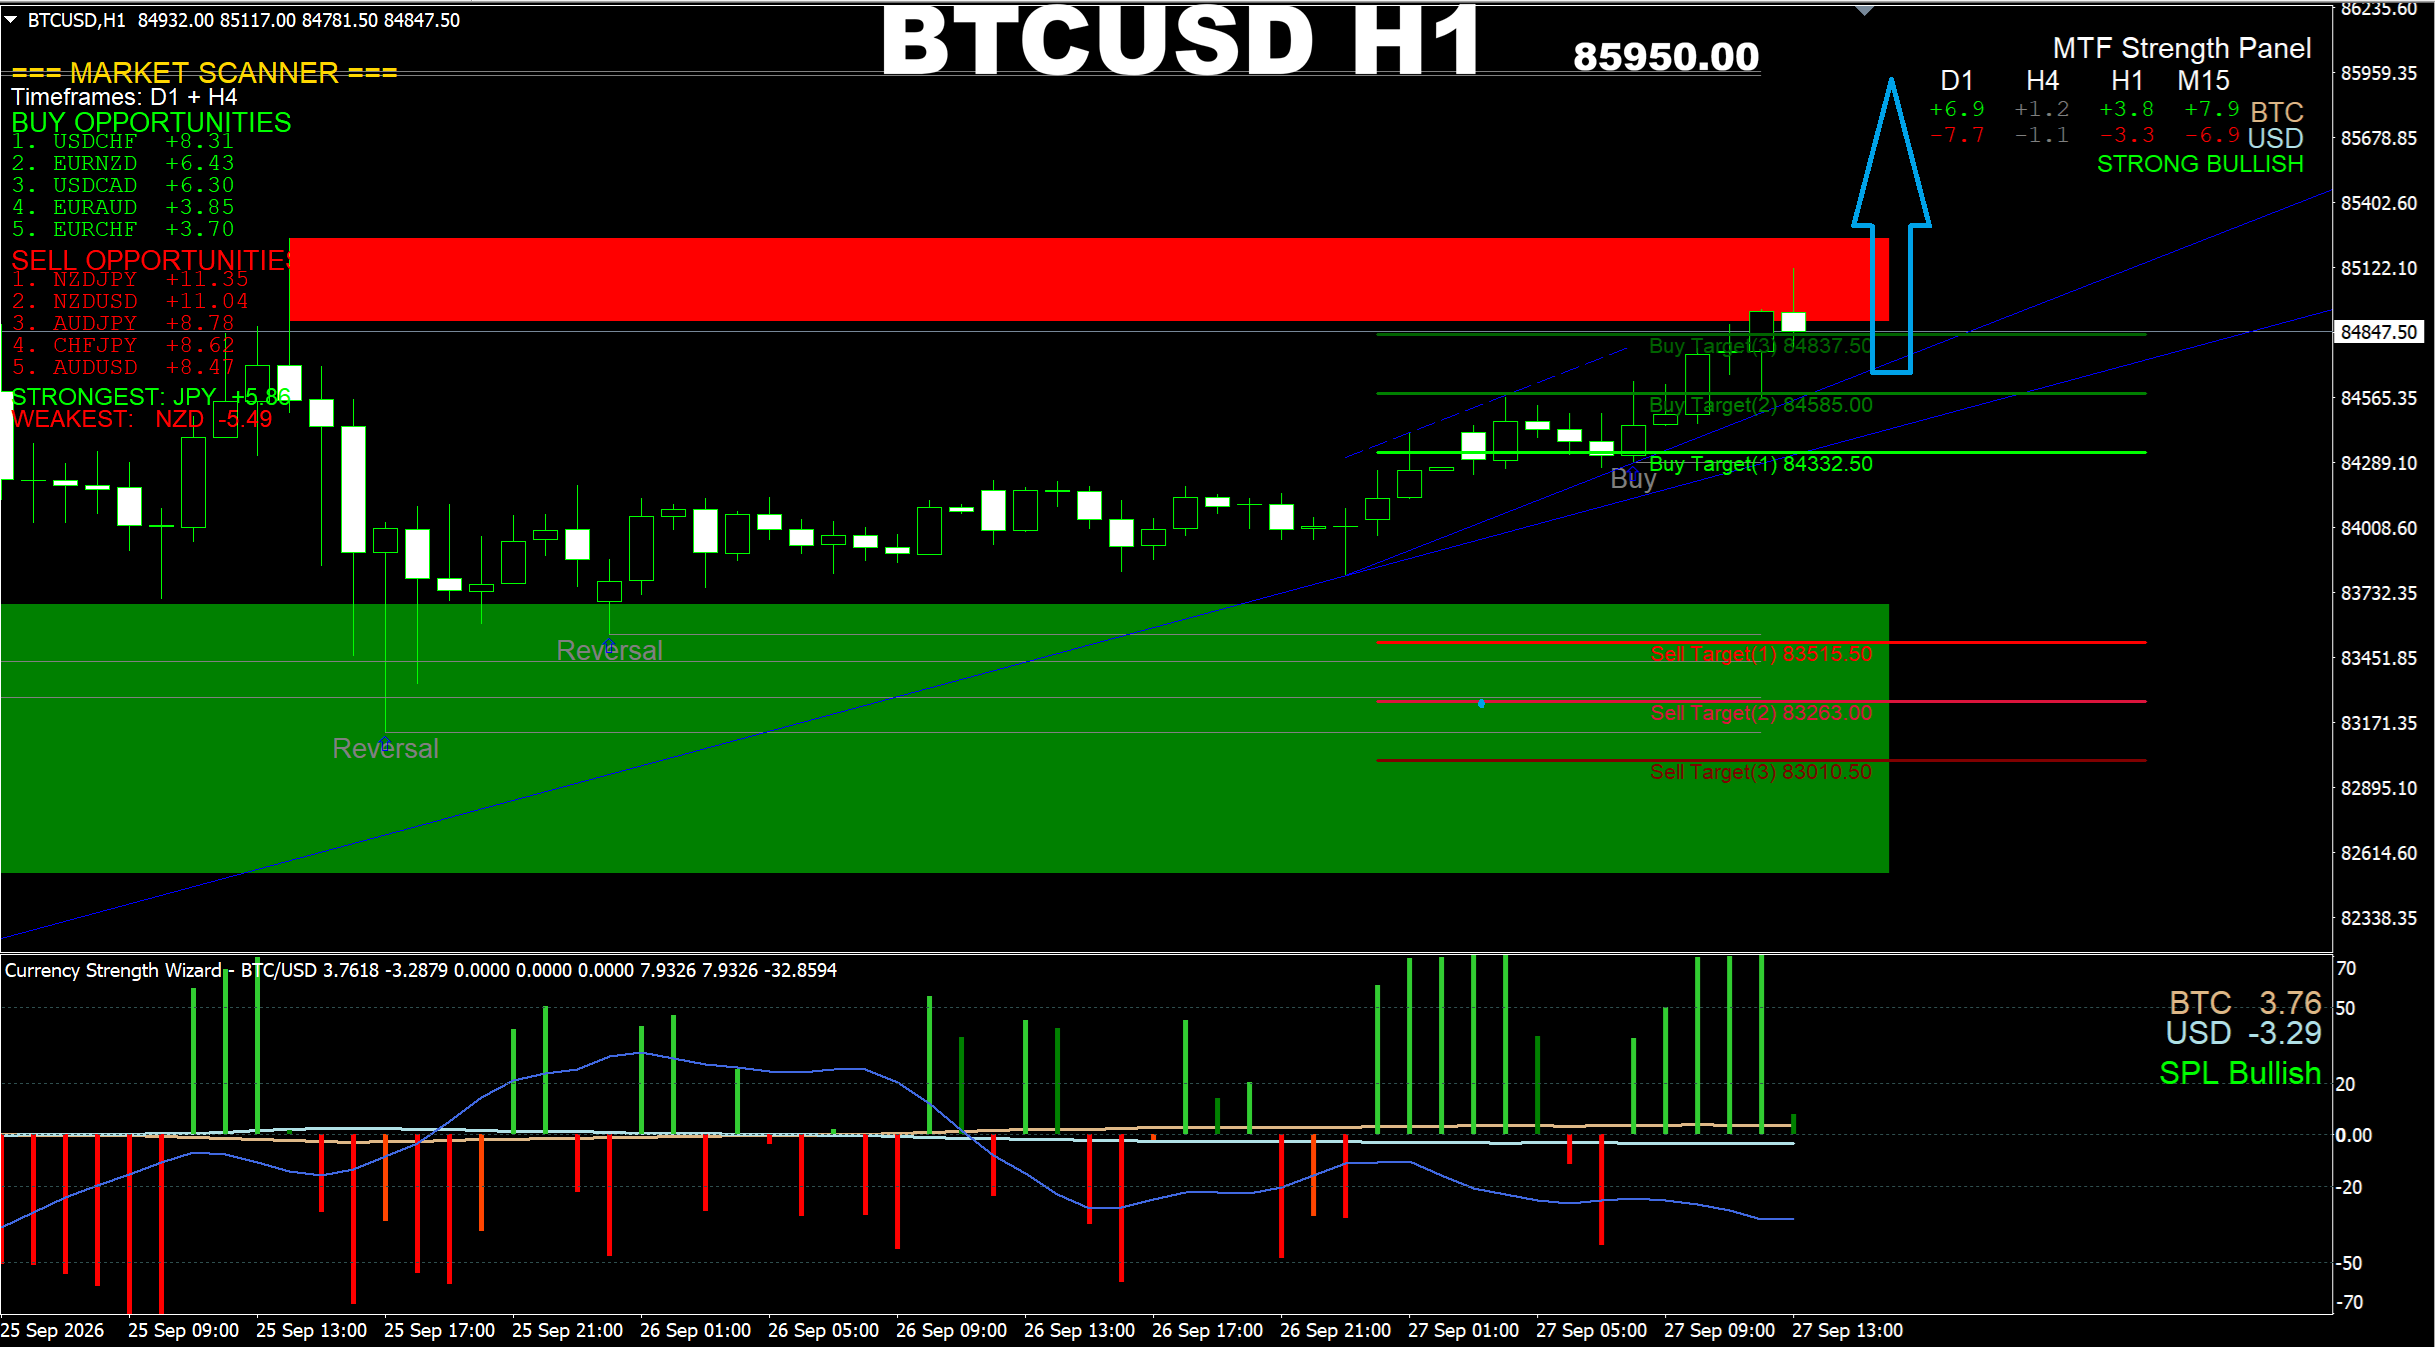
Currency Strength Wizard. BTCUSD H1. We have a strong Demand zone down below which has pushed the price UP toward recent Supply area. Based on MTF analysis, we will see the proce going higher toward the 85950.00 area. So current Supply zone may be breached in the near future.
Oleg Rodin
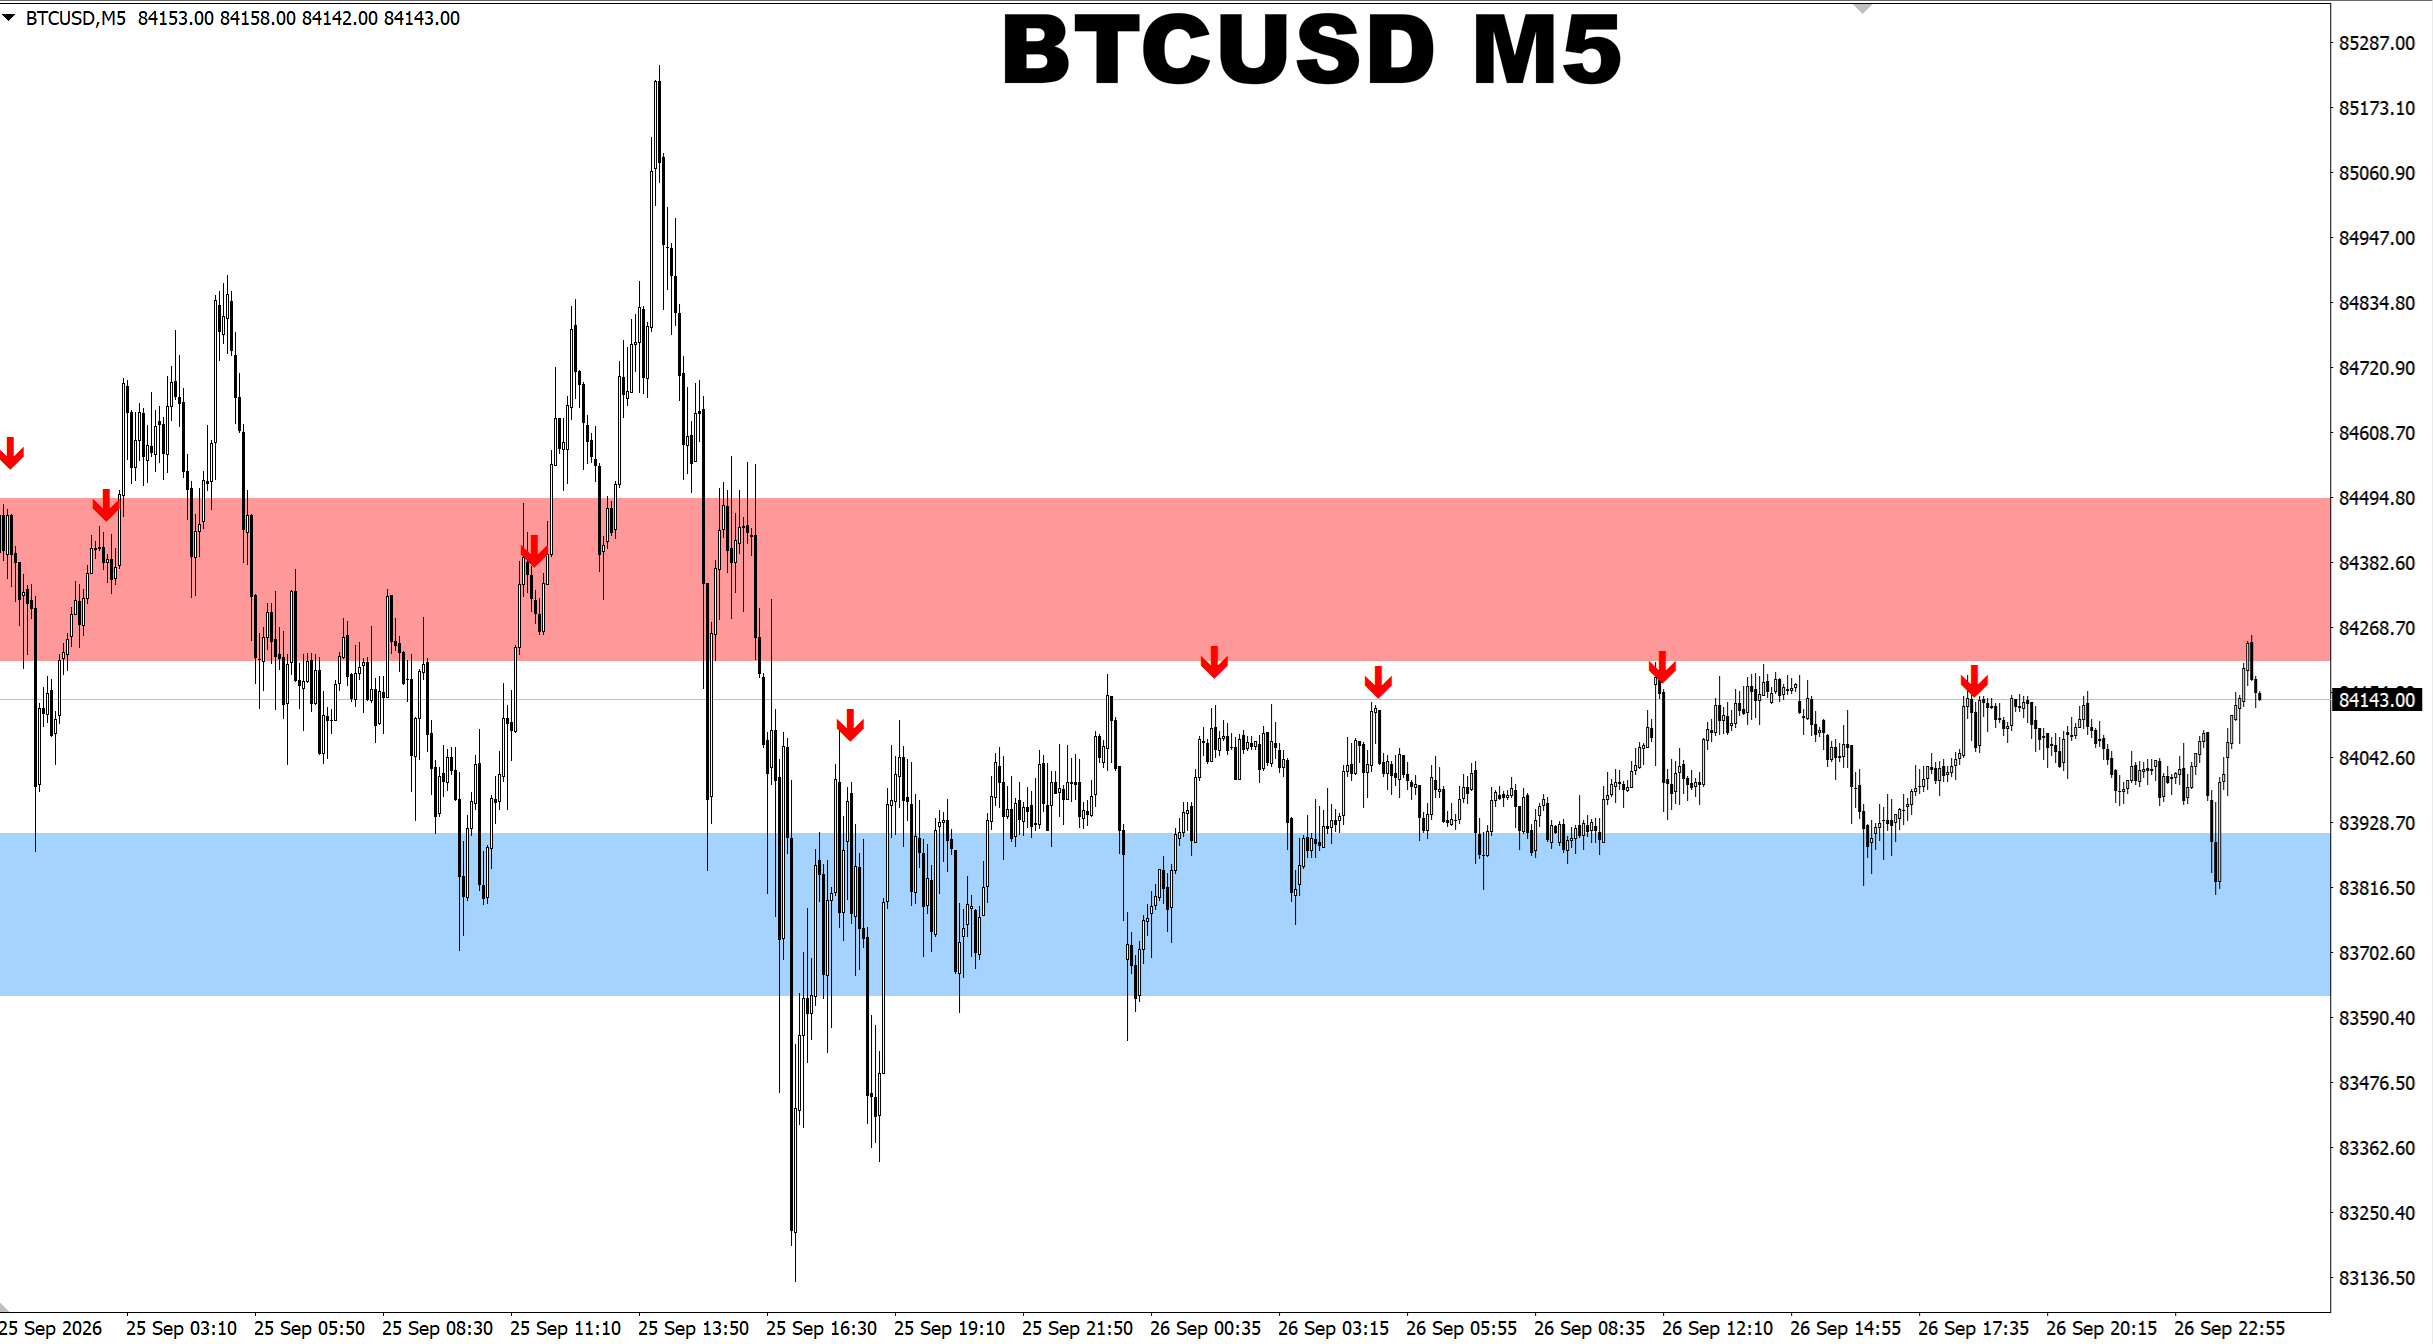
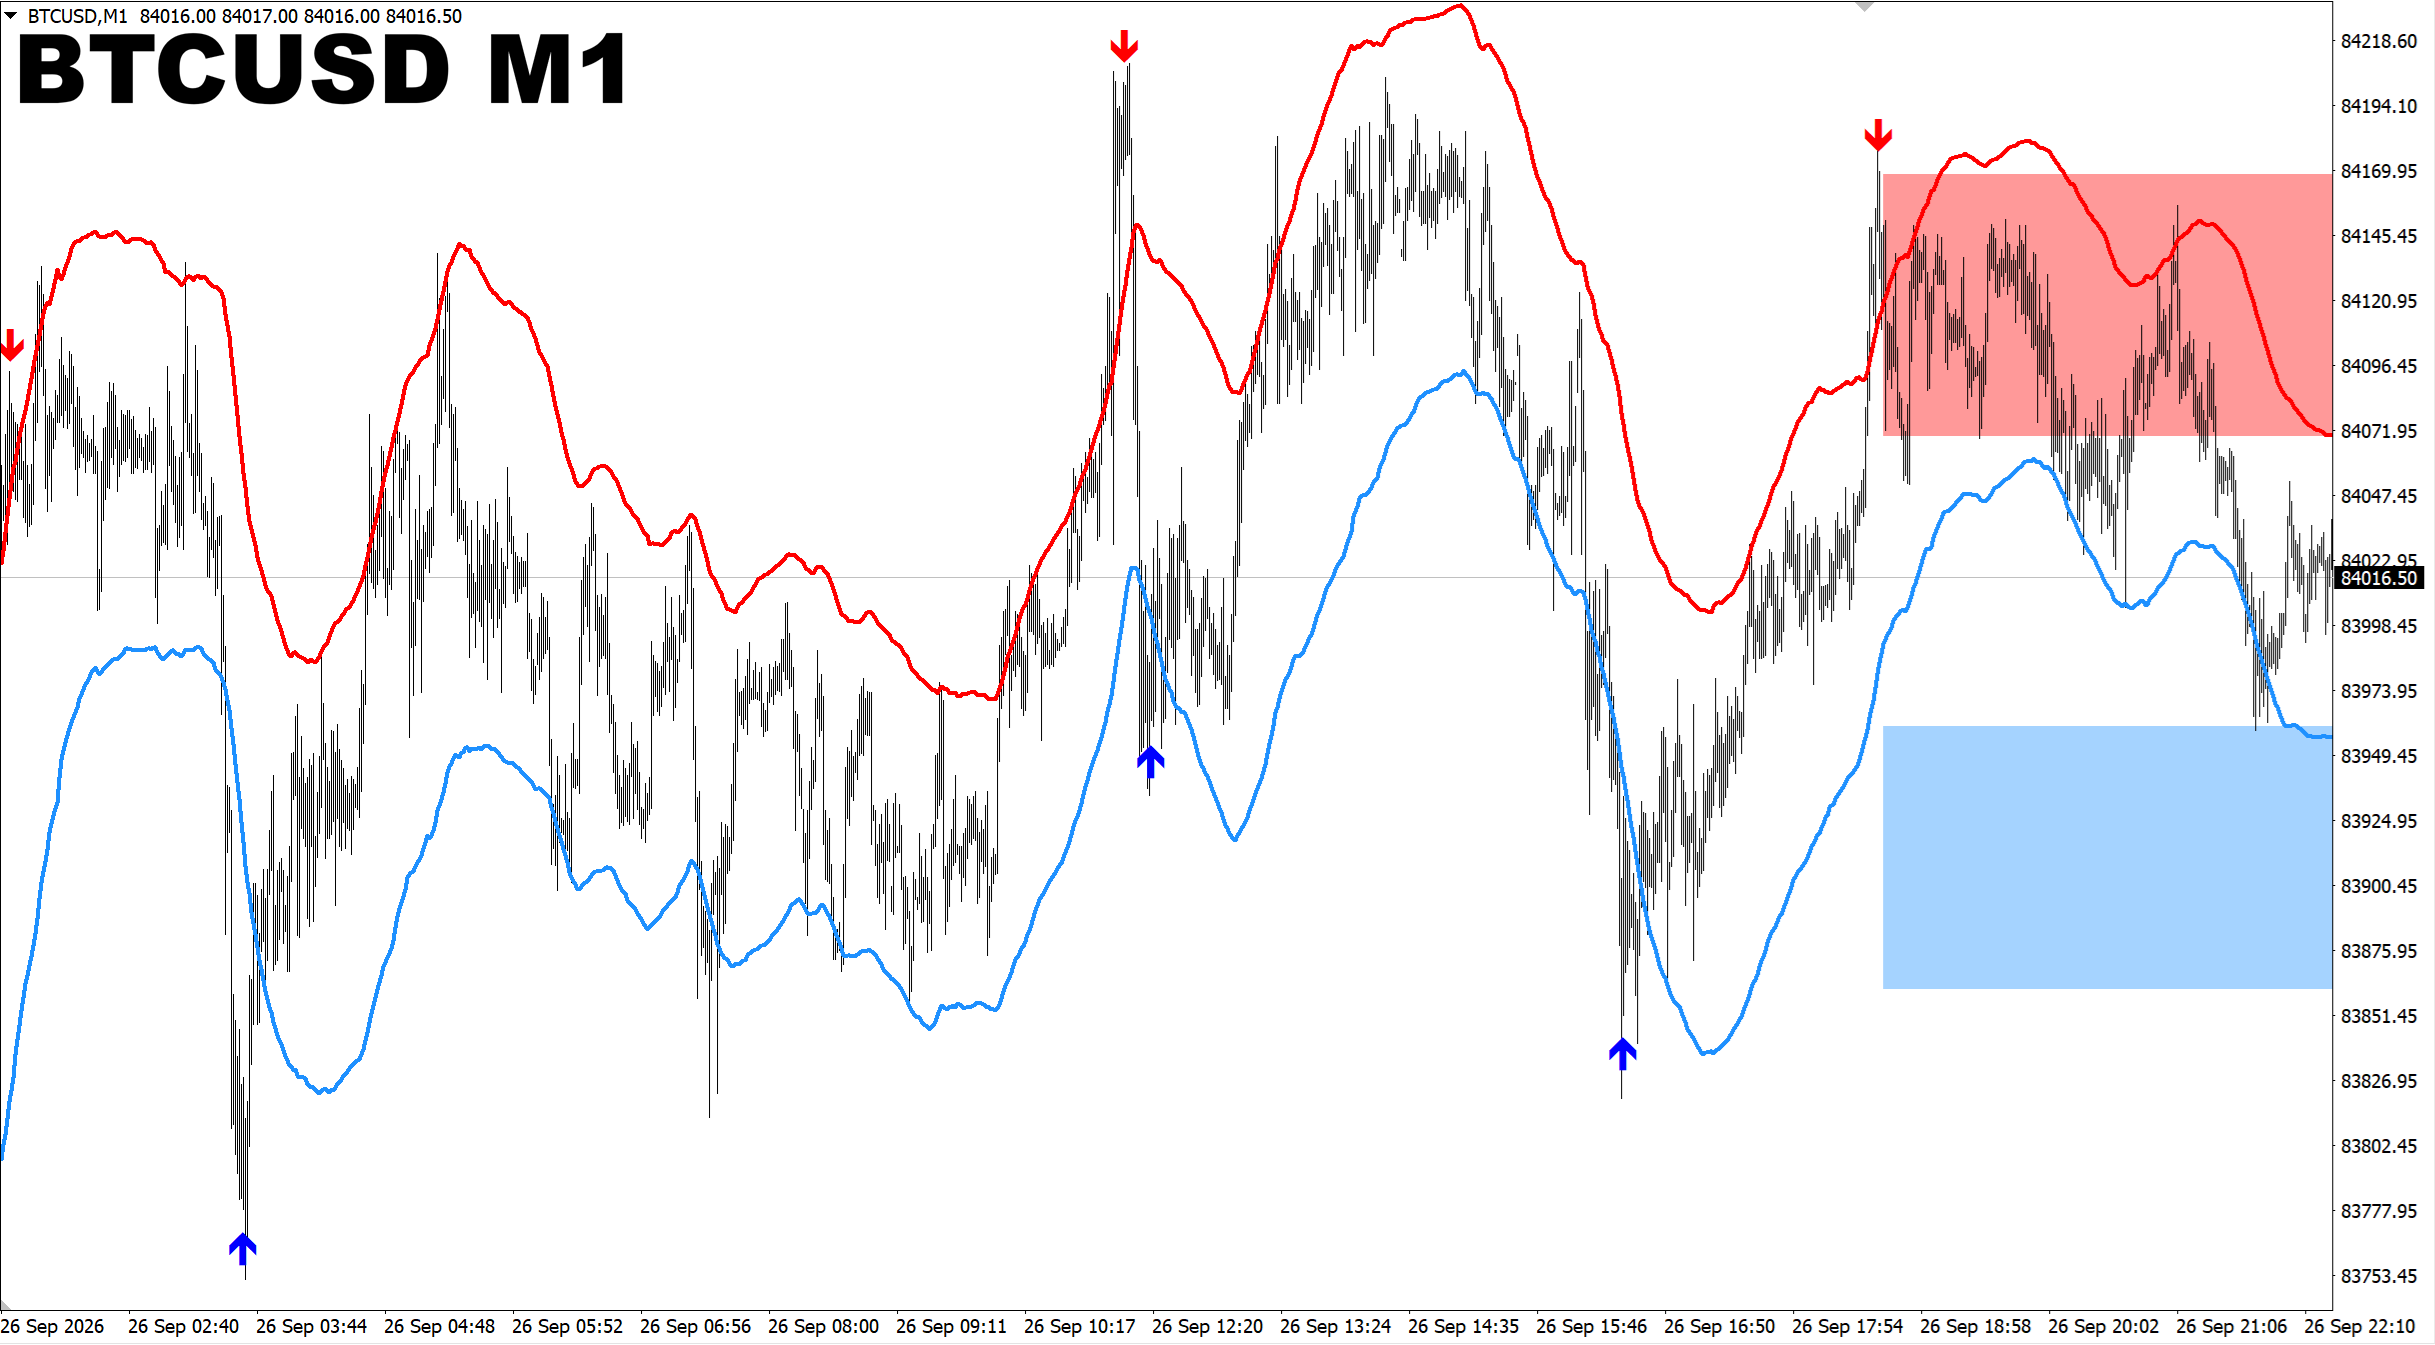
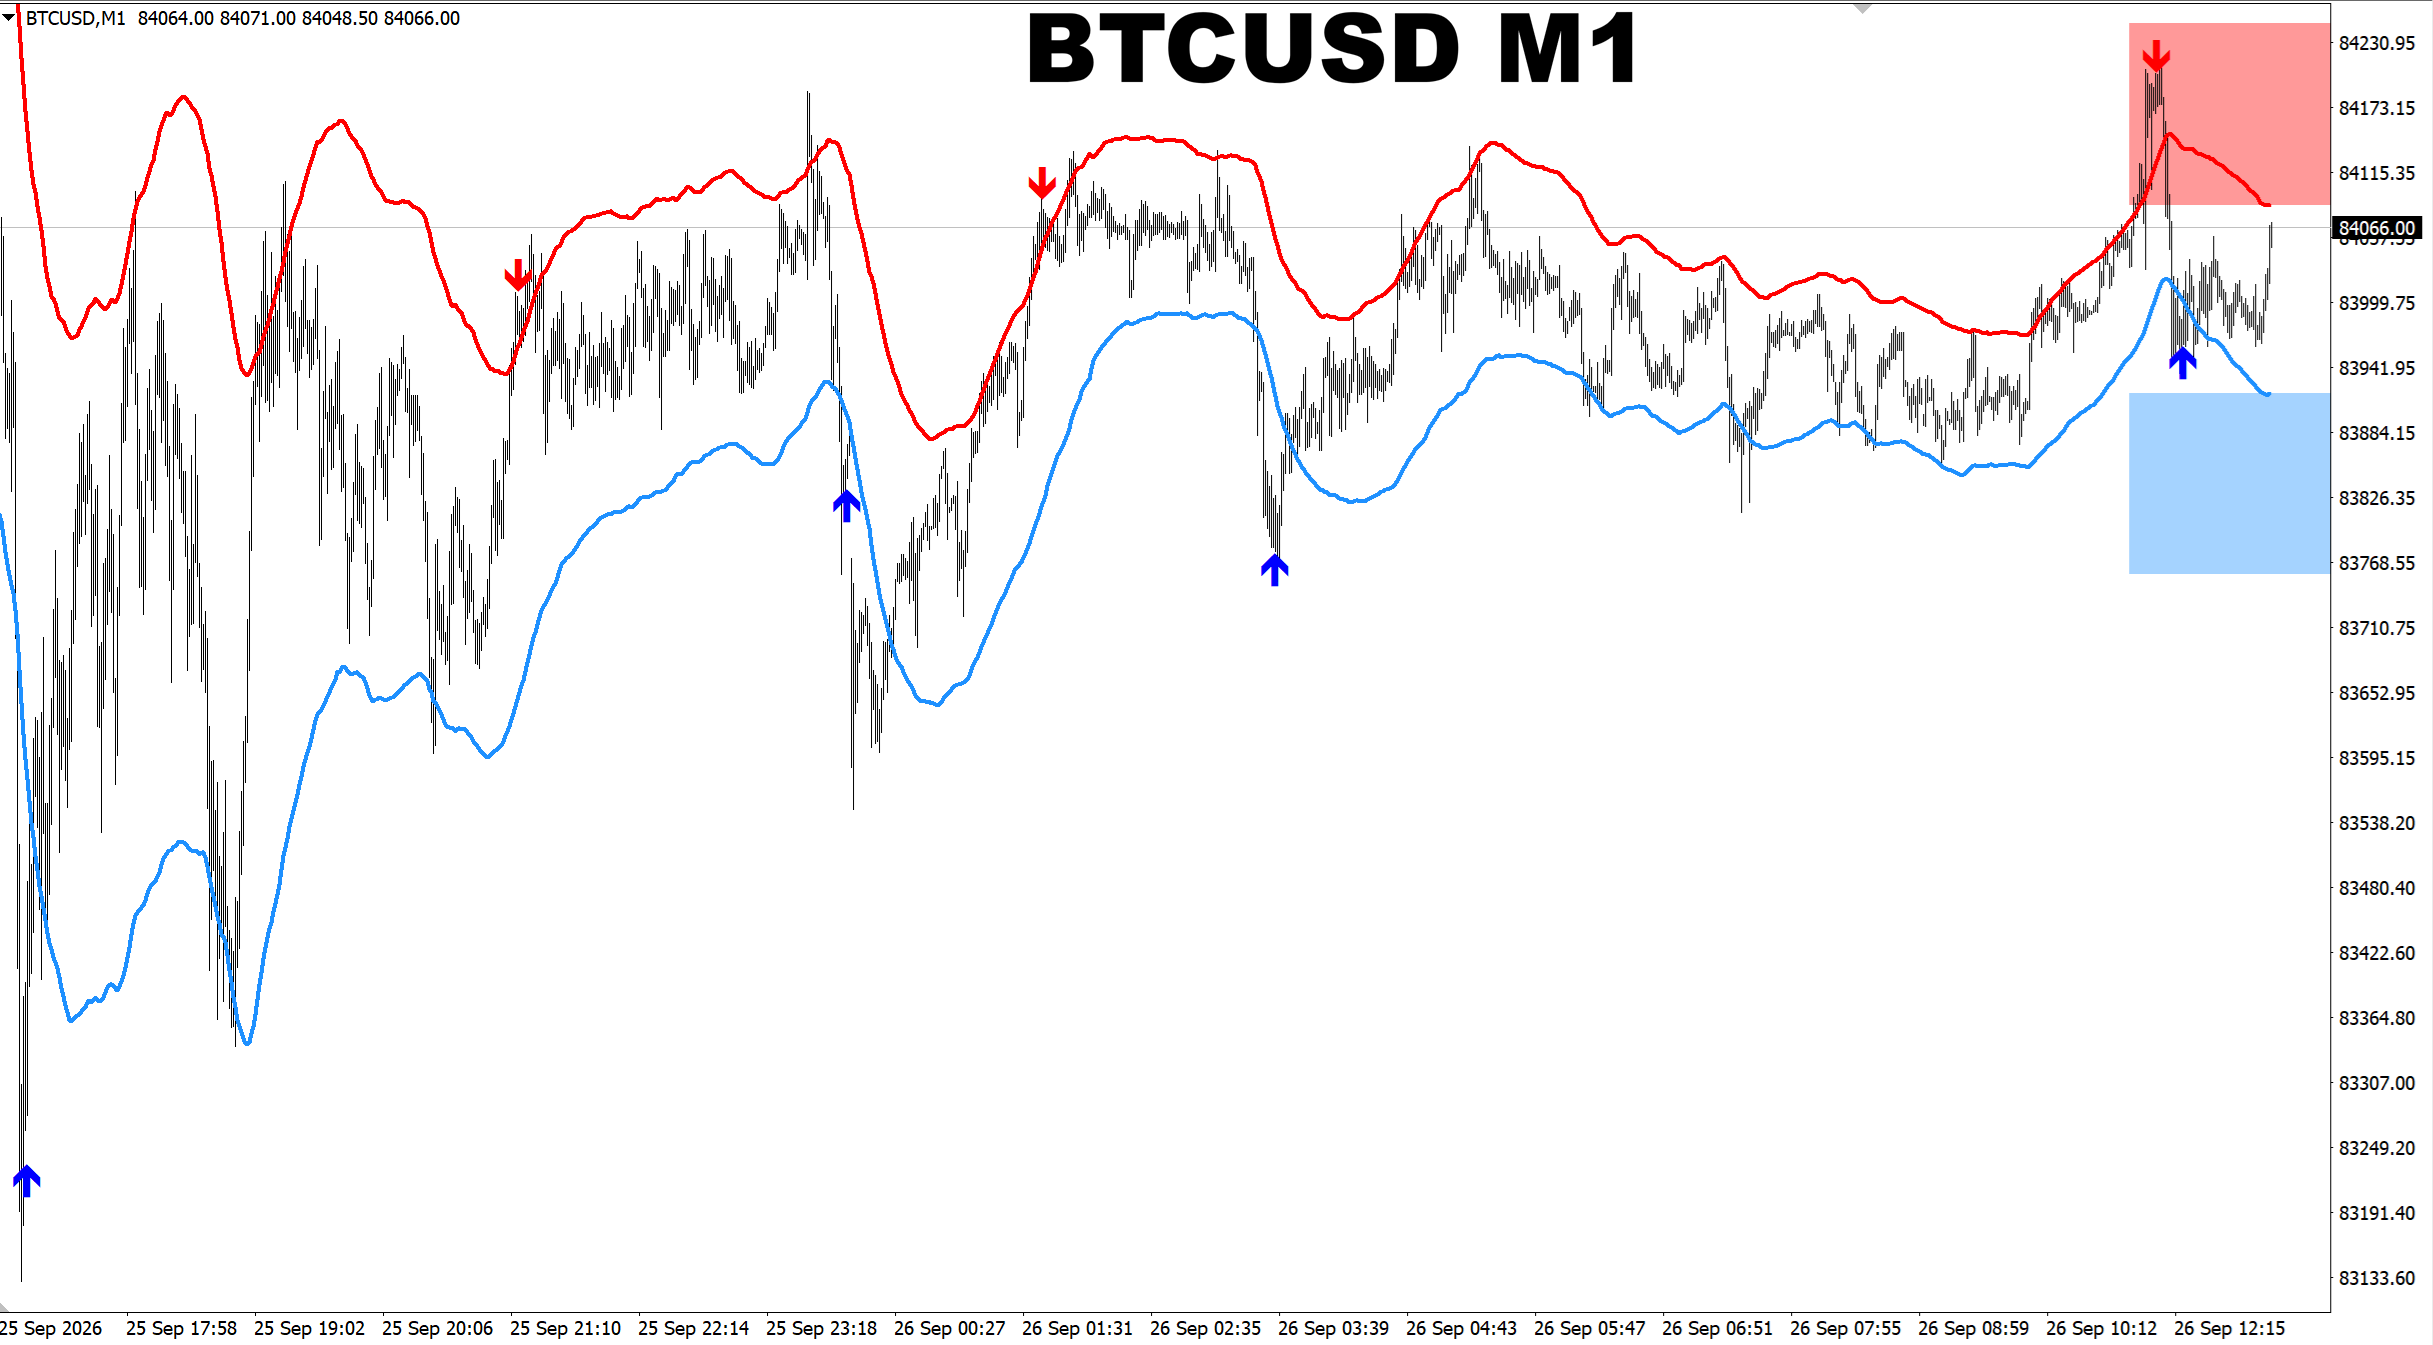
M1 Sniper. BTCUSD M1. Reversal signals mode. Update on recent signals performance. BTCUSD weekend trading is perfect for reversal mode due to lower volatility which we usually see on weekends.
Oleg Rodin
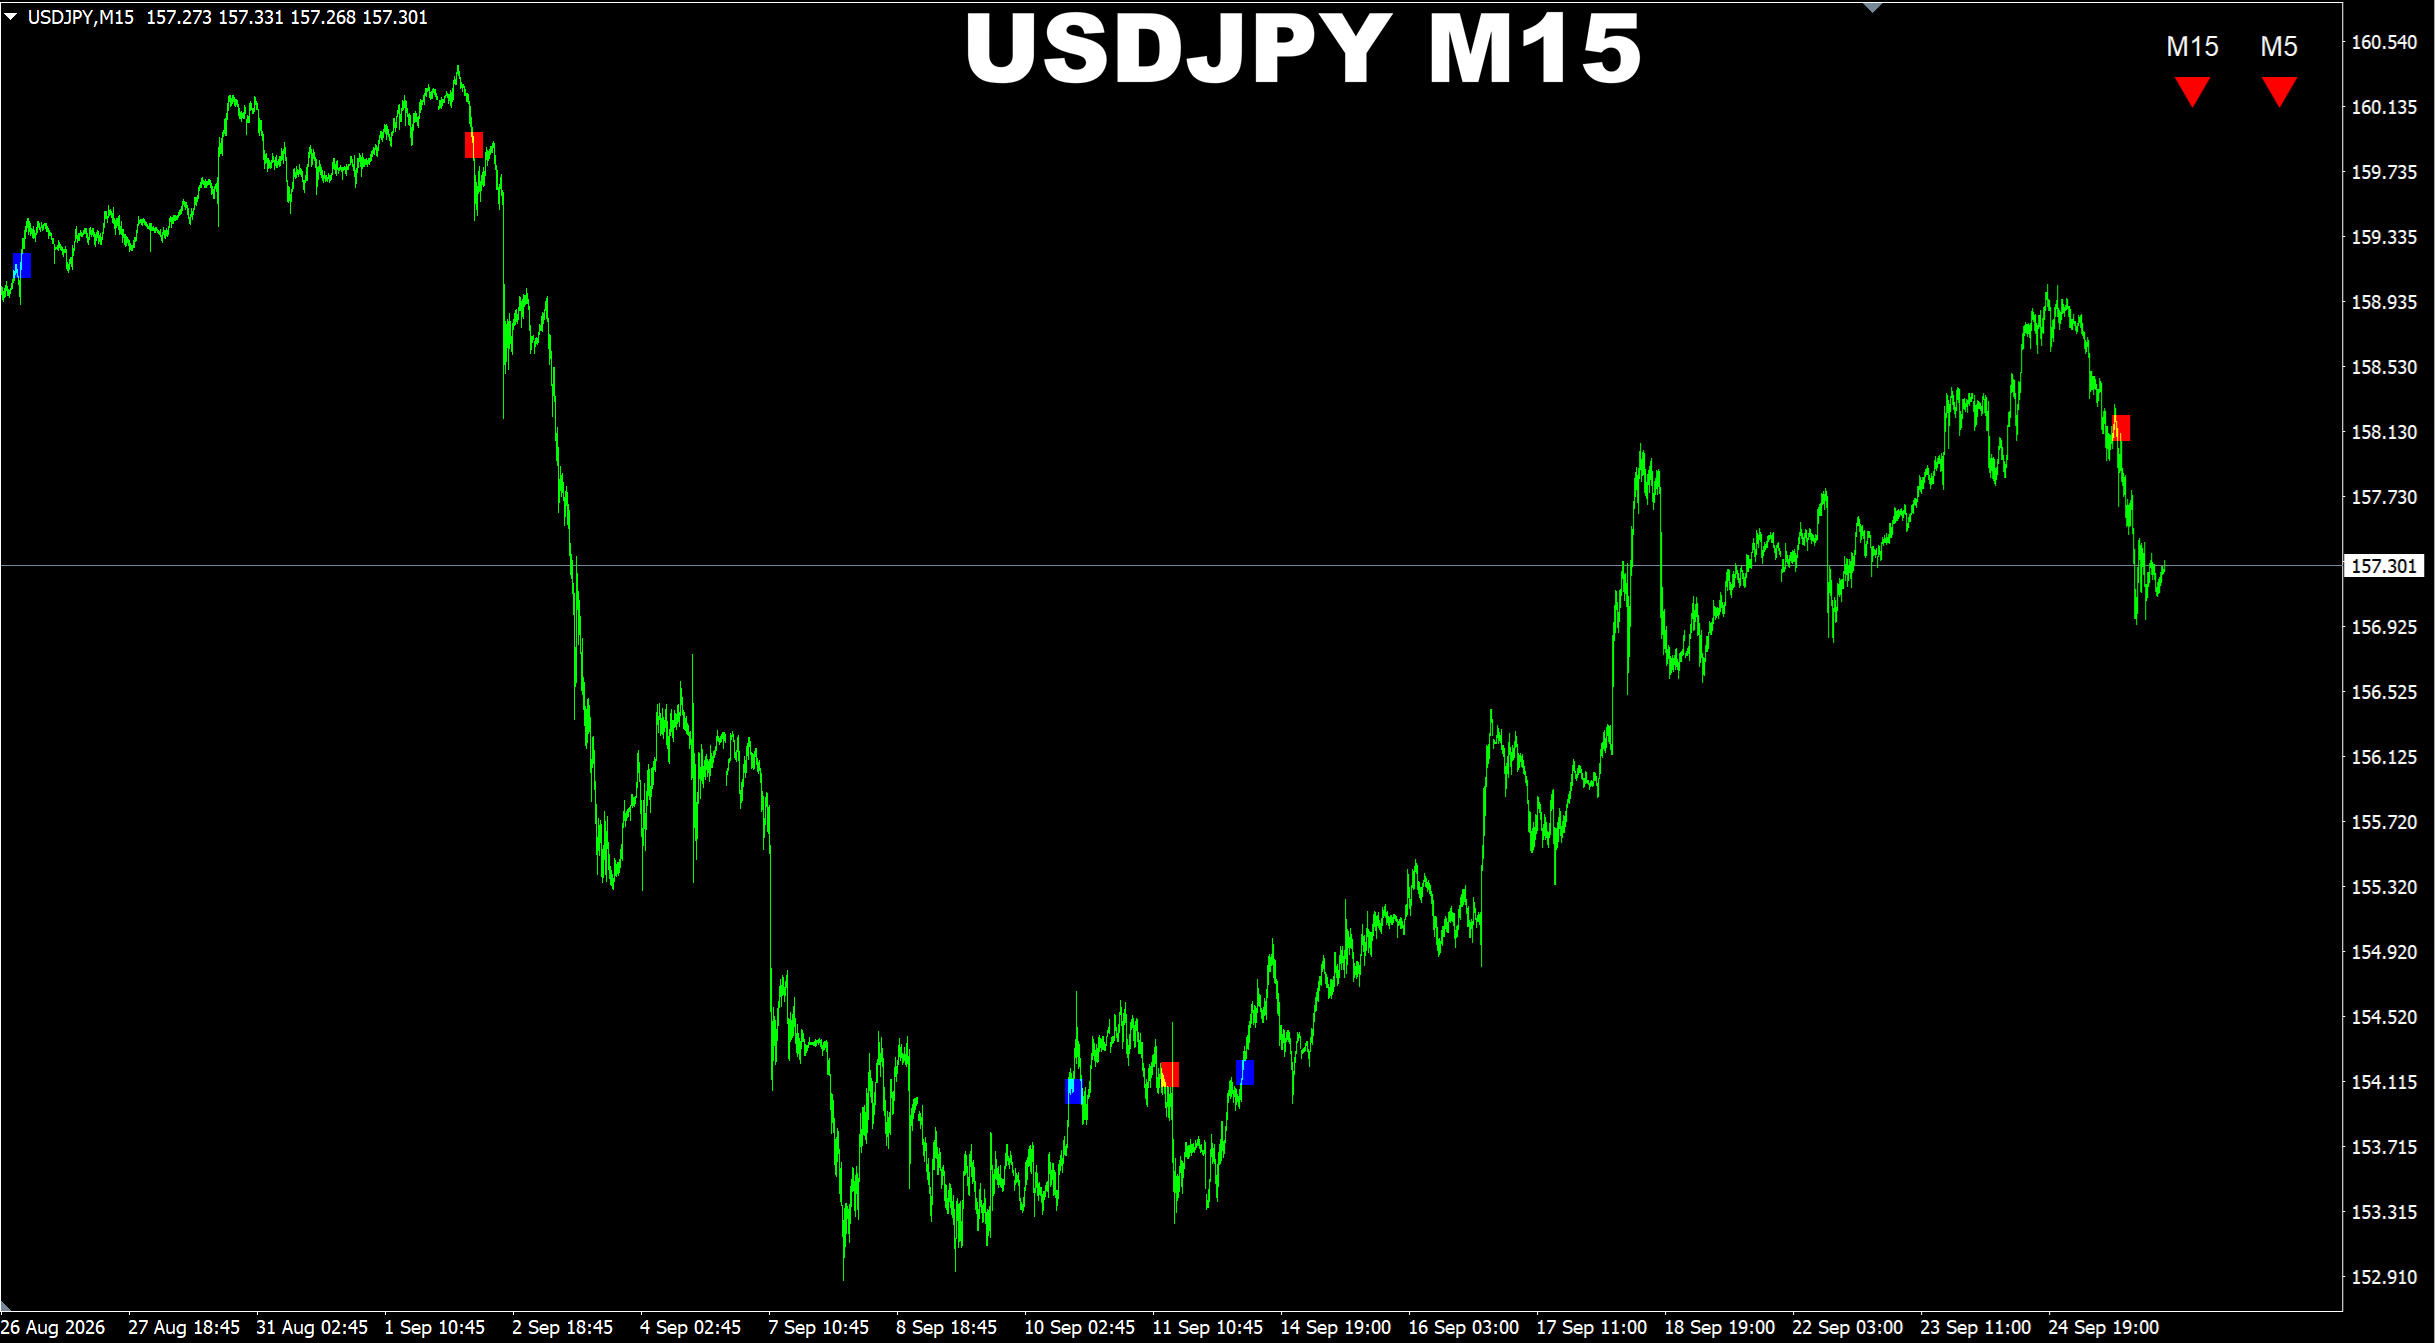
SR Liquidity. USDJPY M15. Update on my previous post. USDJPY can also be considered as the pair which can be used with default settings on M15 chart. So if you're looking for the pairs which can work right out of the box using default settings, feel free to check the USDJPY too.
Oleg Rodin
SR Liquidity. GBPUSD M15. A tip to those traders who use the SR Liquidity indicator in trading. Feel free to check GBPUSD M15. It works great with default settings. So you do not need to ajust the settings at all. Moreover GBP crosses will also work fine with M15 using default settings.
Oleg Rodin
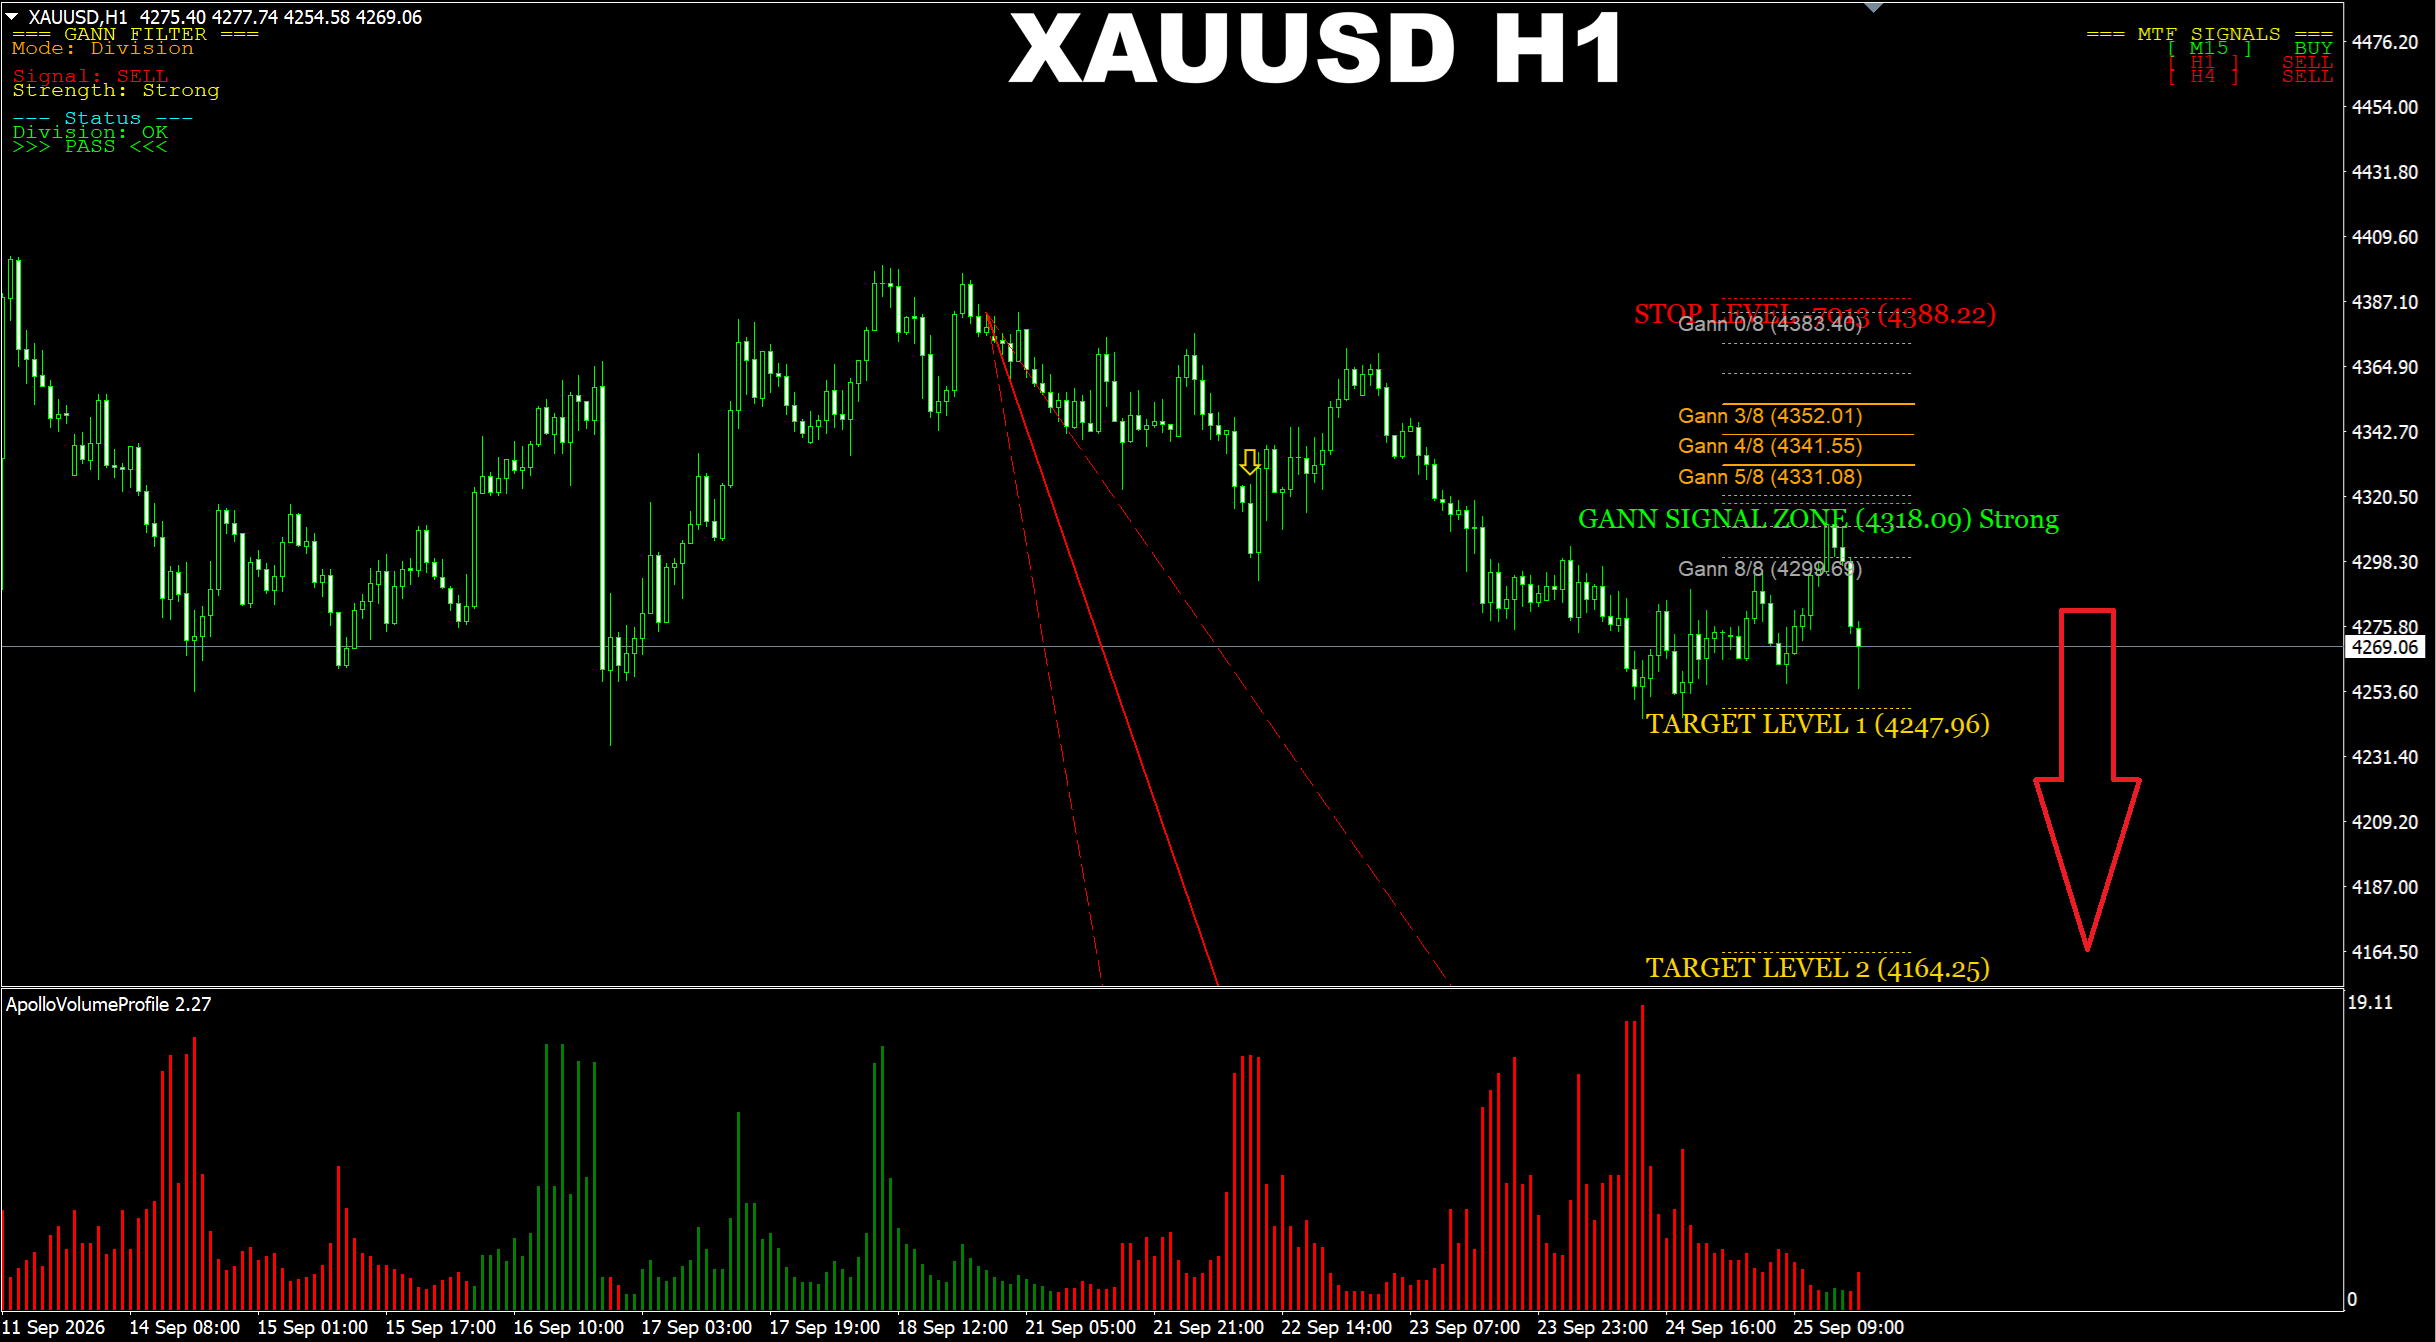
Gann Made Easy. XAUUSD H1. The SELL prediction is still active. The TP2 area is the area the price will go in case of the SELL breakout which is expected.
Oleg Rodin
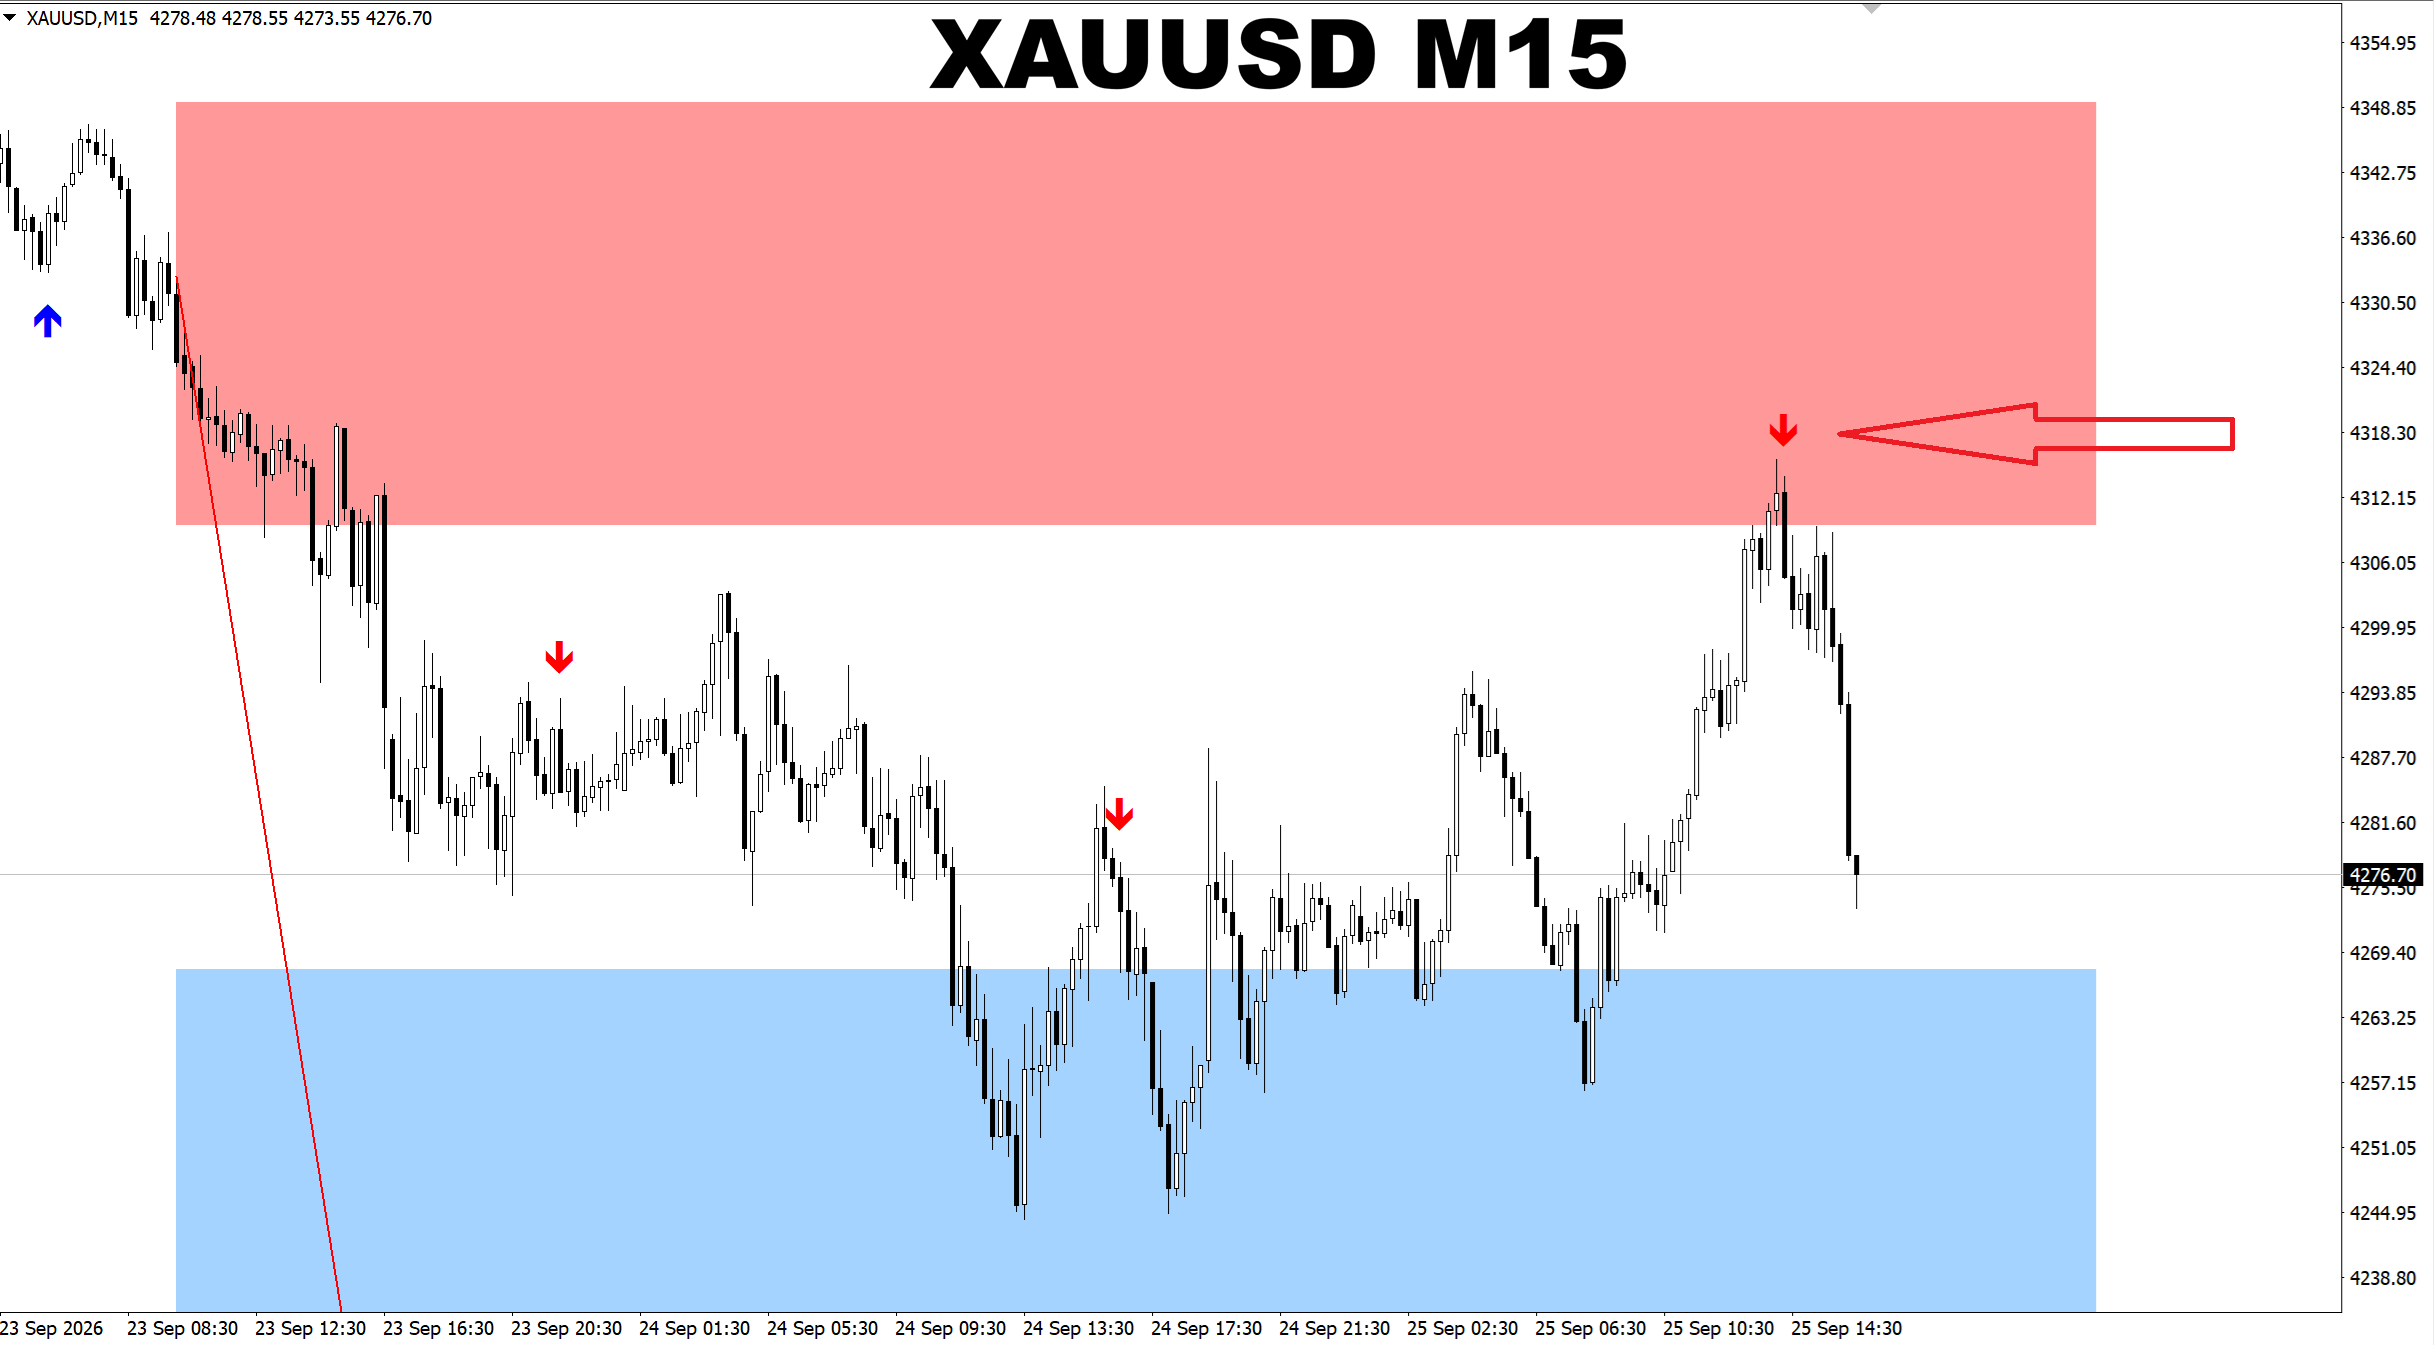
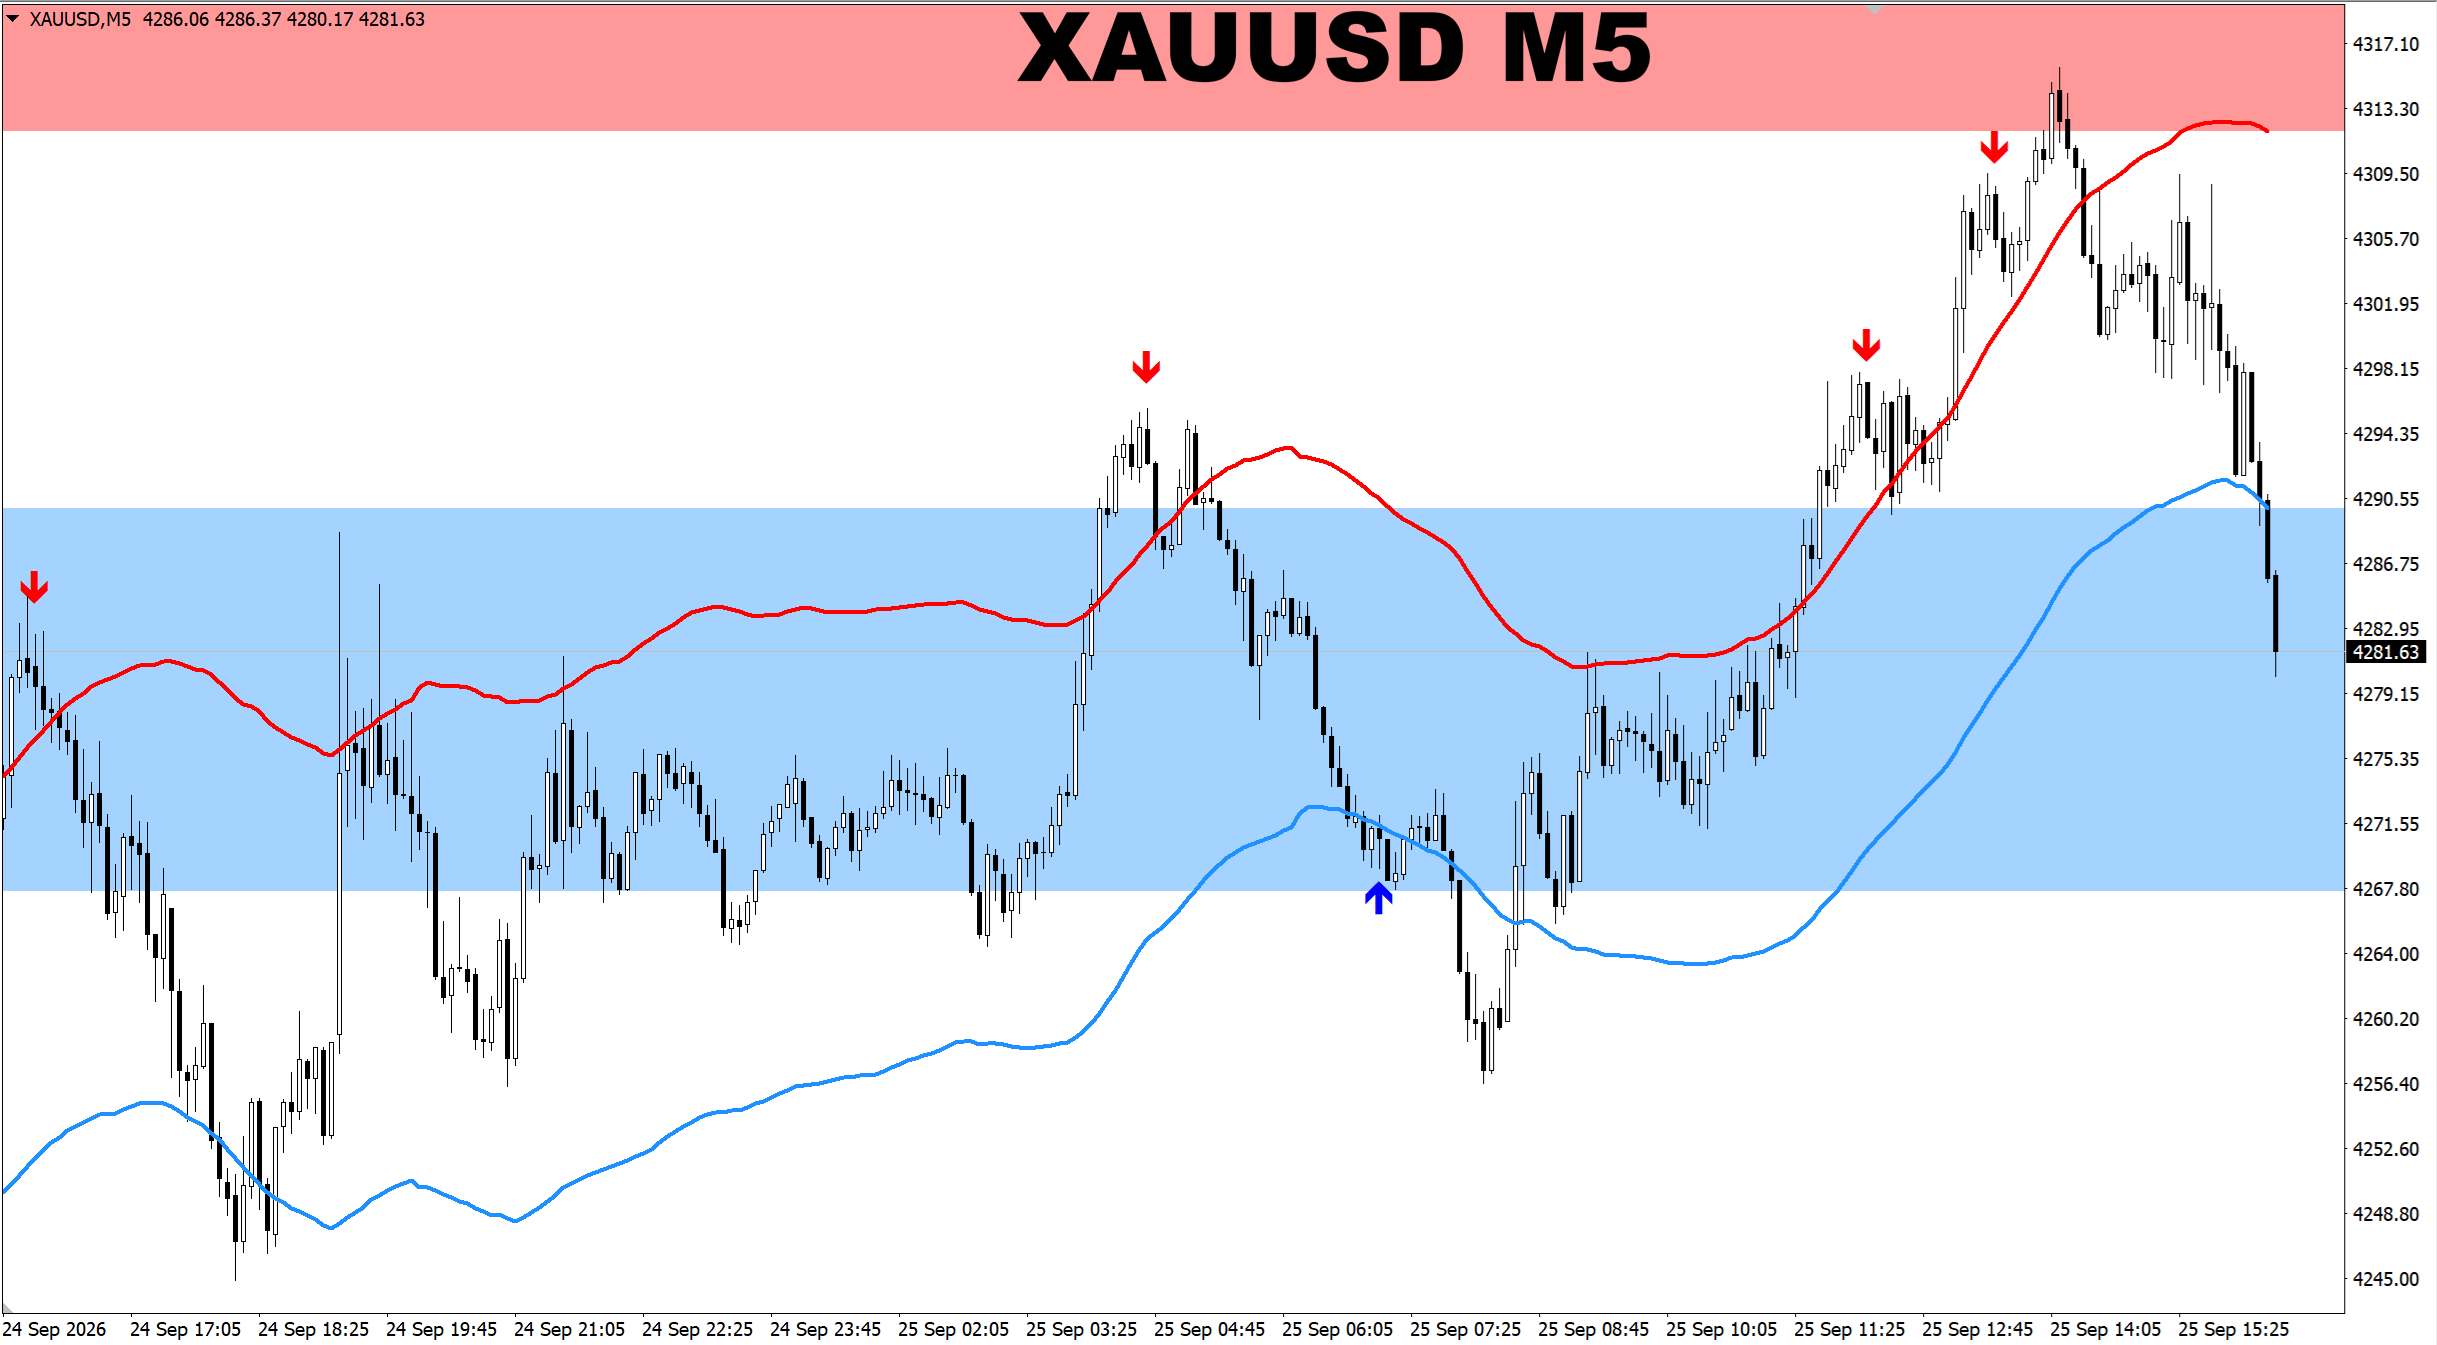
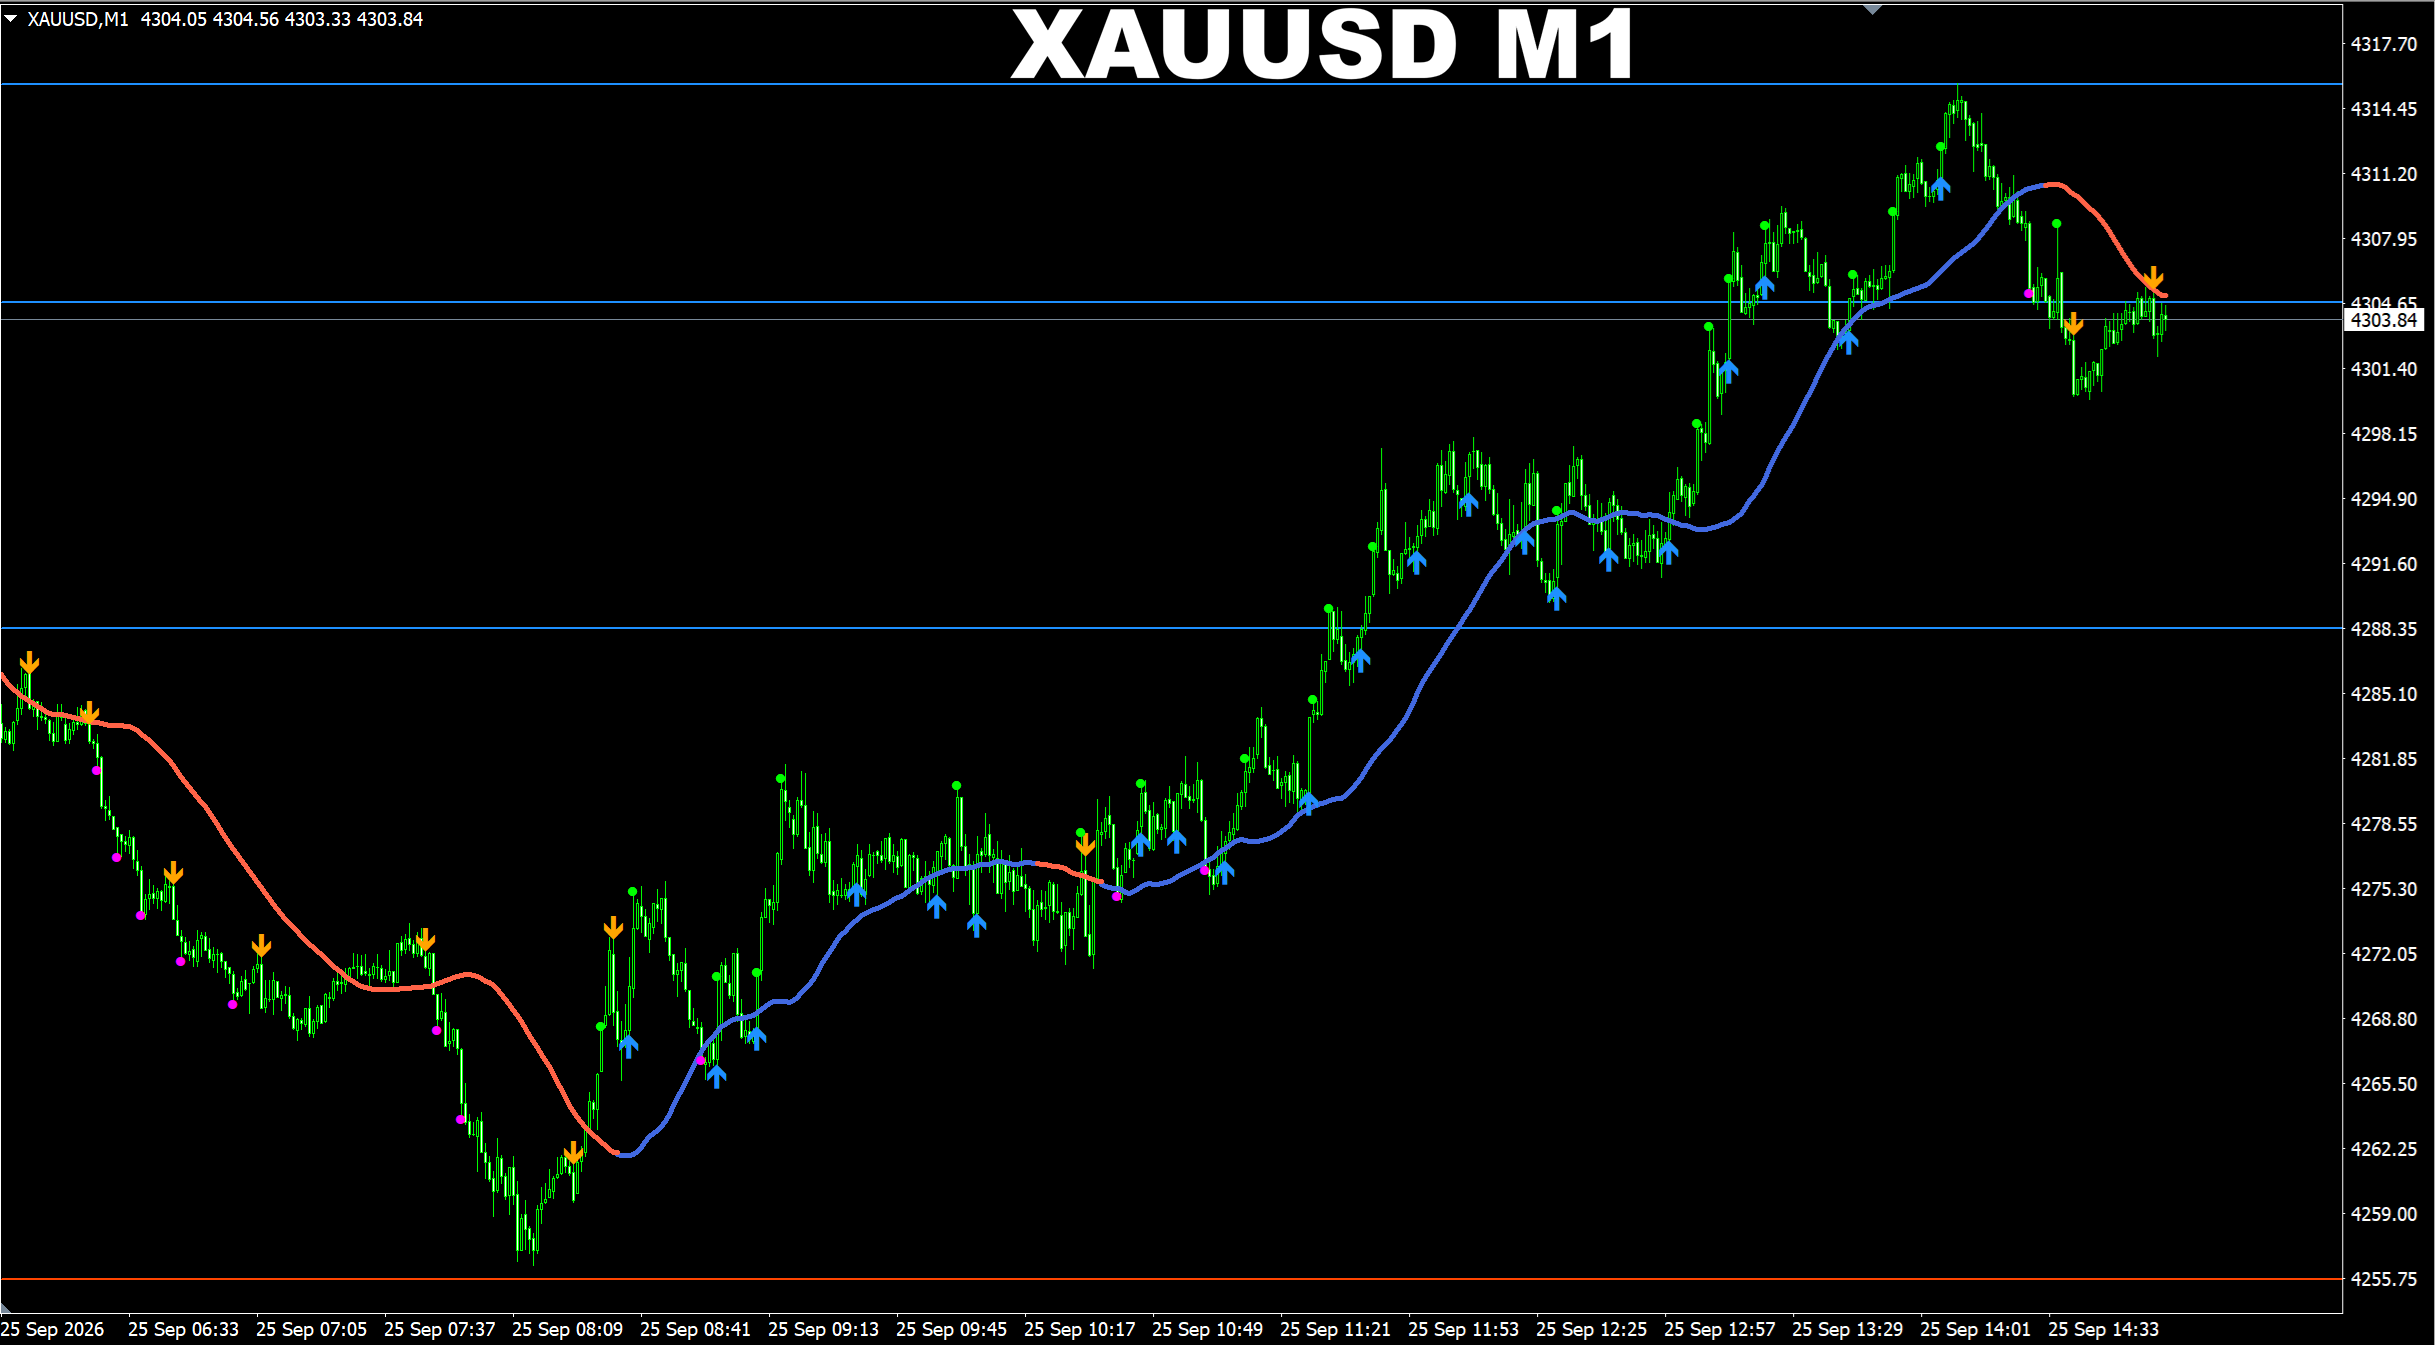
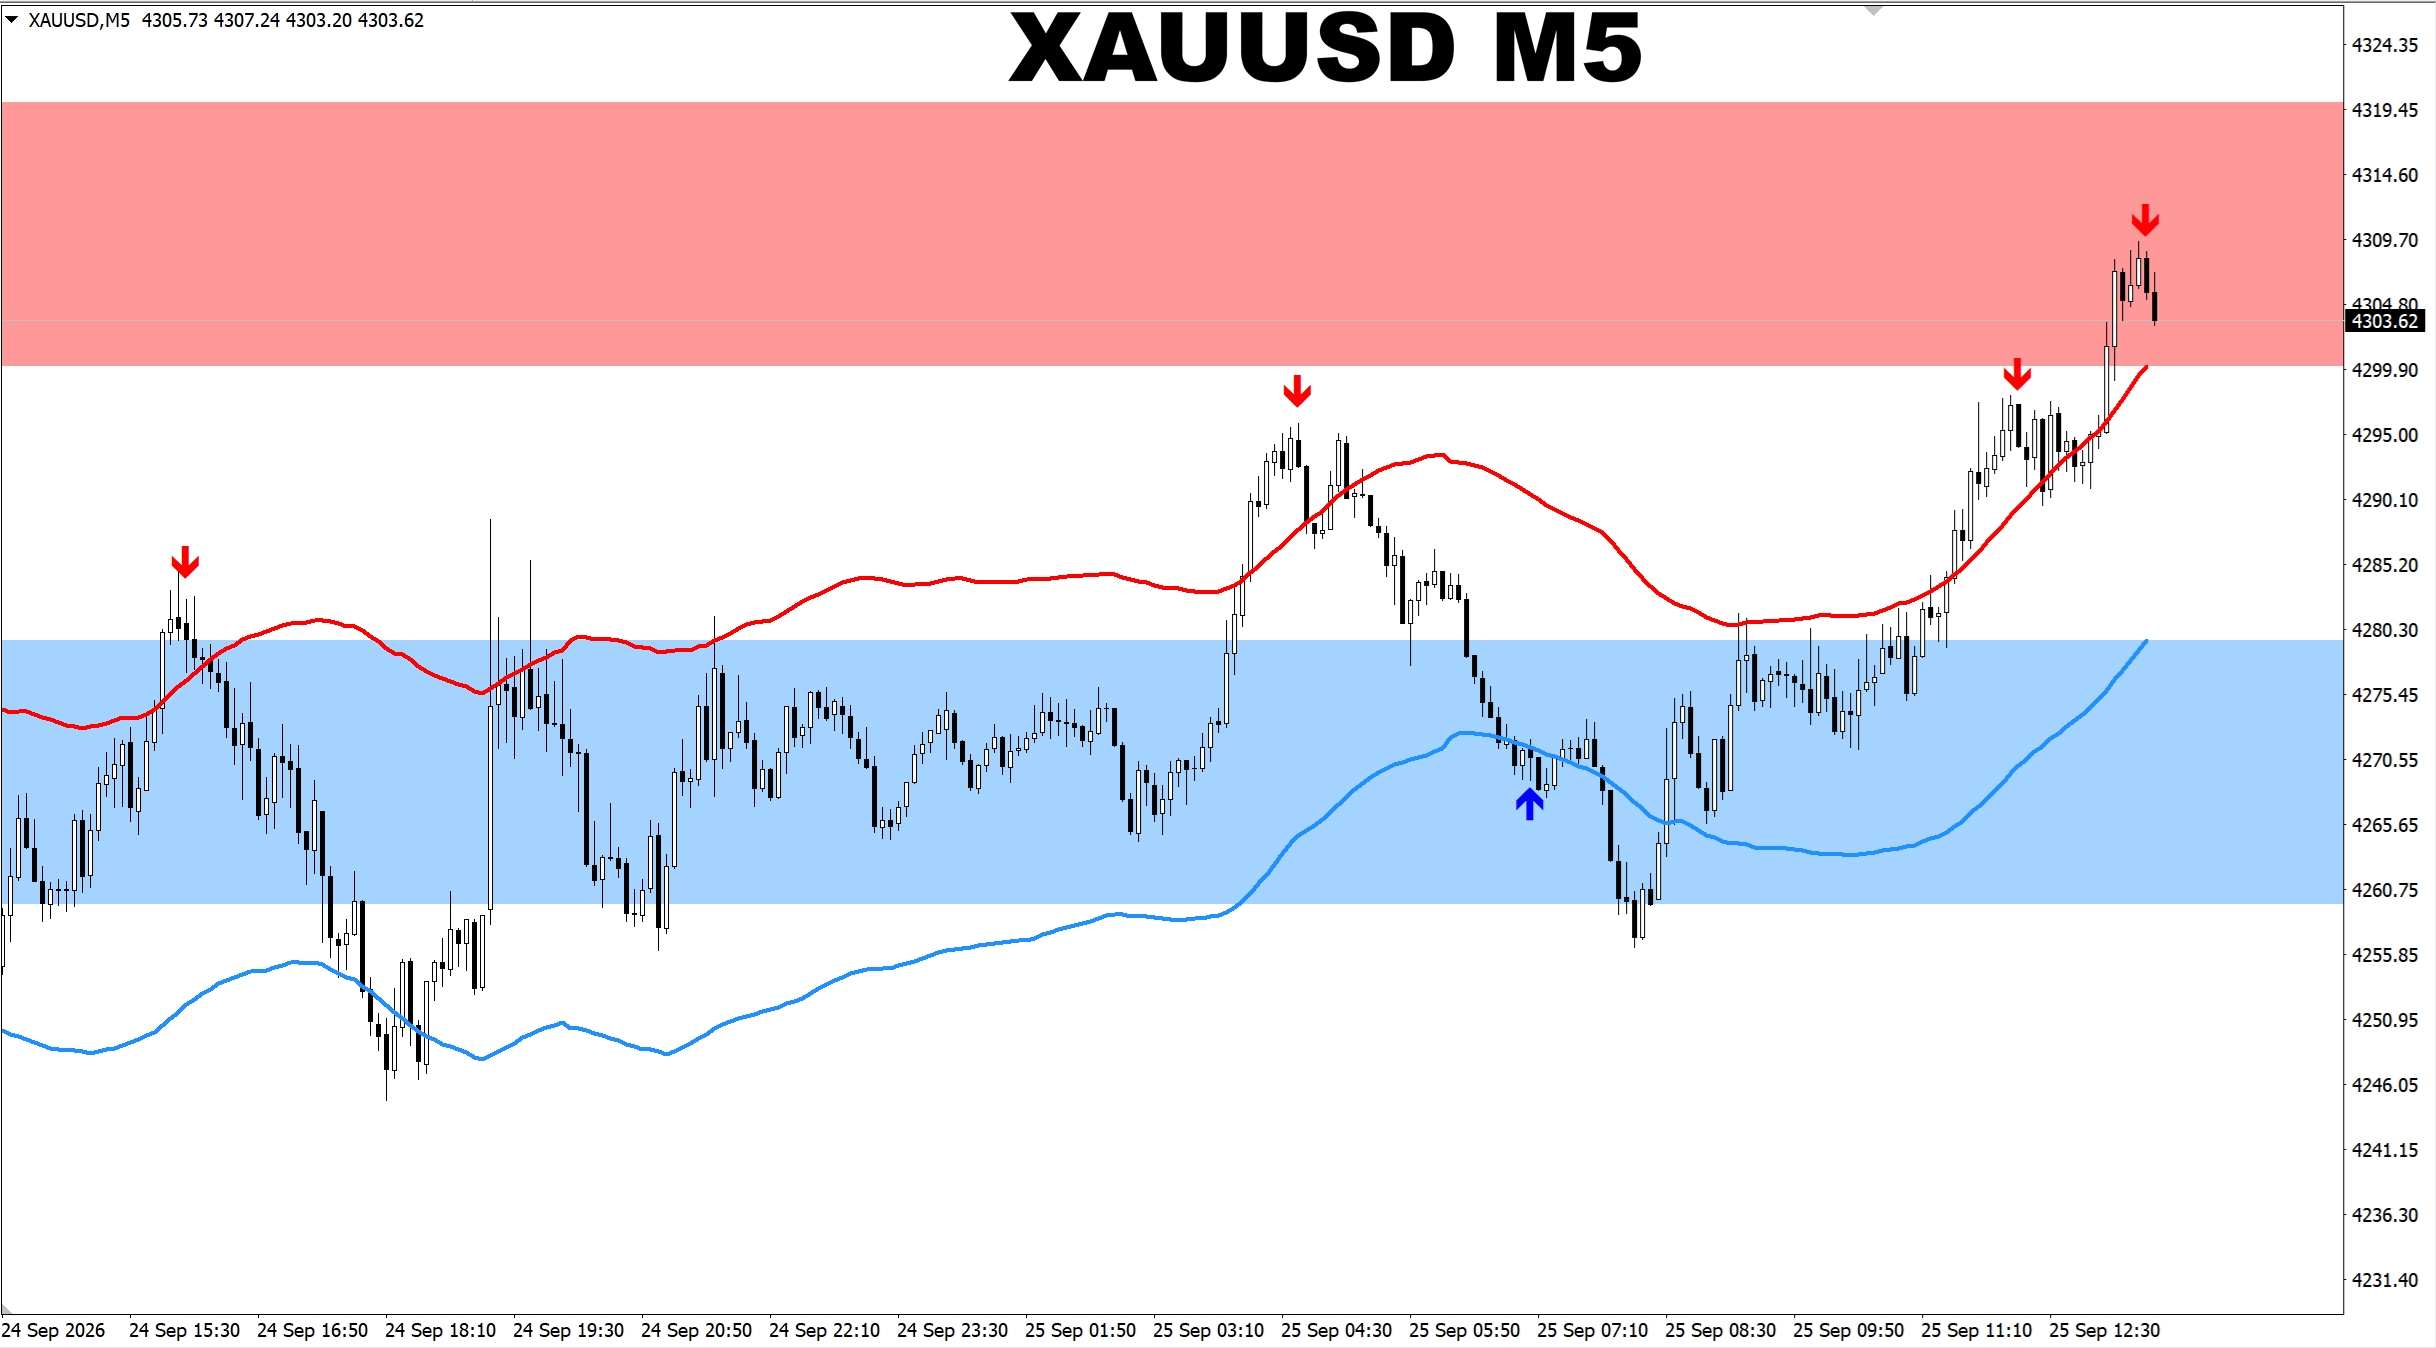
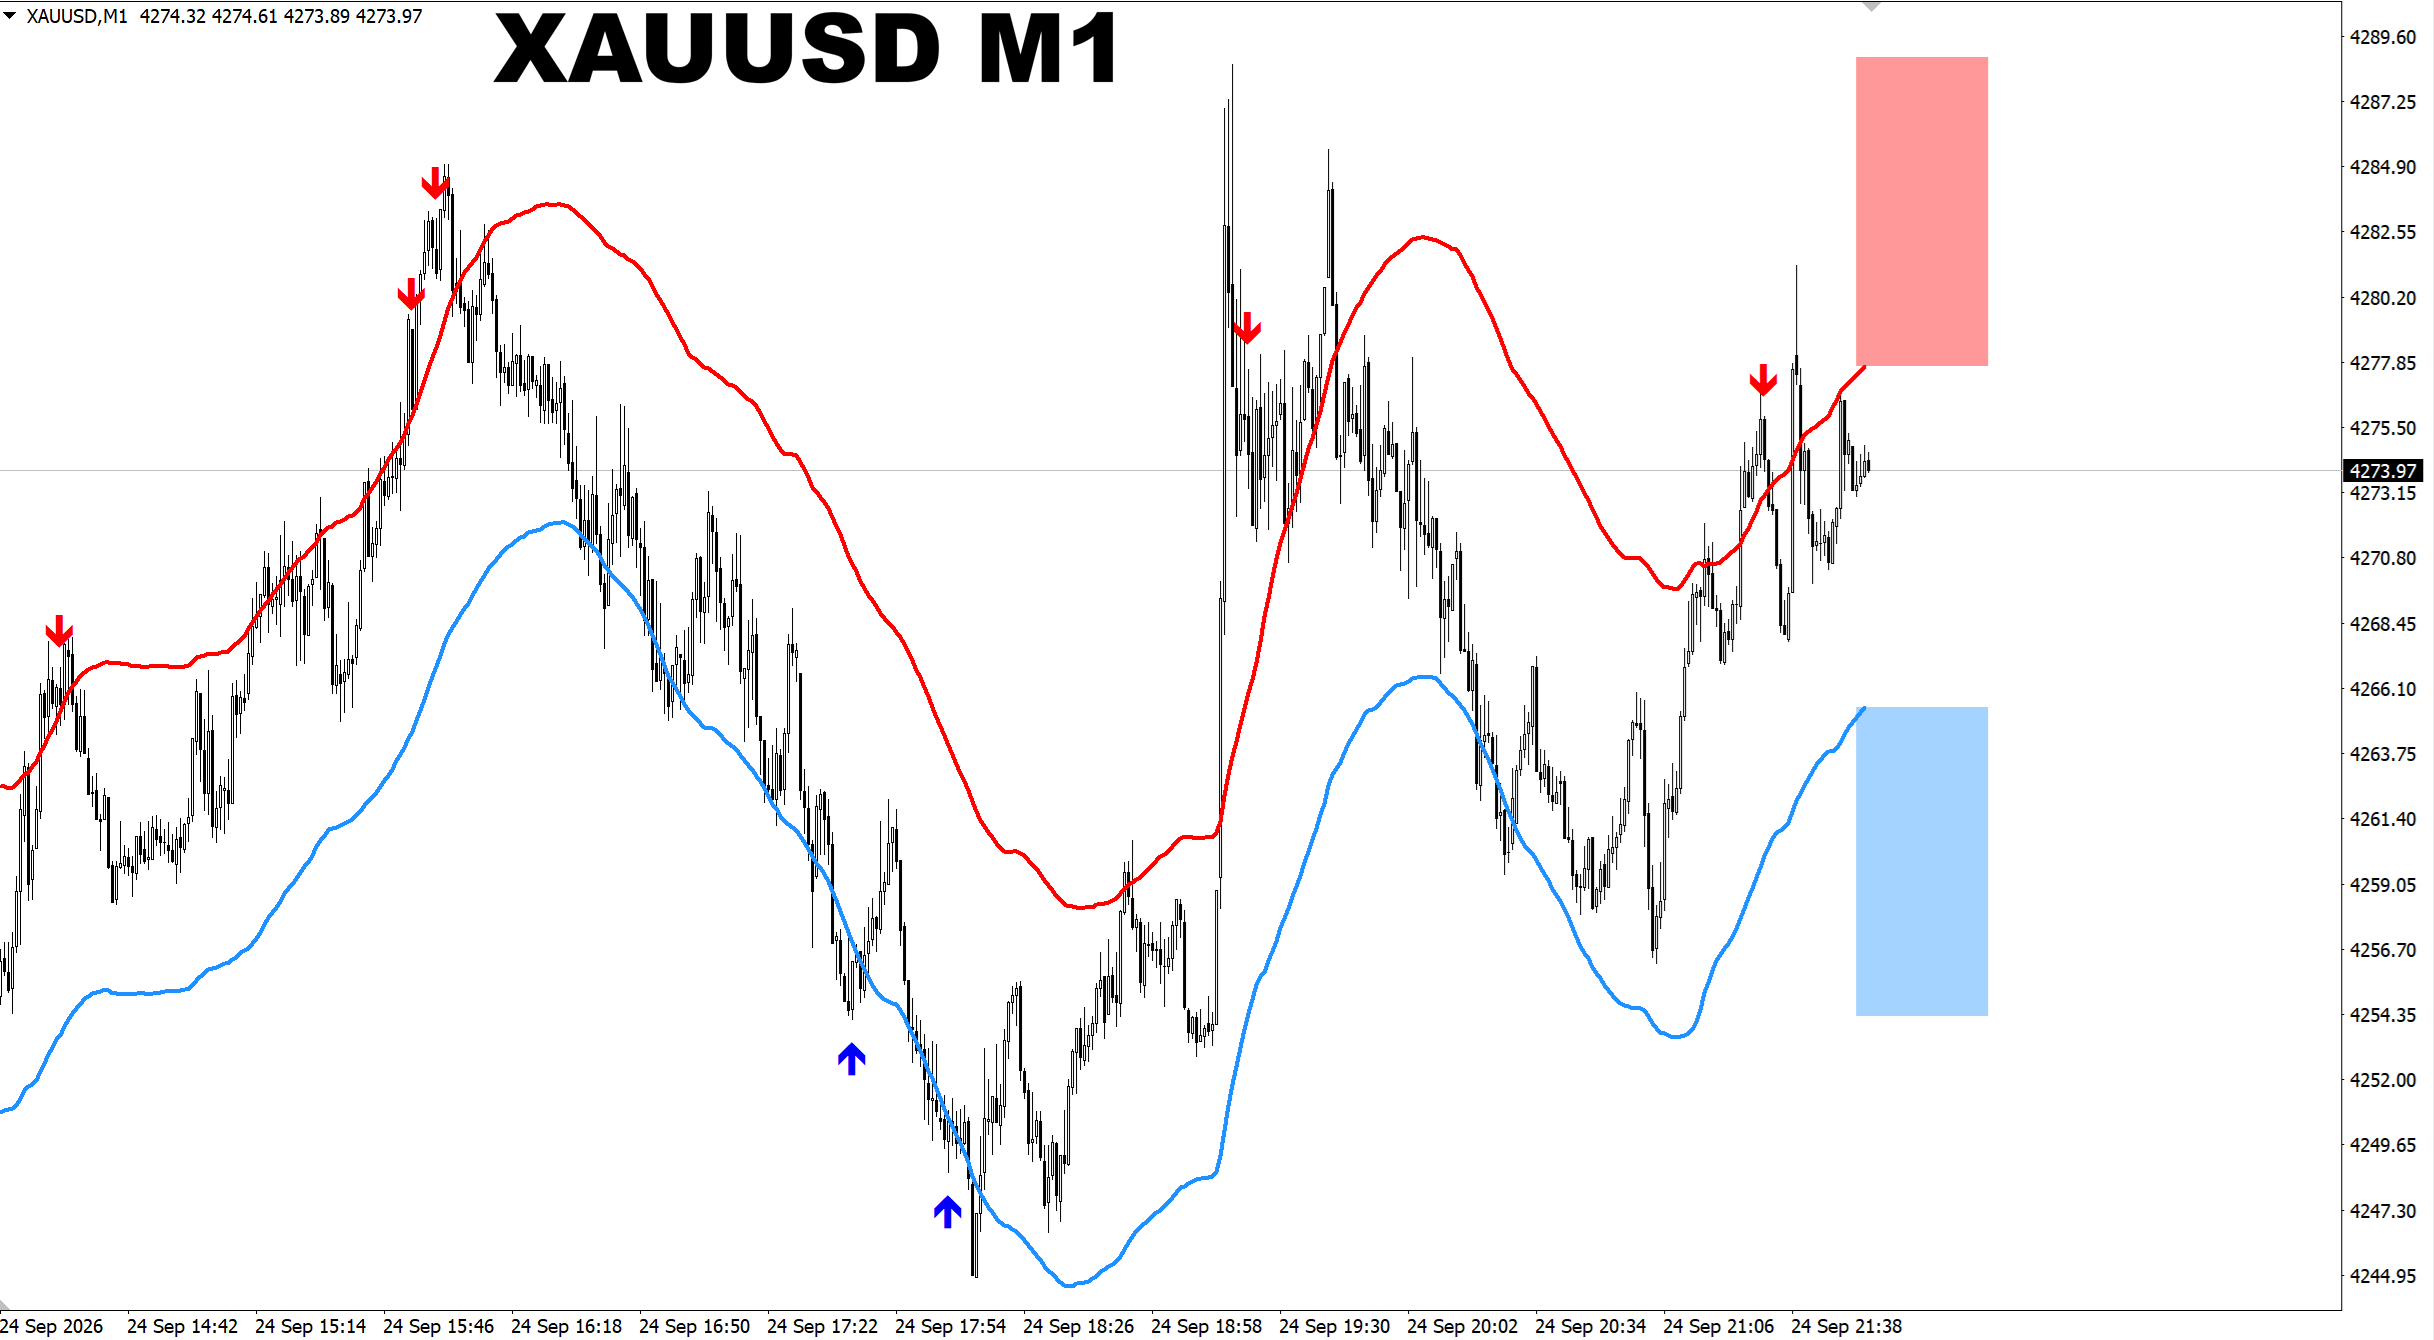
M1 Sniper. XAUUSD M15. Default settings. Here I want to give some extra tips to those who trade with this indicator. I actually mention this in the trading tips but sometimes people ask this same question again. The question is if it is possible to know when the direction on the lower time frames changes, for example, on M1? Let's say you're buying on M1. So how you can understand if you need to stop buying and wait for possible price reversal? This is simple actually. All you need is monitor the next two higher time frames. For example you trade M1. All you need is check where the price is on M5 and M15 regarding the volatility zone. Especially if you have any signals there against your direction on M1. So in this screensot you can see the price went to the red zone and plus a new SELL signal was generated. It means the chance is high the price will go down. Moreover sometimes I even check the situation on M30 too to get the best picture of what is going on. But checking at least the M5 and M15 is something you should not avoid. So if you see the situation like this, when the signal appeared or even if the price reached the zone which is against the direction you follow on your lower TF, M1, for example, well, in this case you need to close your positions on M1 and prepare for change in direction. Instead of waiting for the direction to change on M1 too, often it is possible to place a trade based on the higher time which you used as a filter. The exit in this case will the point when the price reaches the opposite zone on the next lower TF, which is M5 is my example. So what I wanted to say is please check the situation on the next higher time frames, it just takes a a minute to do but helps a lot in trading. If you just follow the signals on M1 without any filtering, sometimes you may be caught by such reversals simply because you do not see the bigger picture of the market. This is actually the main reason why I added such volatility zones to this indicator. Hope these extra tips help you in trading!
: