Oleg Rodin
Oleg Rodin
4.8 (527)
  • Information
12+ years
experience
53
products
541
demo versions
0
jobs
0
signals
0
subscribers
Hello!

I've been a trader and trading software developer for more than 15 years already. Here I do my best to share my experience with other traders providing them with high-quality trading tools which can be used for trading different markets.

My goal is to help traders get success in trading no matter what level of experience they currently have.

I truly believe with my support and trading tools every trader can become better in forex trading.

I wish you great success and good luck in trading!
Oleg Rodin
Oleg Rodin
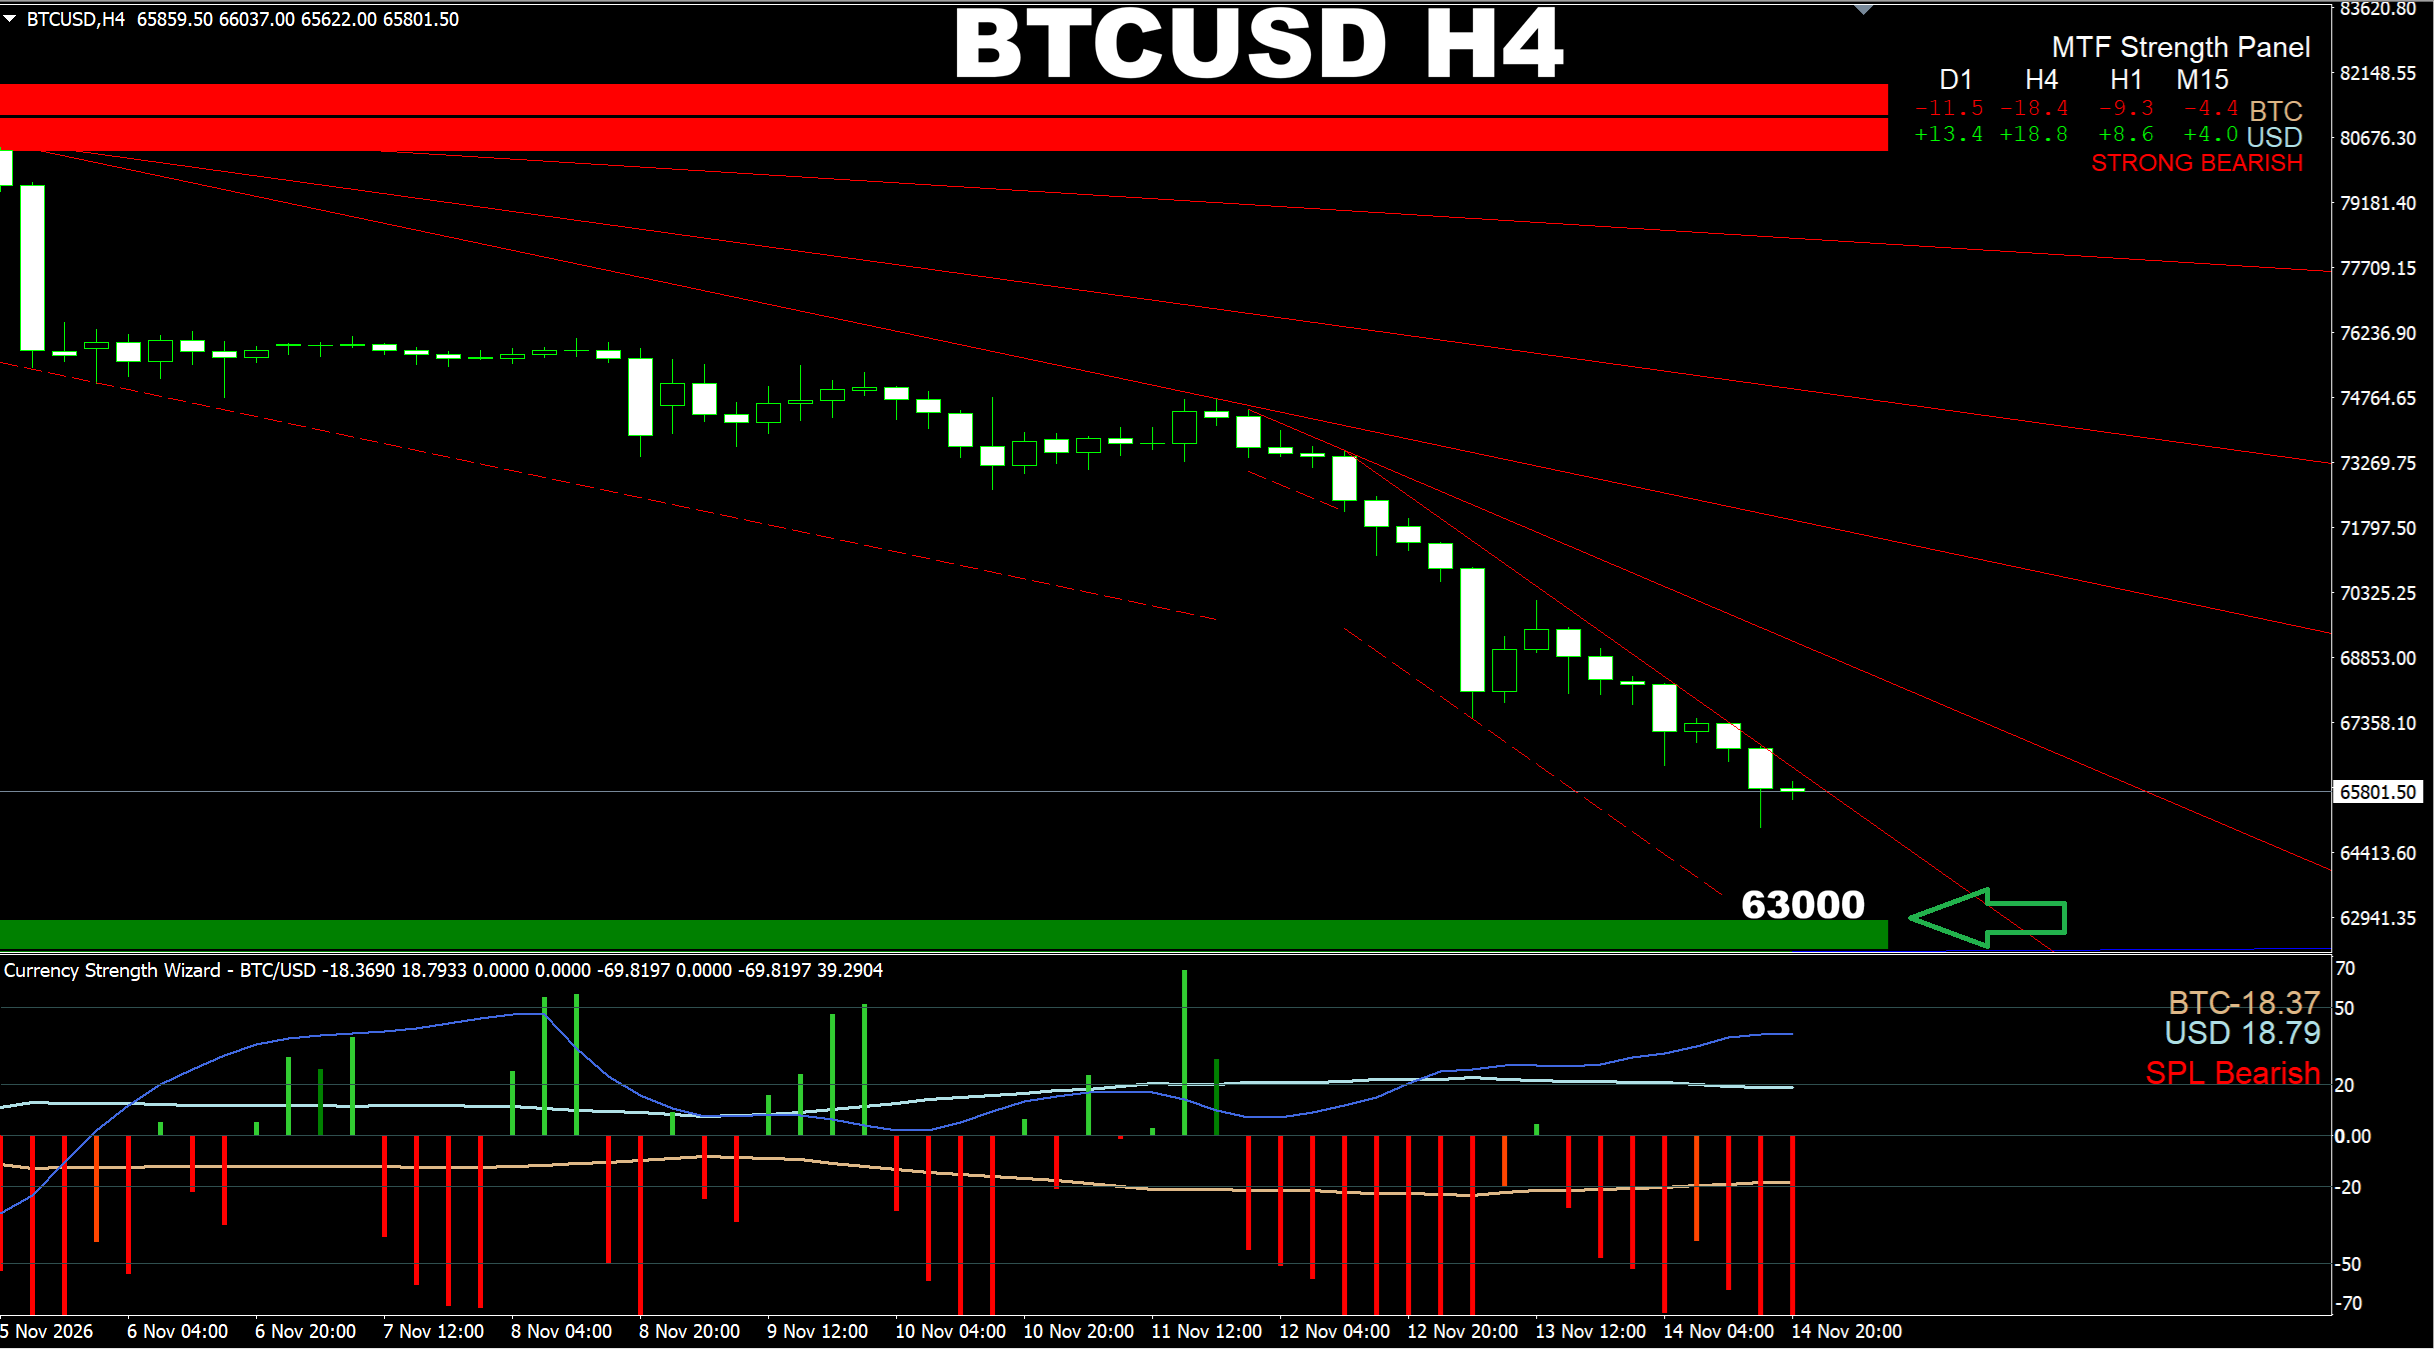
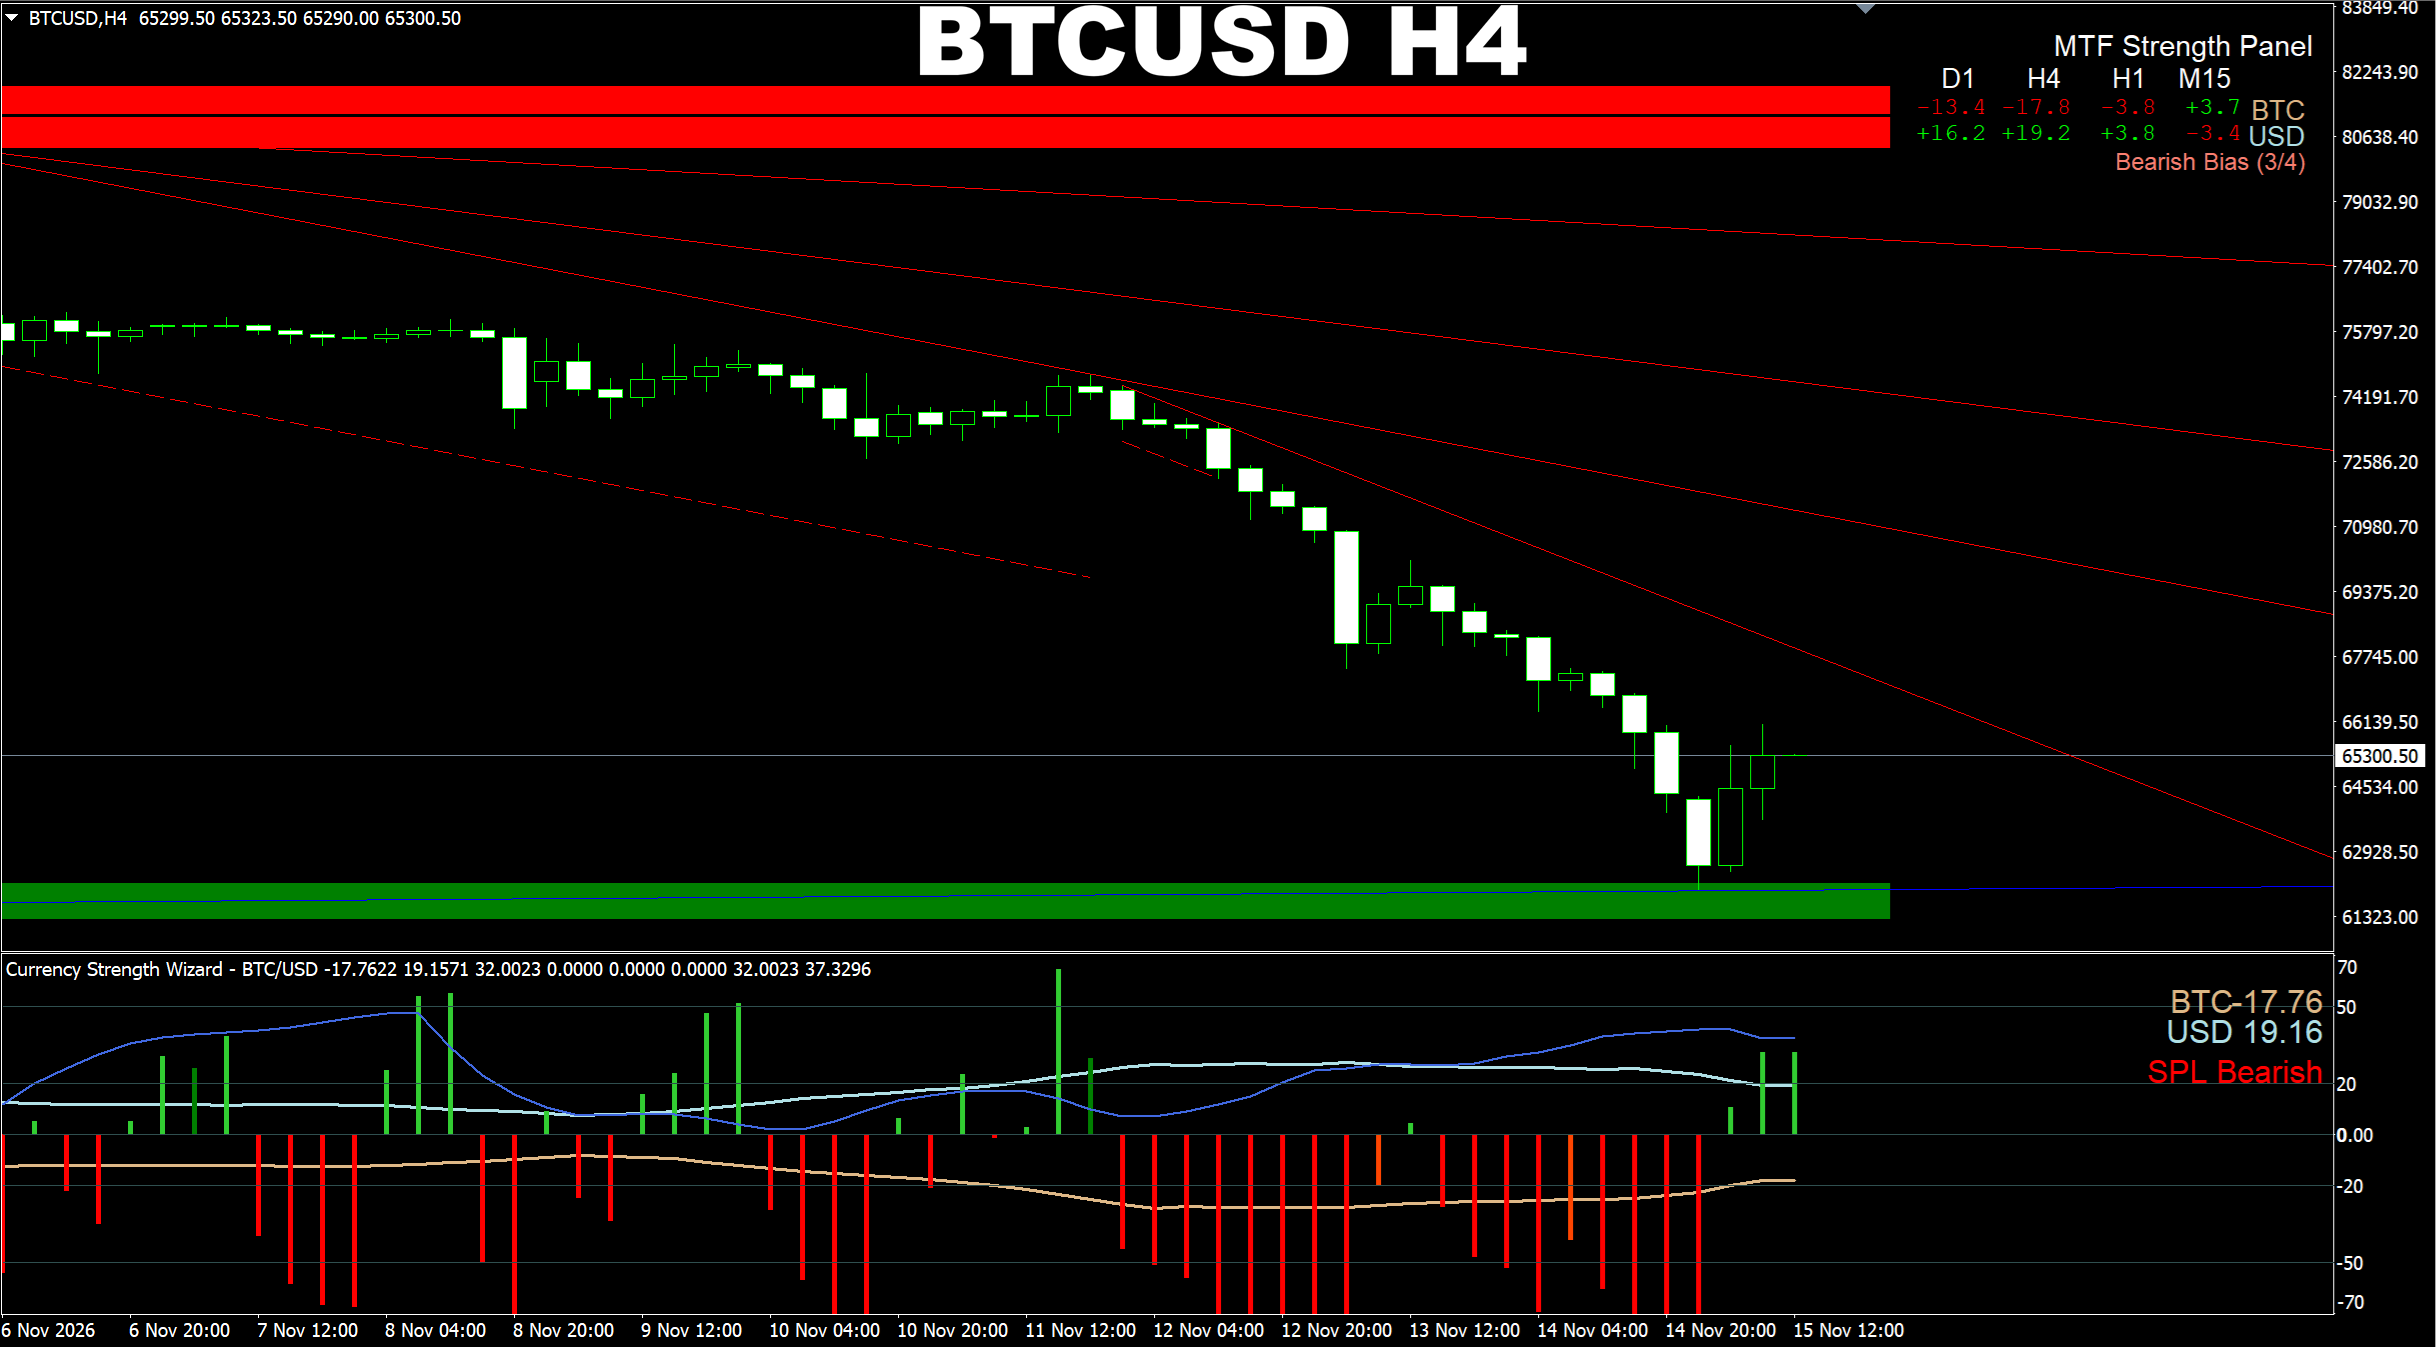
Currency Strength Wizard system. BTCUSD H4. Update on the SELL signals we traded yesterday. Price has reached all the targets based on all the time frames from M15 up to D1 which I provided yesterday. Now we see a pullback on higher time frames which is the bigger retracement on the lower ones. As I mentioned yesterday the price needed to find that liquidity area below 63K to jump up from it. So that area was found at 62K. Now the question is how far current retracement will go in terms of the up movement? Let's try to find out. Usually if the movement was strong and the price touched good liquidity area, first we need to watch for that pullback on at least H1 TF in terms of the strength lines and the strength bars like I showed this yesterday based on the M30 TF. On H1 the pullback is still in progress, on H4 of course it is also buy in terms of the short-term impulse, so the retracement on lower time frames is still in progress. In the next screenshot I will show you some more details based on lower time frame.
Oleg Rodin
Oleg Rodin
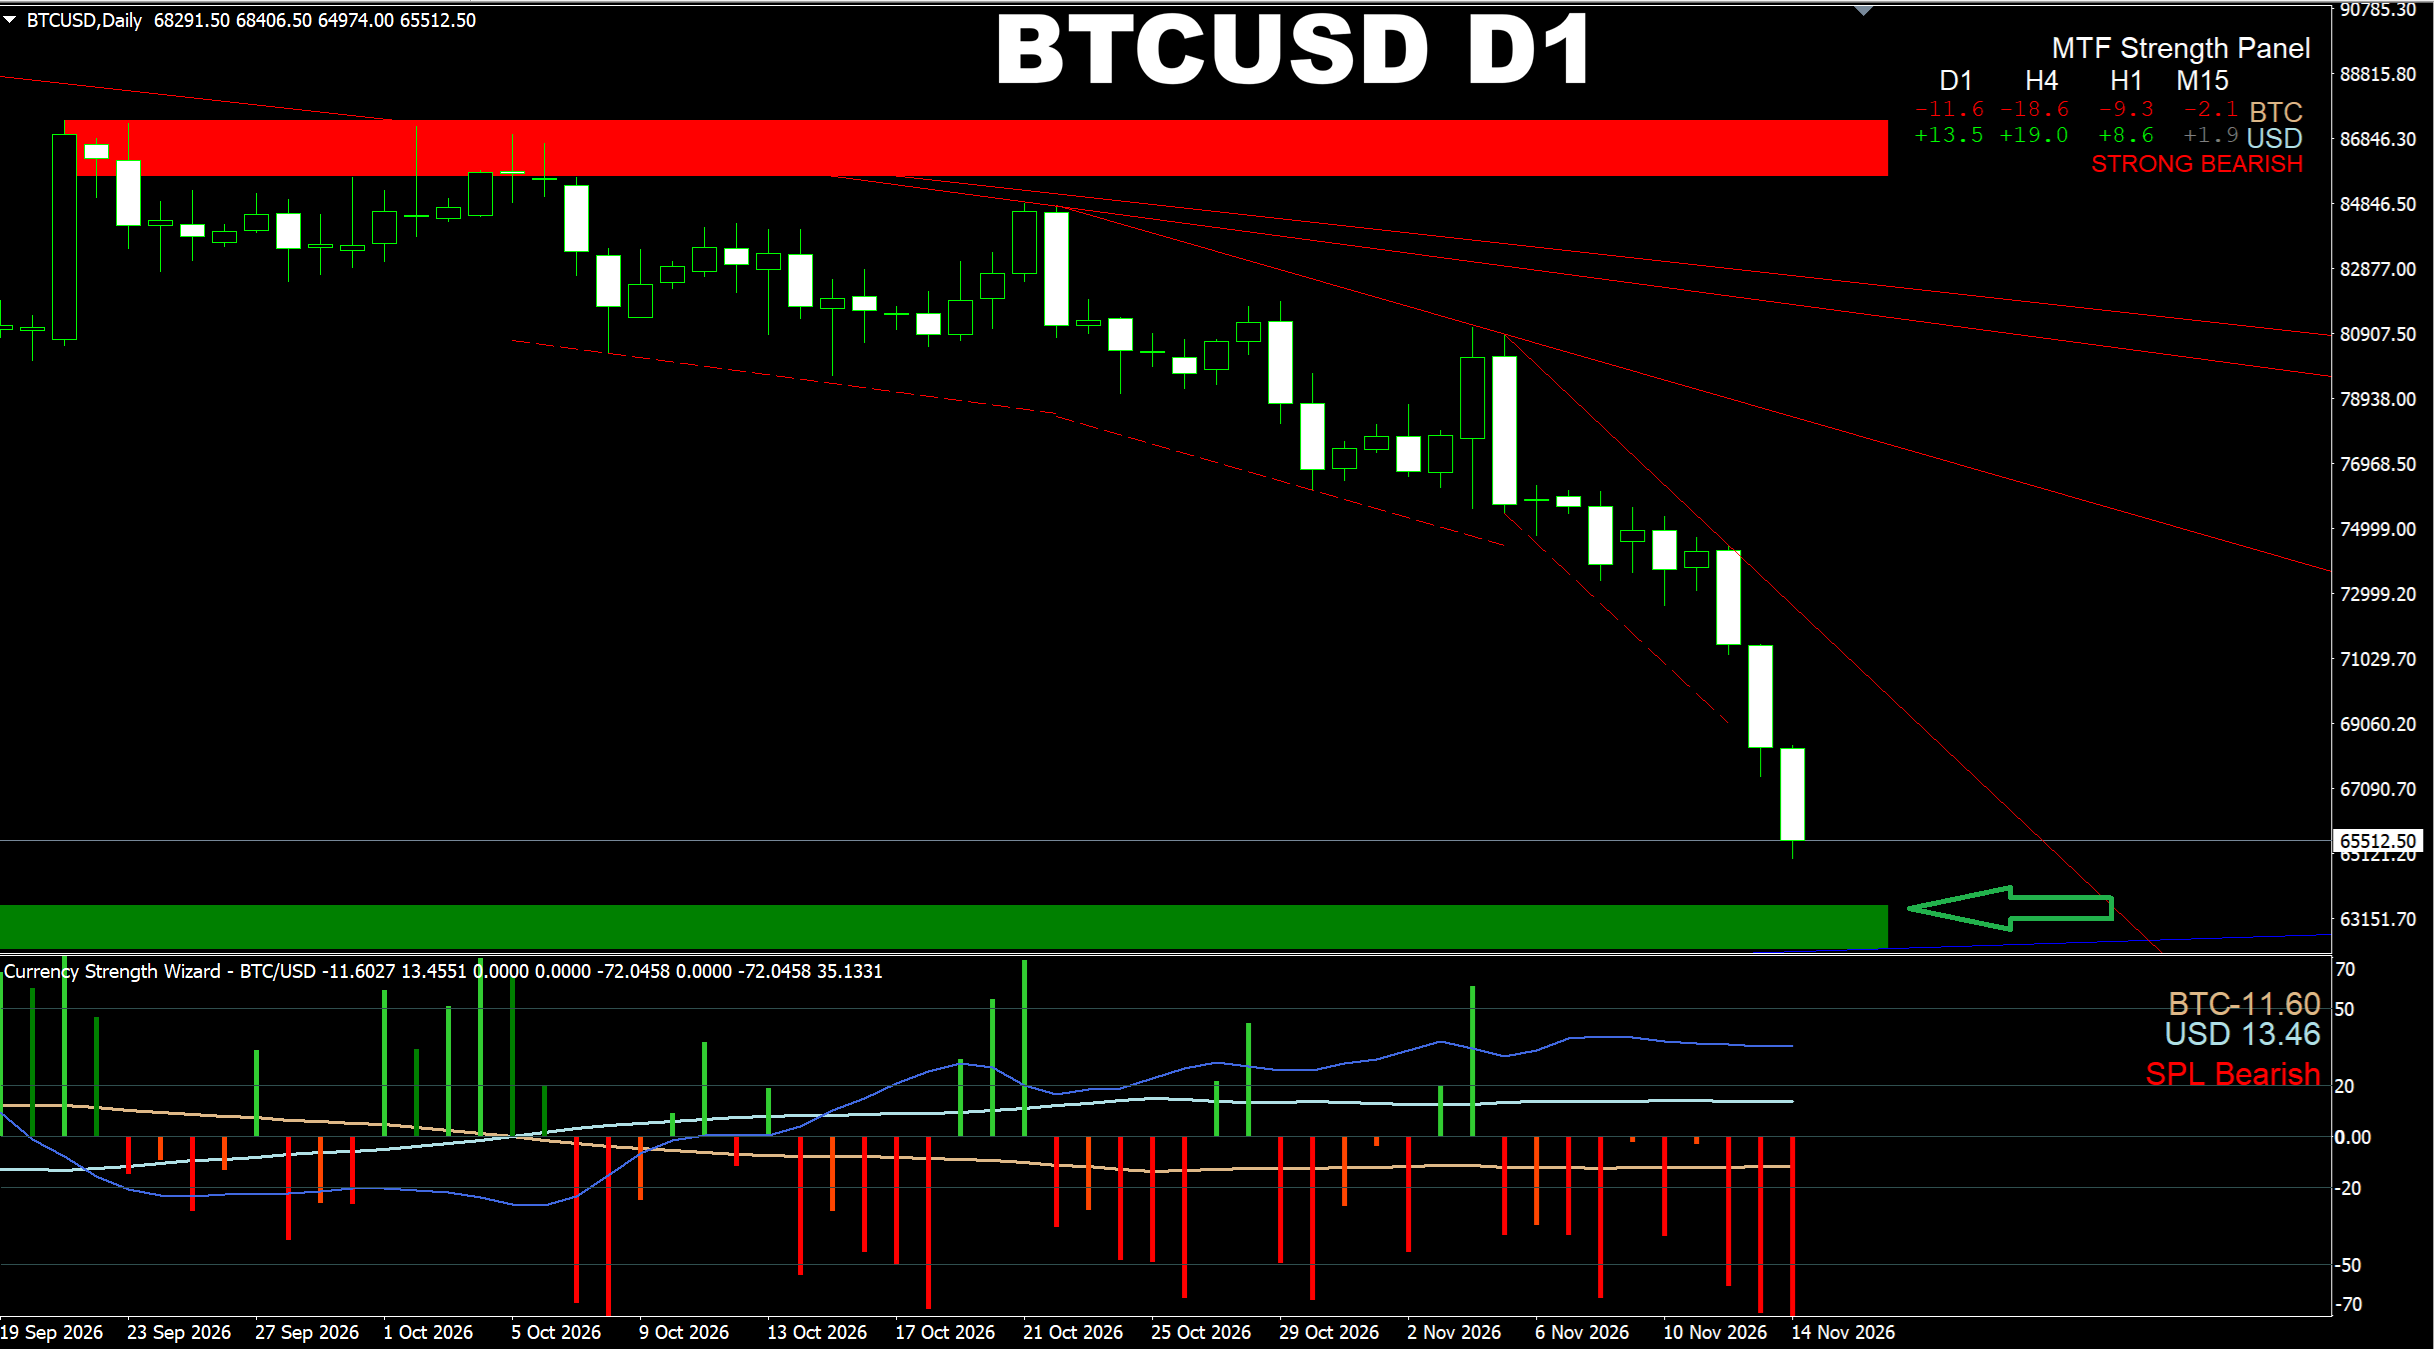
Currency Strength Wizard. BTCUSD D1. Yes, I know I have already provided many posts today based on live market regarding the way how I trade using the Currency Strength Wizard indicator, but I want to give you one more today based on the D1 TF. I just want you to have the bigger picture of the BTCUSD market and what we can expect in the near future. As you already know based on my previous posts, I expect the price to continue going lower till it reaches the global target based on current global selling wave, let's call it this way:) So it seems we are not going to see any decent UP waves till the price reaches the Demand area on the D1 TF. At least this is what I see now. Moreover please do not forget that the price, when it reaches this or that SD area, usually dives deeper a bit to find that liquidty zone which can cause some decent opposite wave. I wish you happy trading!:)
Oleg Rodin
Oleg Rodin
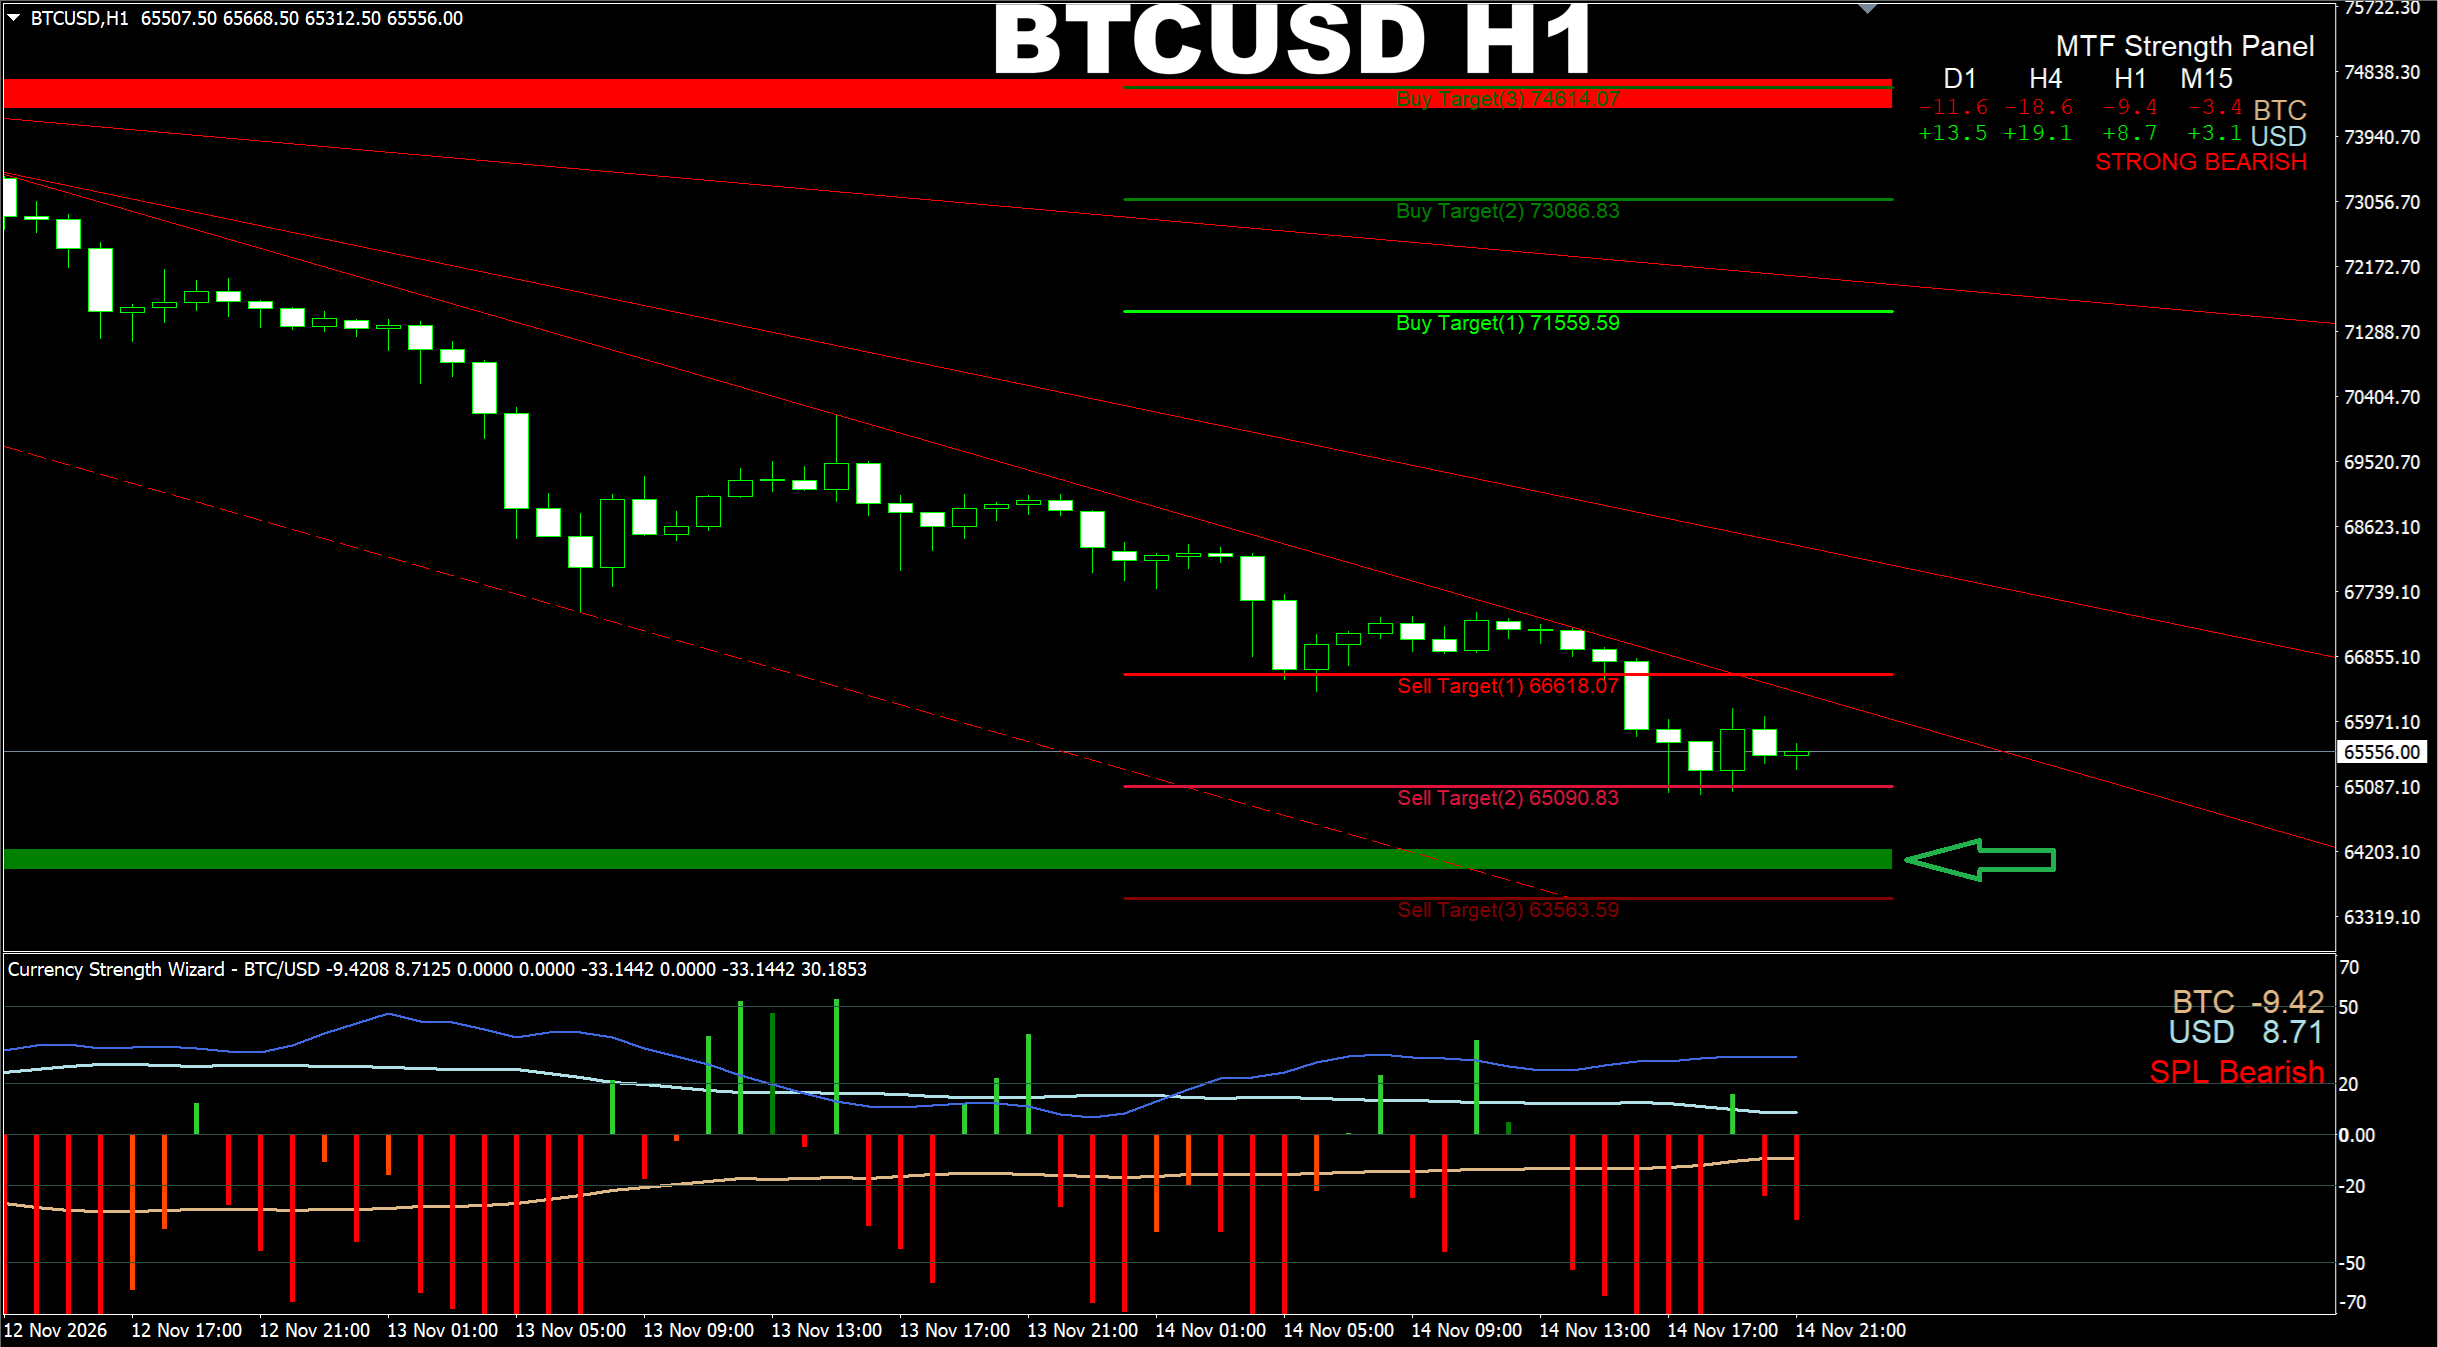
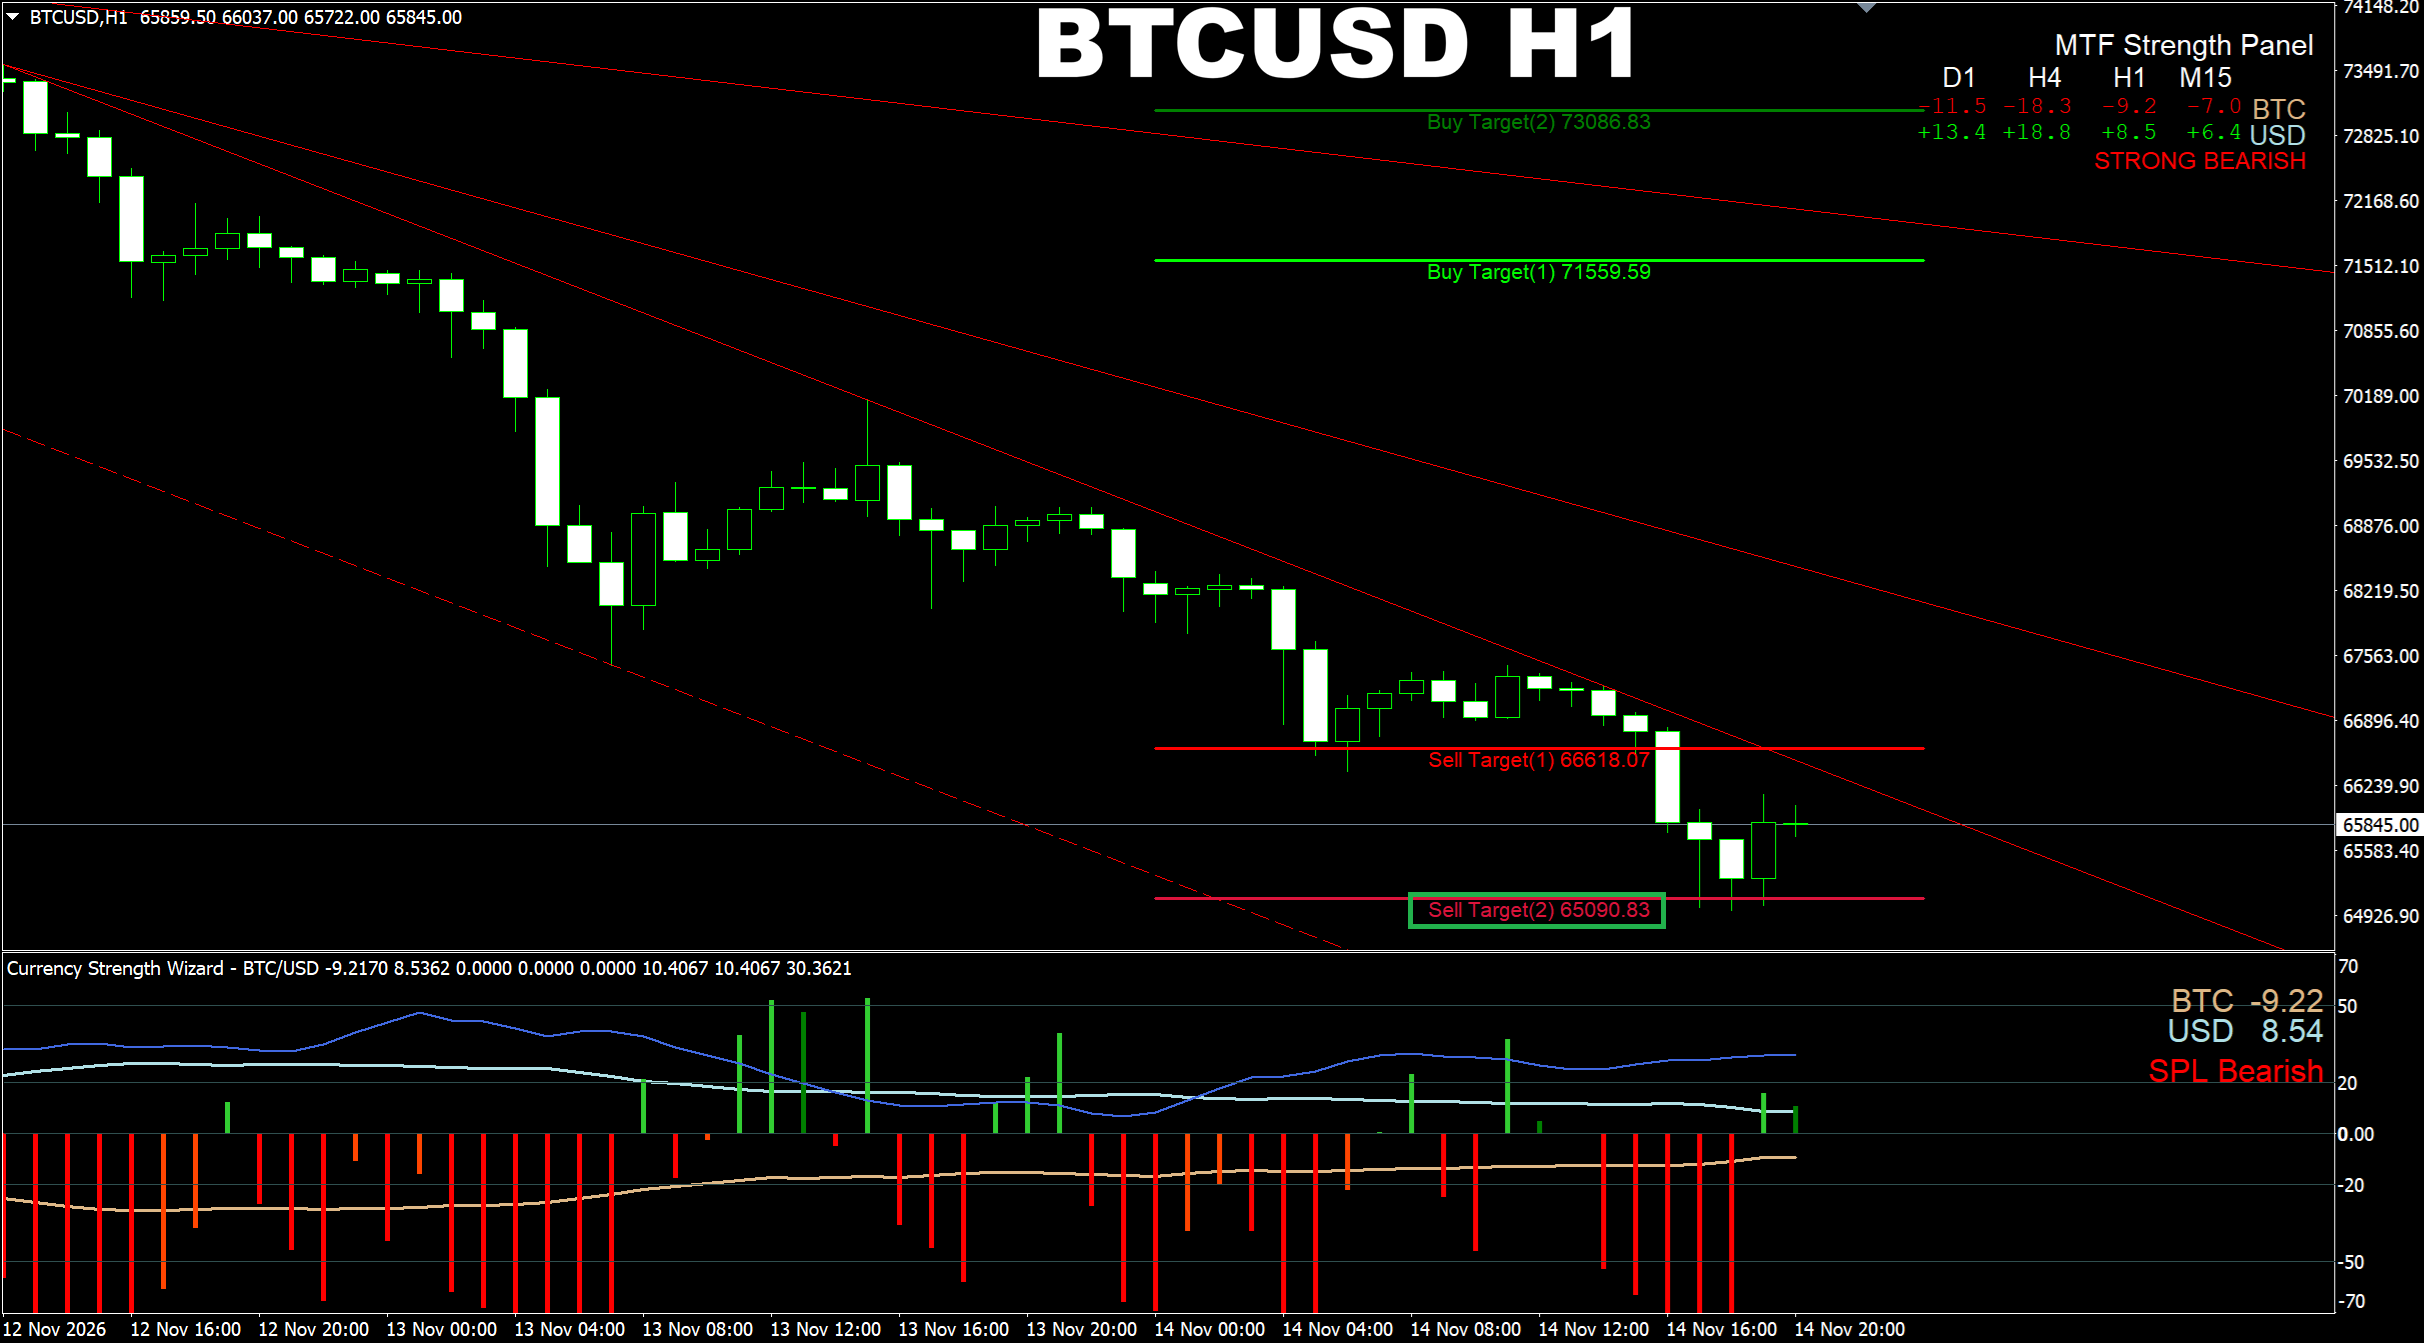
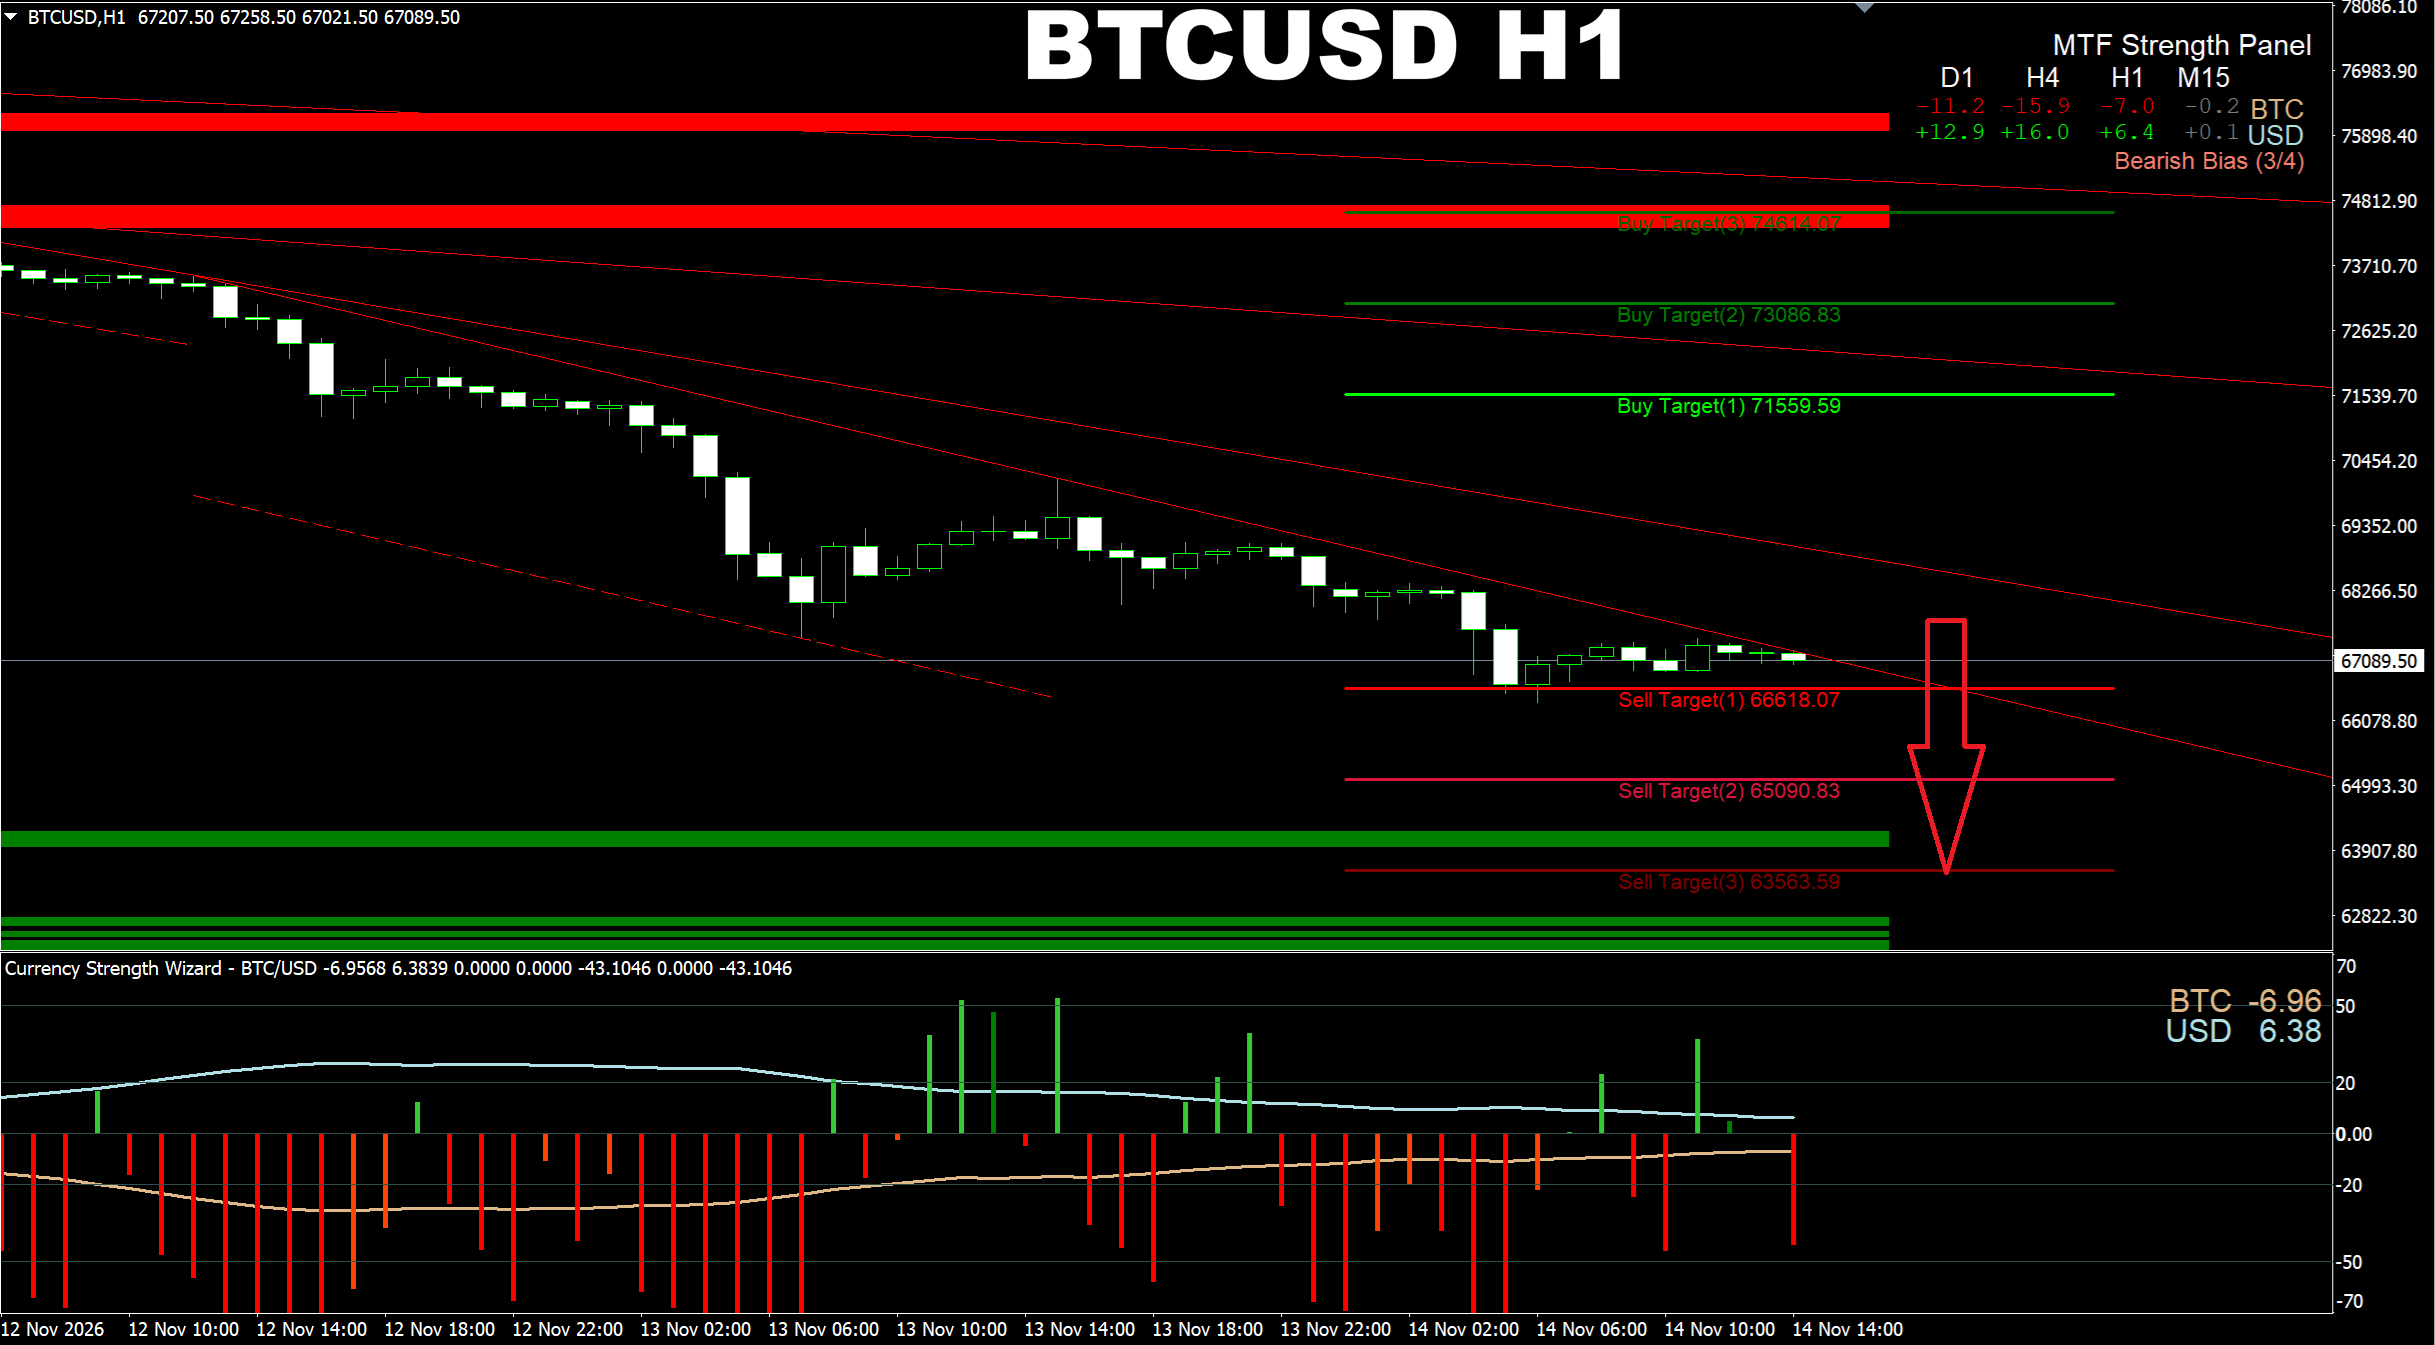
Currency Strength Wizard system. BTCUSD H1. If you decide to continue selling, here are the next possible targets for you which are within the global current trend channel. The next one is the Demand area of 64300. And if the price goes there, probably it will also touch the 63563 which is the bottom of the current channel. And if you ask me what SL you can use in this situation, the previous target of 66618 will be fine. In fact it is possible to use even smaller SL based on the SD areas of the lowe time frames. But BTCUSD is very volatile pair so using a good protective SL usually works way better, especially taking into consideration that the price has already gone so many pips down non-stop.
Oleg Rodin
Oleg Rodin
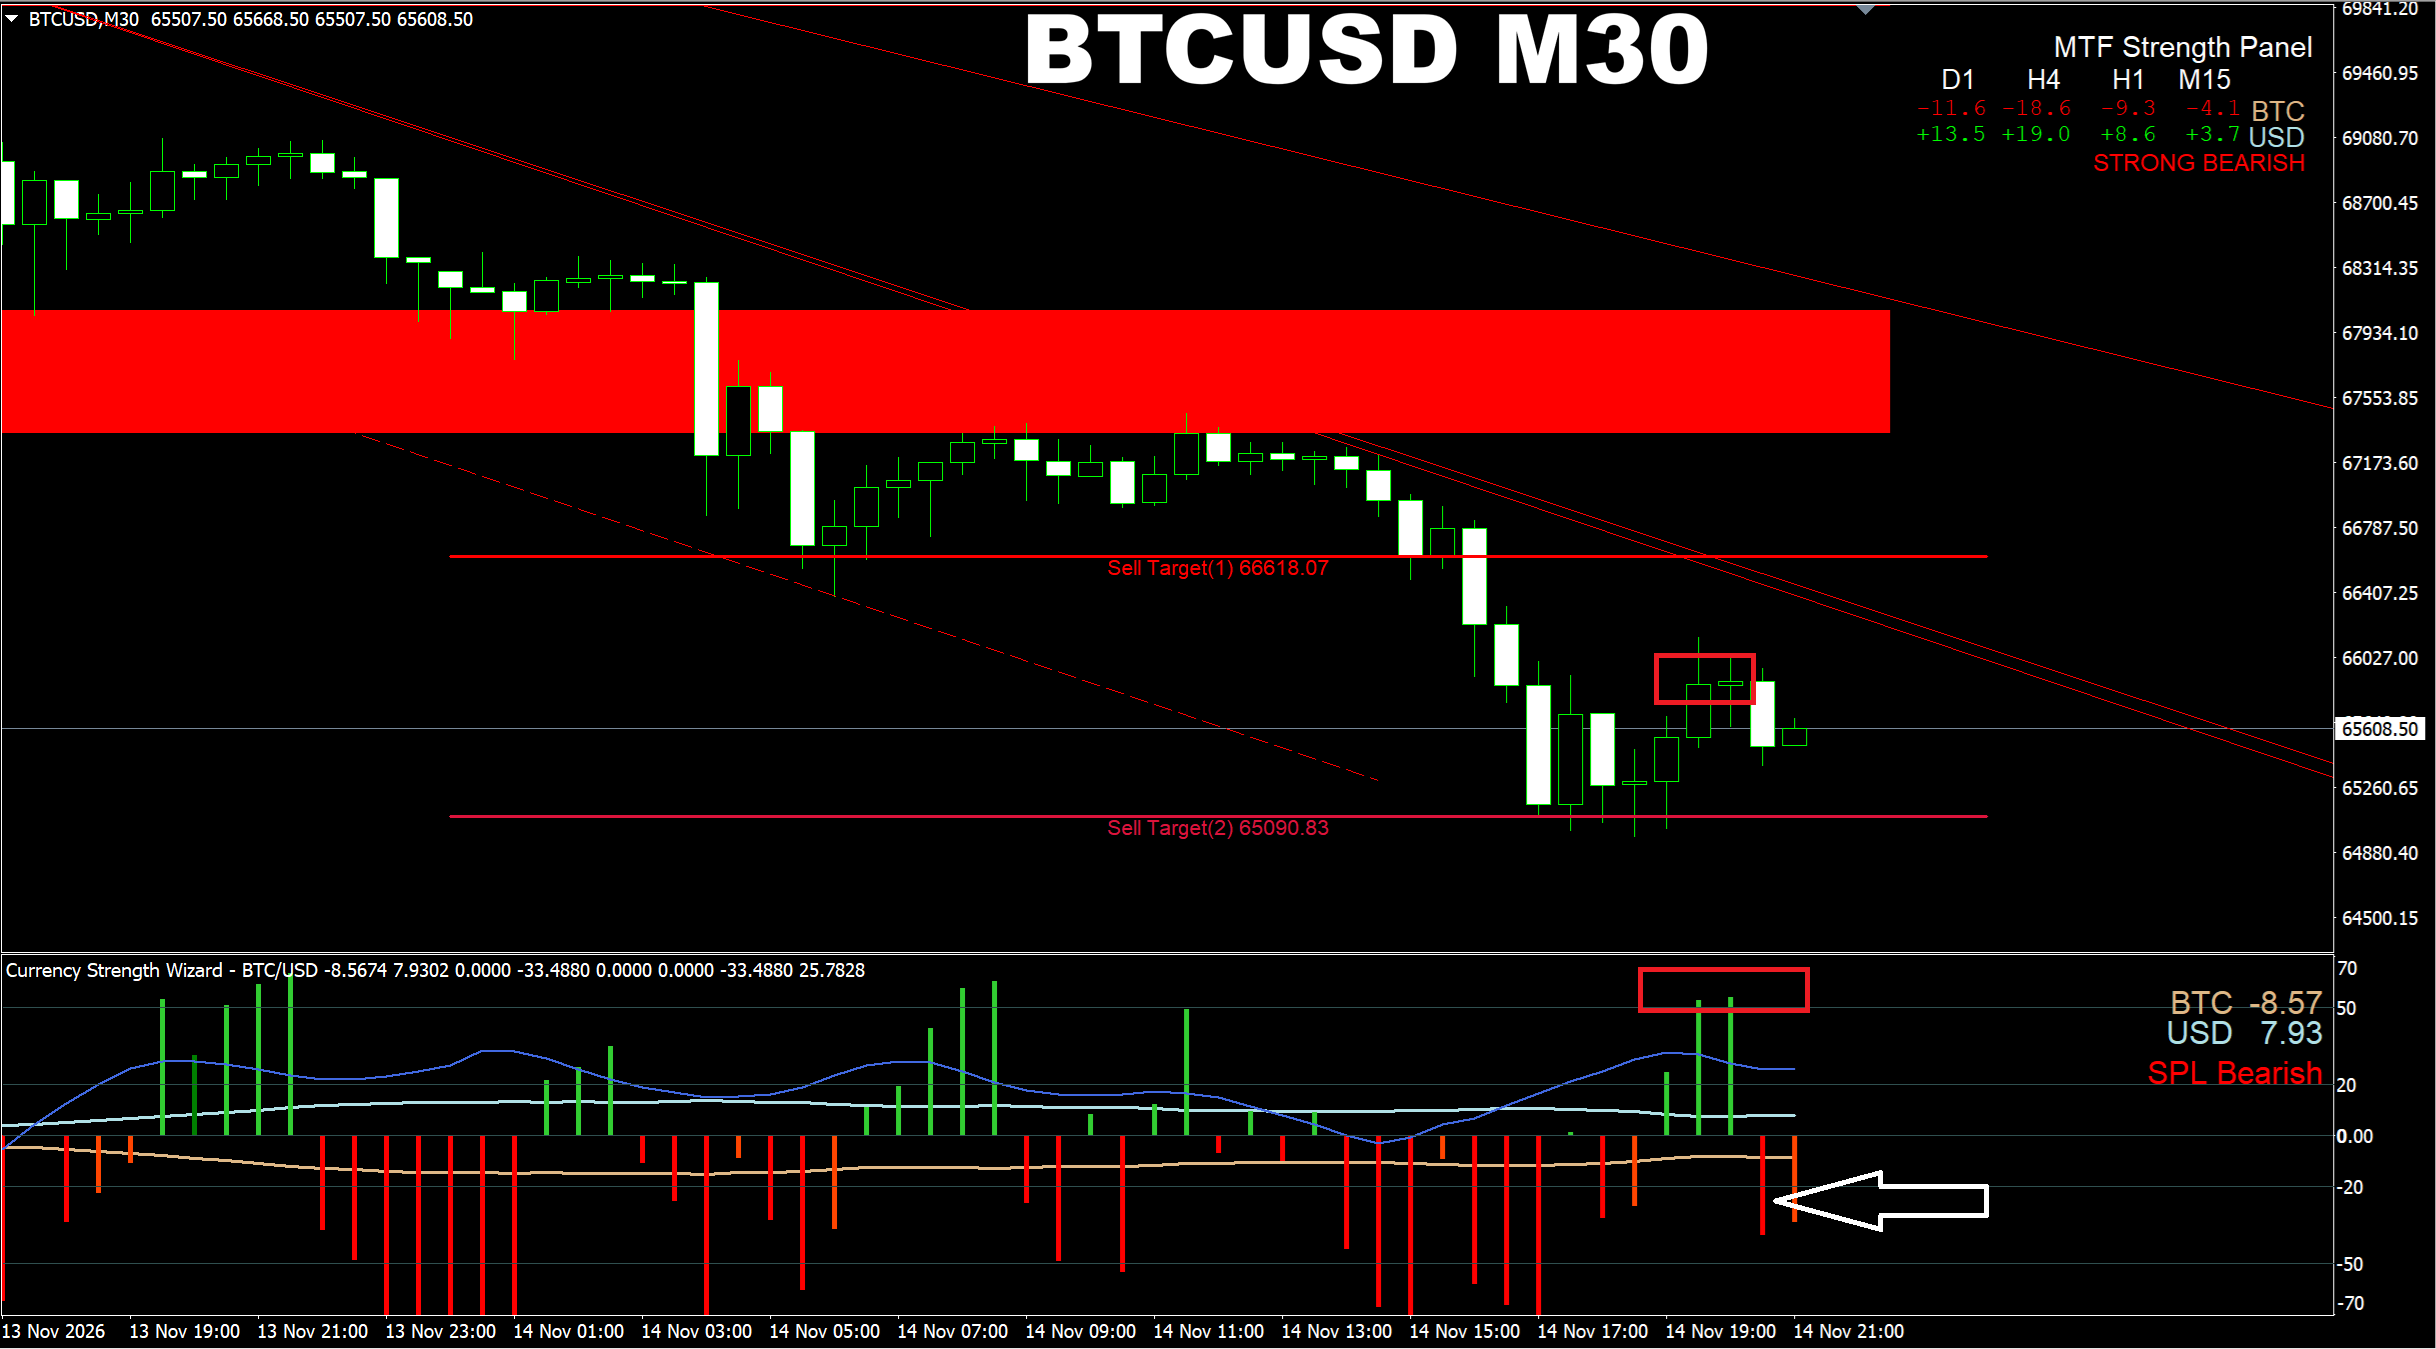
Currency Strength Wizard system. BTCUSD M30. If we check the M30 TF now, like I suggested earlier waiting for the pullback to be fully formed. So here we will see that the selling pressure is getting back as the pullback on this time frame has been formed. So it means there may be some selling pressure again.
Oleg Rodin
Oleg Rodin
Currency Strength Wizard system. BTCUSD H4. Update on the global target the price is heading to. Remember in one of my previous posts I mentioned that in trading price always goes from one SD (Supply/Demand) area to another. See the Demand area down below on this H4 chart? No other obstacle there. What does it mean? The price will be there eventually, especially taking into consideration the strength parameters the indicator is showing now. The swing predictor line in this case plays an important role too. See it is going higher with time (thin blue line)? In selling high position of this line tells about strong "inertia", when the power is so strong so it will not be easy for the wave to stop. As a result that power will be enough to eventually drive the price down to the Demand area shown.
Oleg Rodin
Oleg Rodin
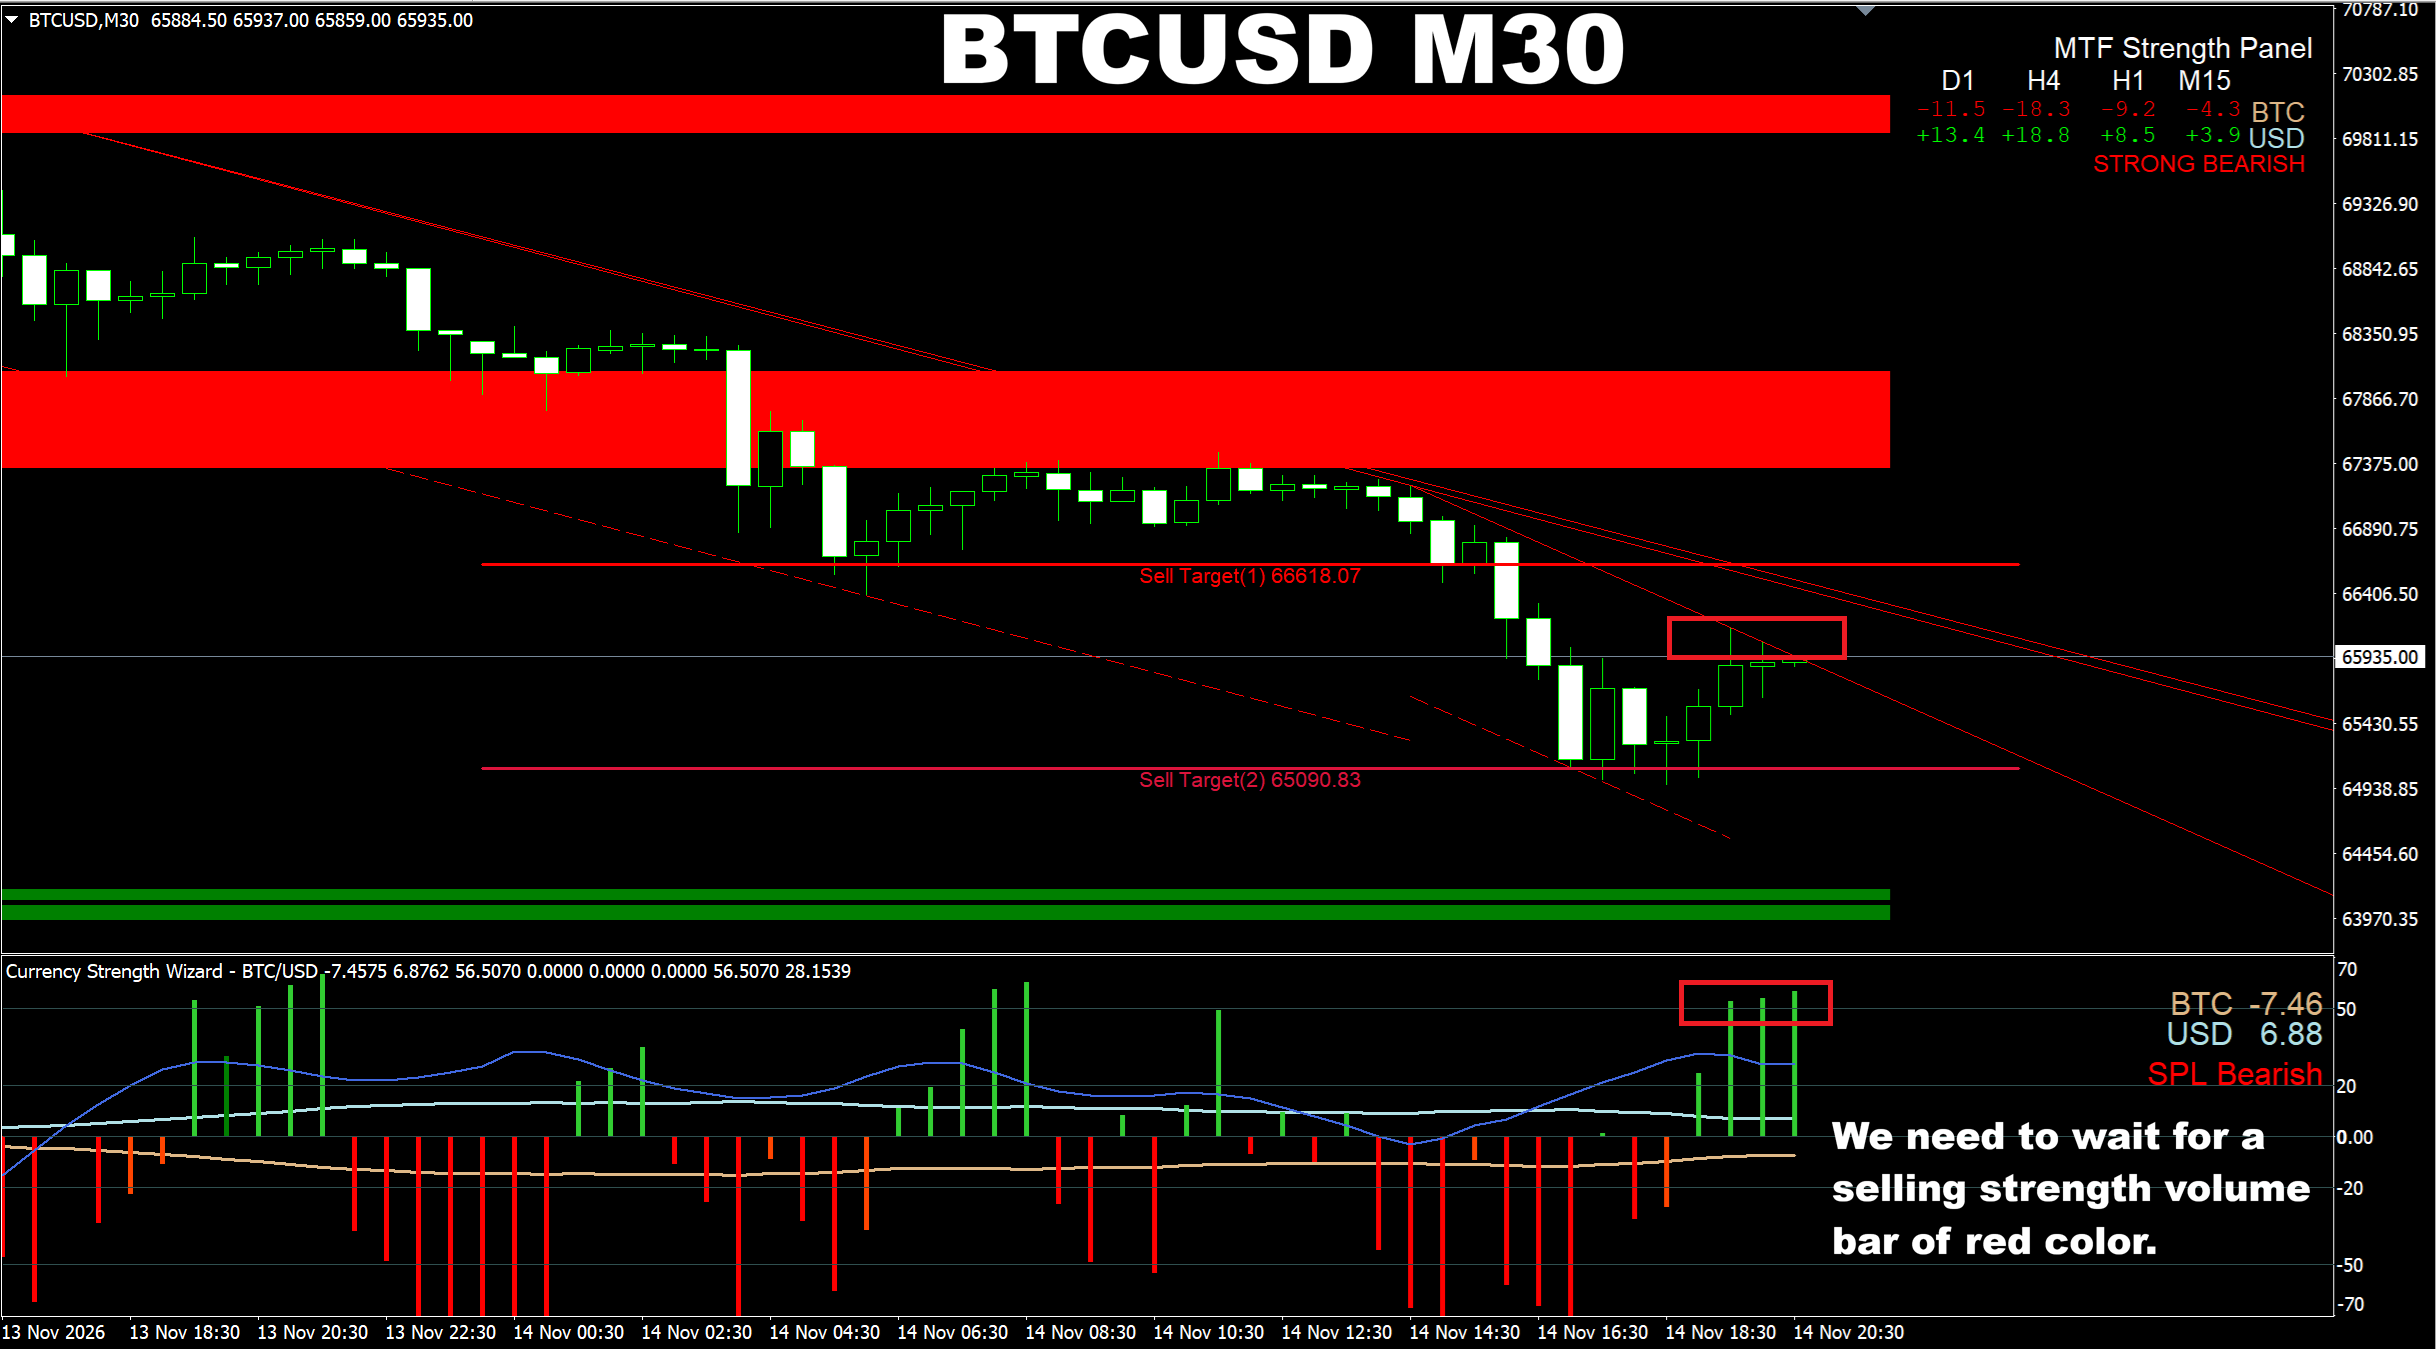
Currency Strength Wizard system. BTCUSD M30. Based on current market conditions I want to show you how we can work with the pullbacks. When the trend is strong (the indicator tells this actually), we look for pullbacks on the time frame we used for entry. All we need is wait for the green strength volume bars go above 50 level or even higher and wait for the change in volume bars (in case of selling). But I usually prefer checking the next higher time frame for this purpose. As we used M15 for entry, the M30 will be used to check the pullback status. Now we can see the pullback is on its final stage. We need the red strength volume bar for confirmation before we may consider the price may continue going down again.
Oleg Rodin
Oleg Rodin
Currency Strength Wizard system. BTCUSD H1. Update on the recent SELL signal + update on future direction. The target has been reached. See how easy it is to trade when we check more than one time frame in trading and actually have bigger and better picture of the market. We started with the M15 to catch the start of the wave and used H1 as the time frame to confirm the target and direction. In trading price always goes from one SD (Supply/Demand) area to another. And when we know the direction, strength and other parameters of the market I mentioned today, we can easily stay at the right side of the market. By the way, if we check the Demand area I mentioned earlier including in my previous post, we will see that the price still has not got to that area. Yes, the target has been reached. But it seems the selling trend will continue. It means the price will probably continue going lower after the pullback.
Oleg Rodin
Oleg Rodin
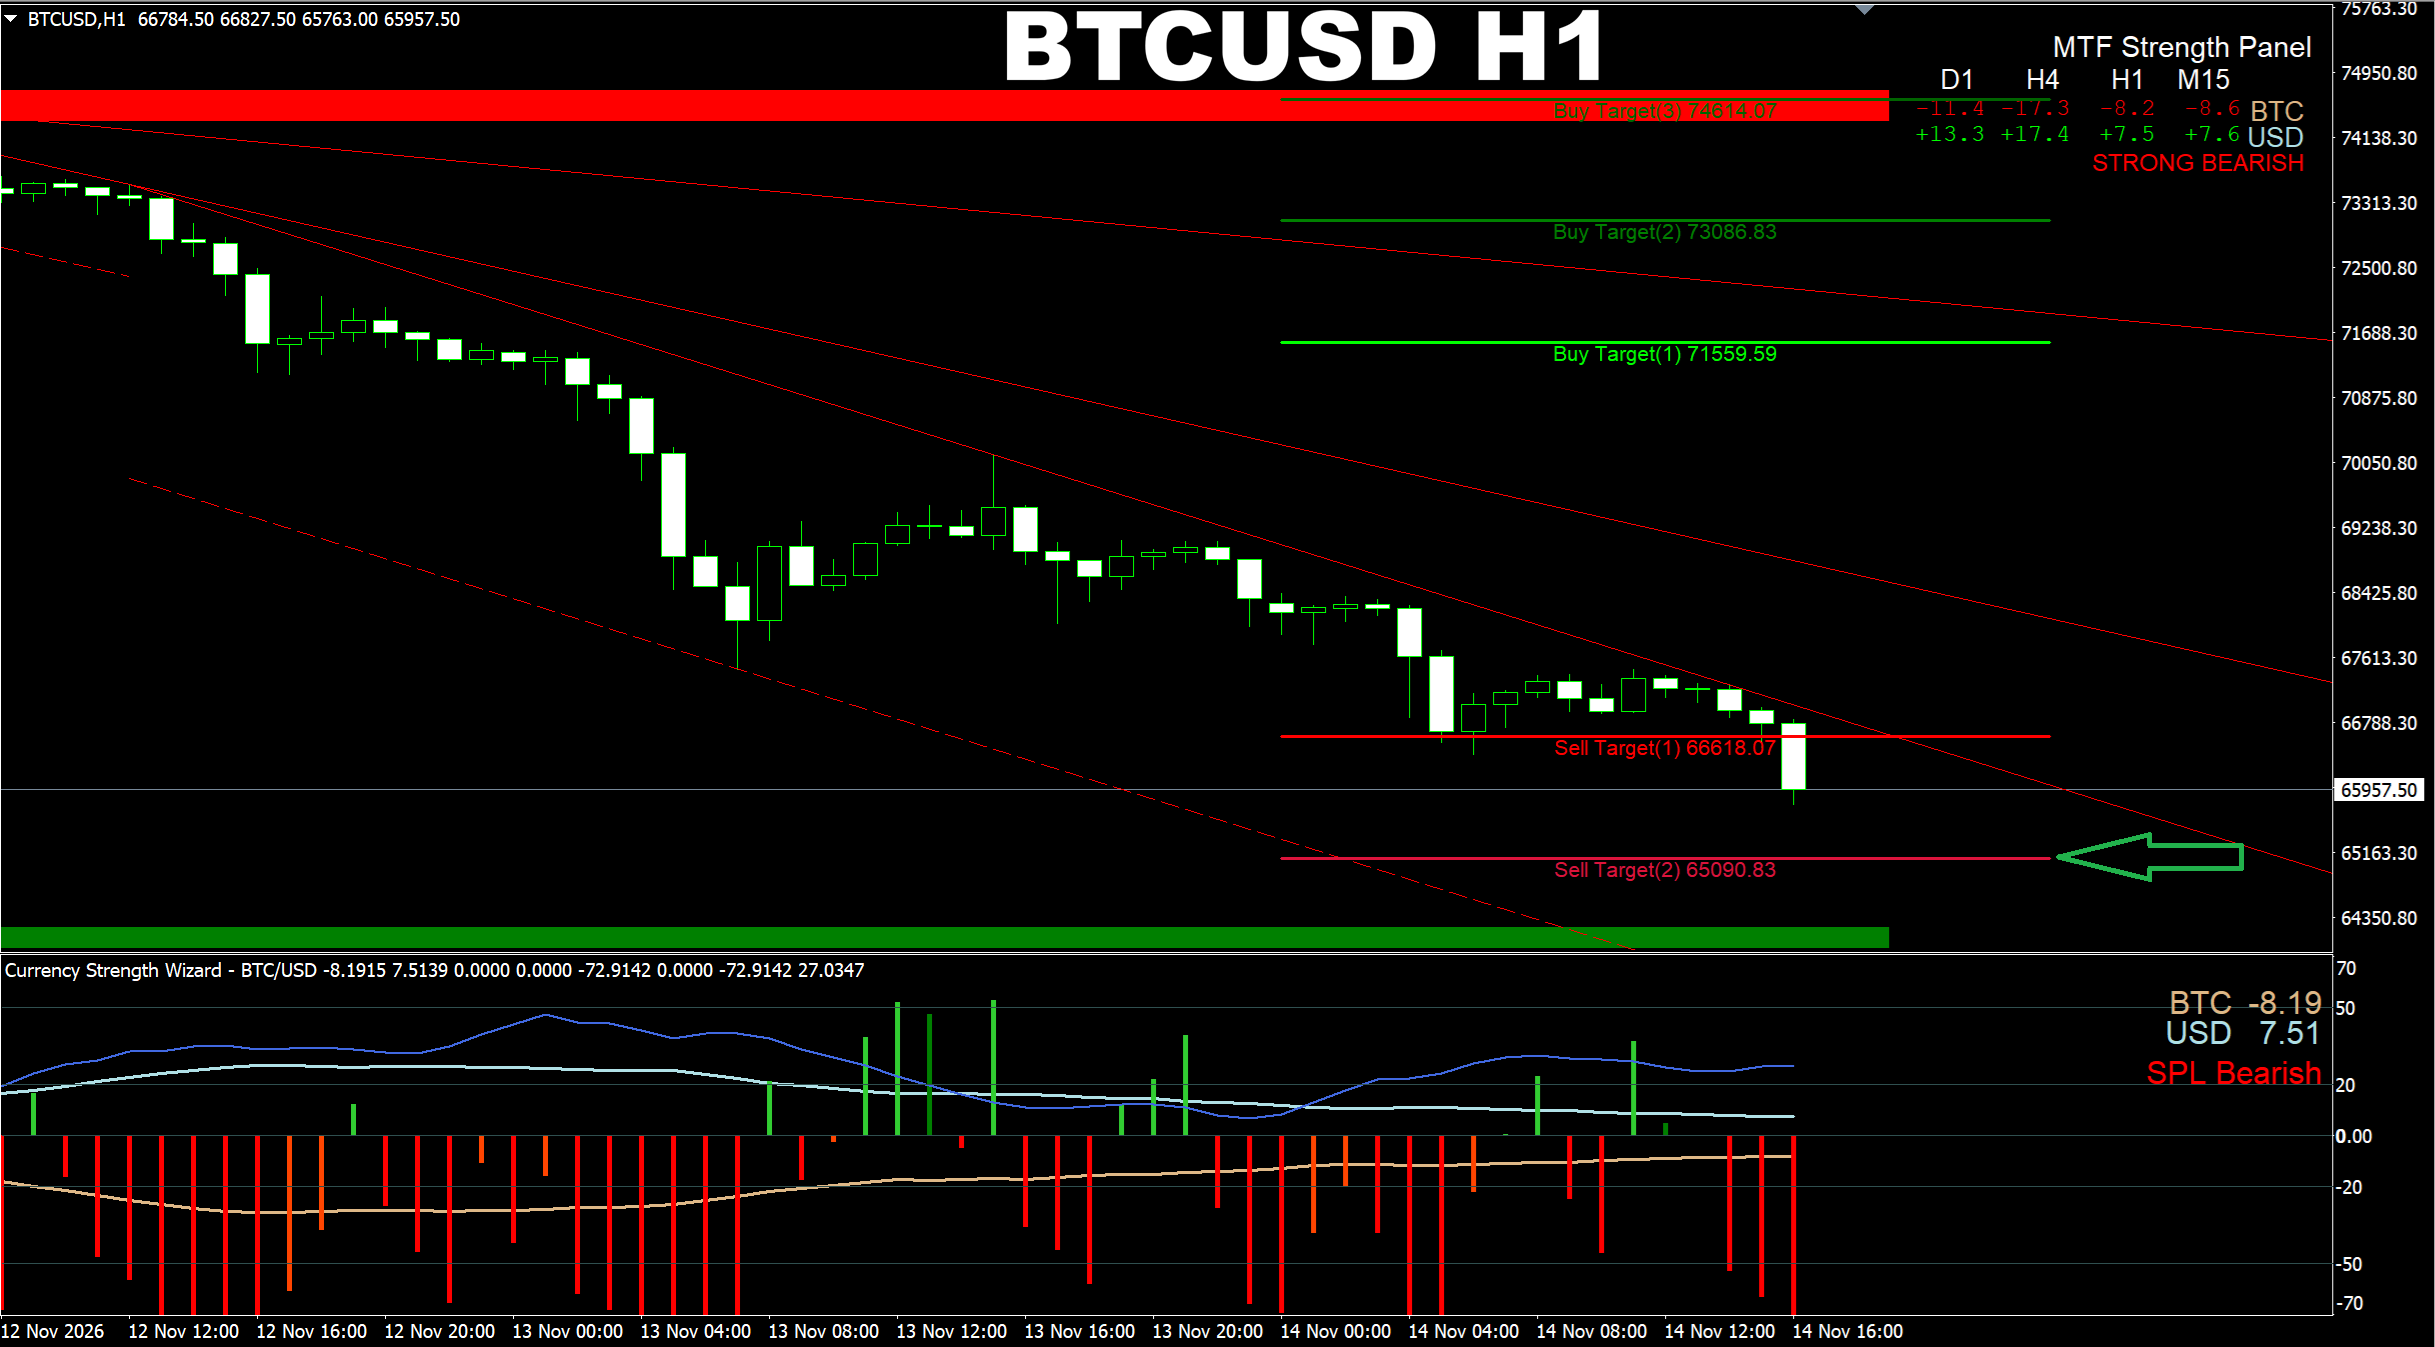
Currency Strength Wizard. BTCUSD H1. Update on my previous post. Let's check if our target is optimal or not. Let's check what we have now on H1 TF. We see the overall bias is Strong Bearish. We see the volume strength bar is at -70 while the strength lines are in the favor of the signal. It means strong breakout wave down. The swing predictor algorithm shows Bearish and its line is abve 20 which means great short-term impulse. Plus the price is clearly in the selling channel and our target is within this channel's range. Moreover we can see that the nearest Demand area is even below the target we are following which means that our target will be reached with very high probability. Moreover the price may go even lower toward the Demand area we can see here as the channel allows this.
Oleg Rodin
Oleg Rodin
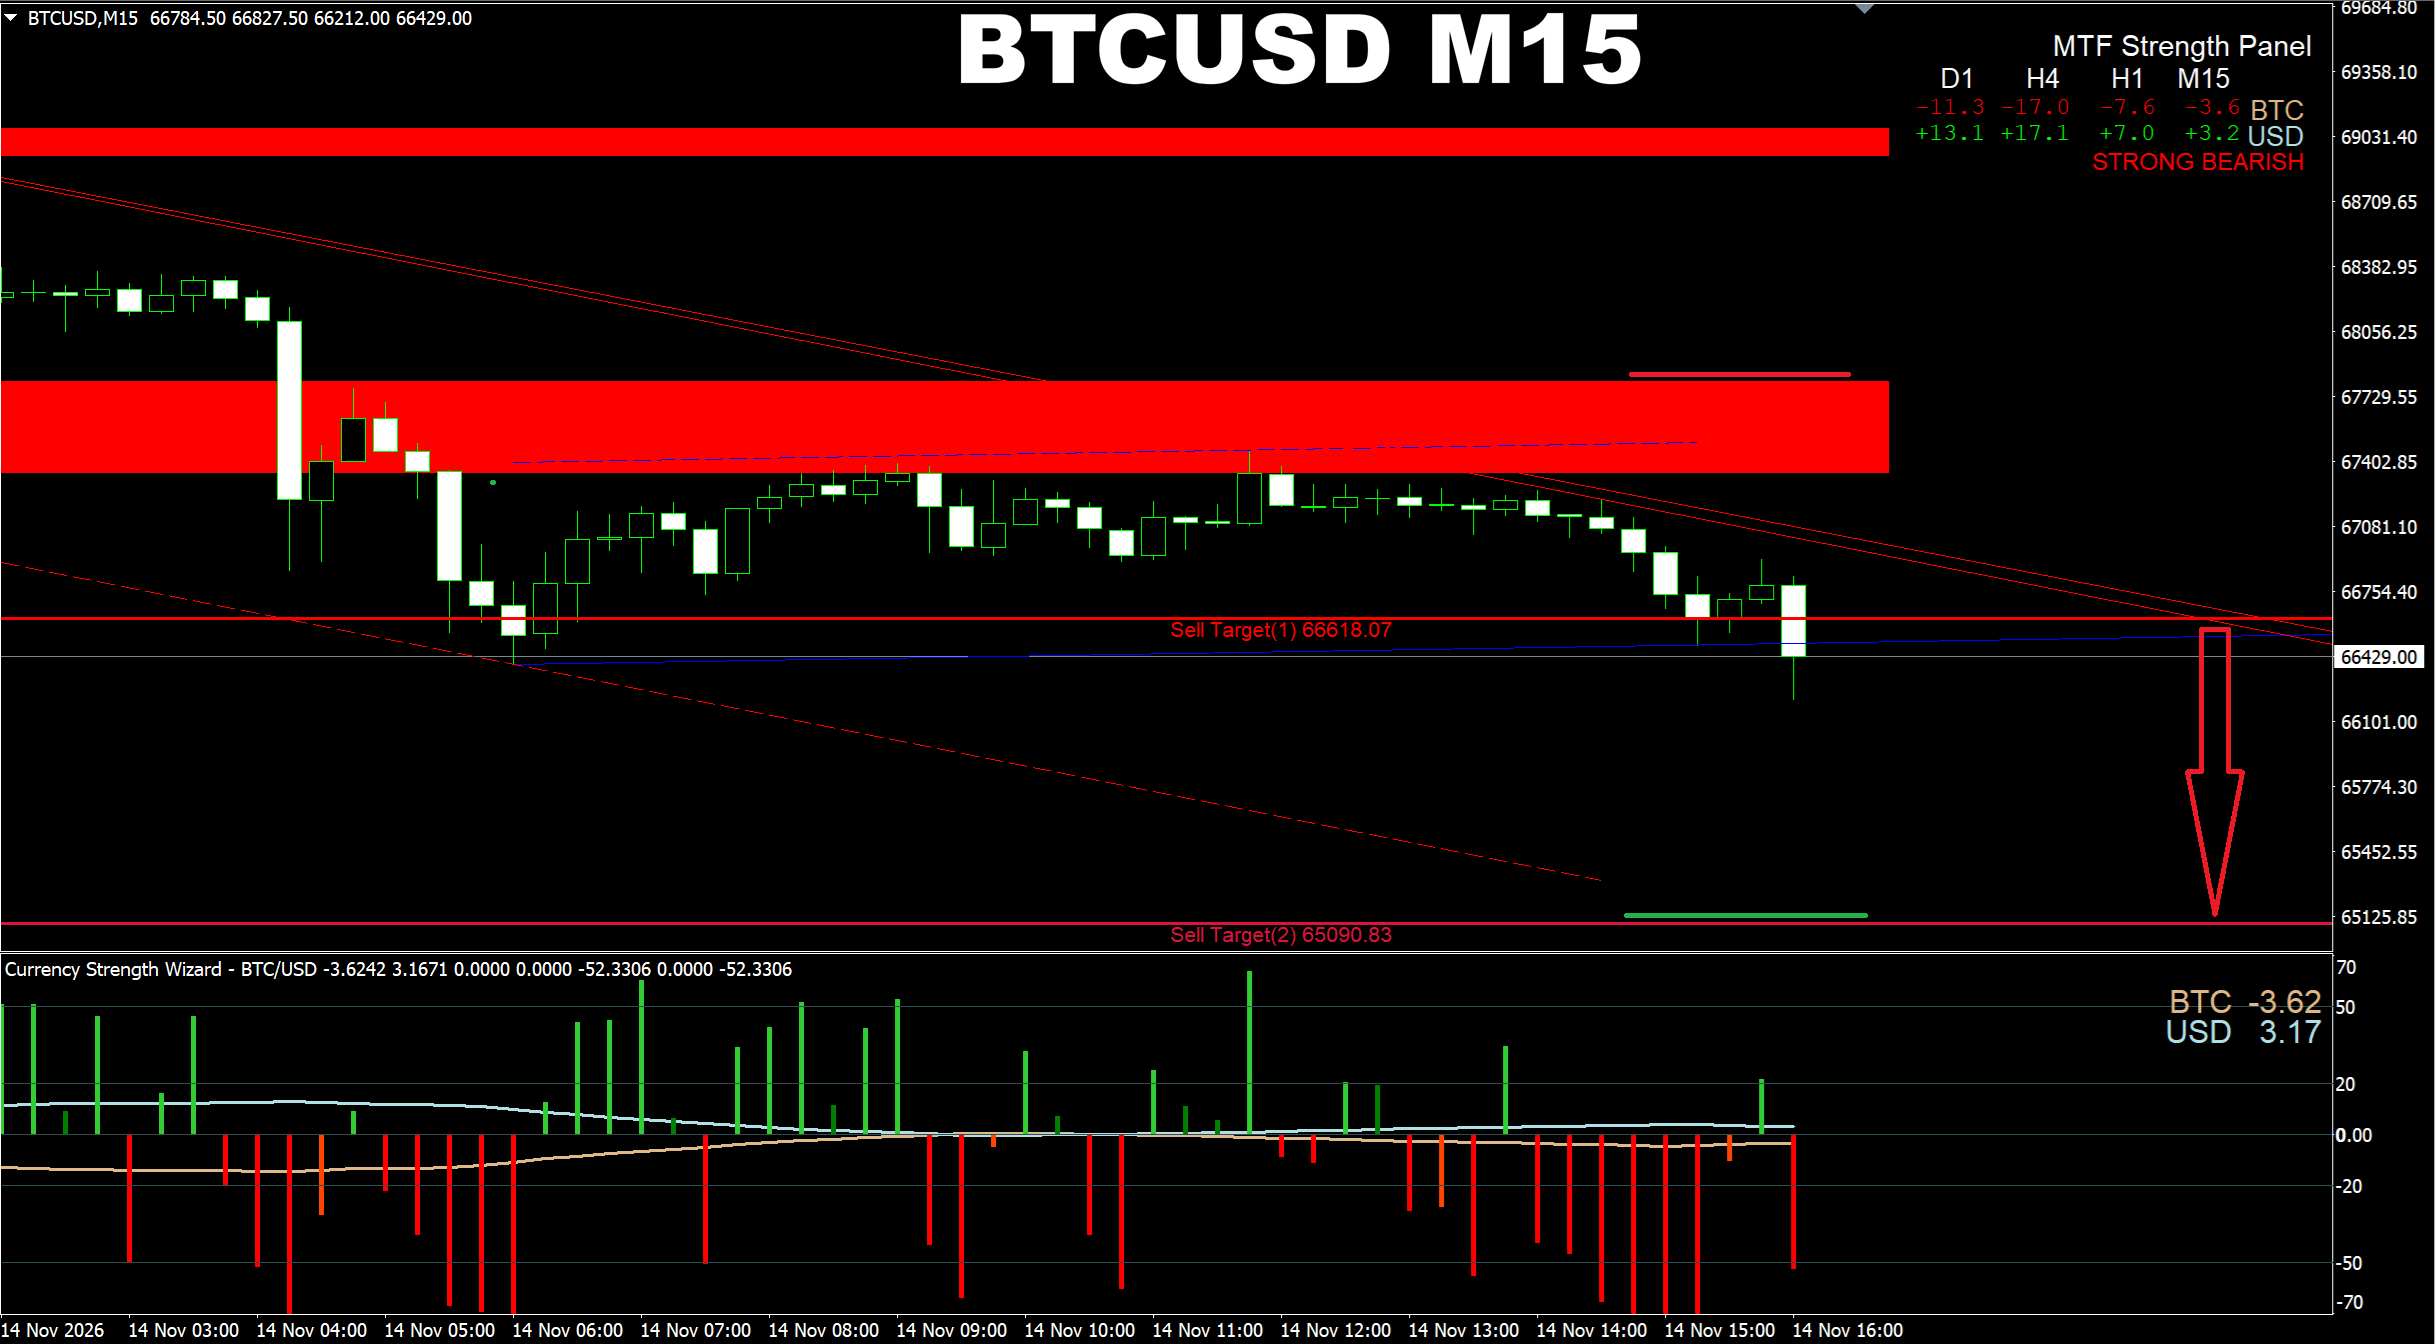
Currency Strength Wizard. BTCUSD M15. Another update on the SELL signal we've been following. The price is going down toward our next target as predicted. Now a tip for you. How can we check if current target is good for us or not? All we need is check the strength parameters based on the higher time frame's data. Plus checking the channel and SD zones would also be great. Let's do this in the next post.
Oleg Rodin
Oleg Rodin
Currency Strength Wizard. BTCUSD M15. Another update on the SELL signal we've been following. We see the price is now breaking that demand area which we used as our main TP. Even if we have some pullback now, the price has already shown what next target it wants to go. What does it mean? It means we can now follow that next bigger target I mentioned earlier.
Oleg Rodin
Oleg Rodin
Currency Strength Wizard. BTCUSD M15. Another update on current market. Price has reached our main target which is the Demand area I mentioned earlier. Now watch for this area closely. If the price breaches it, you can follow the next bigger target I provided in my previous post.
Oleg Rodin
Oleg Rodin
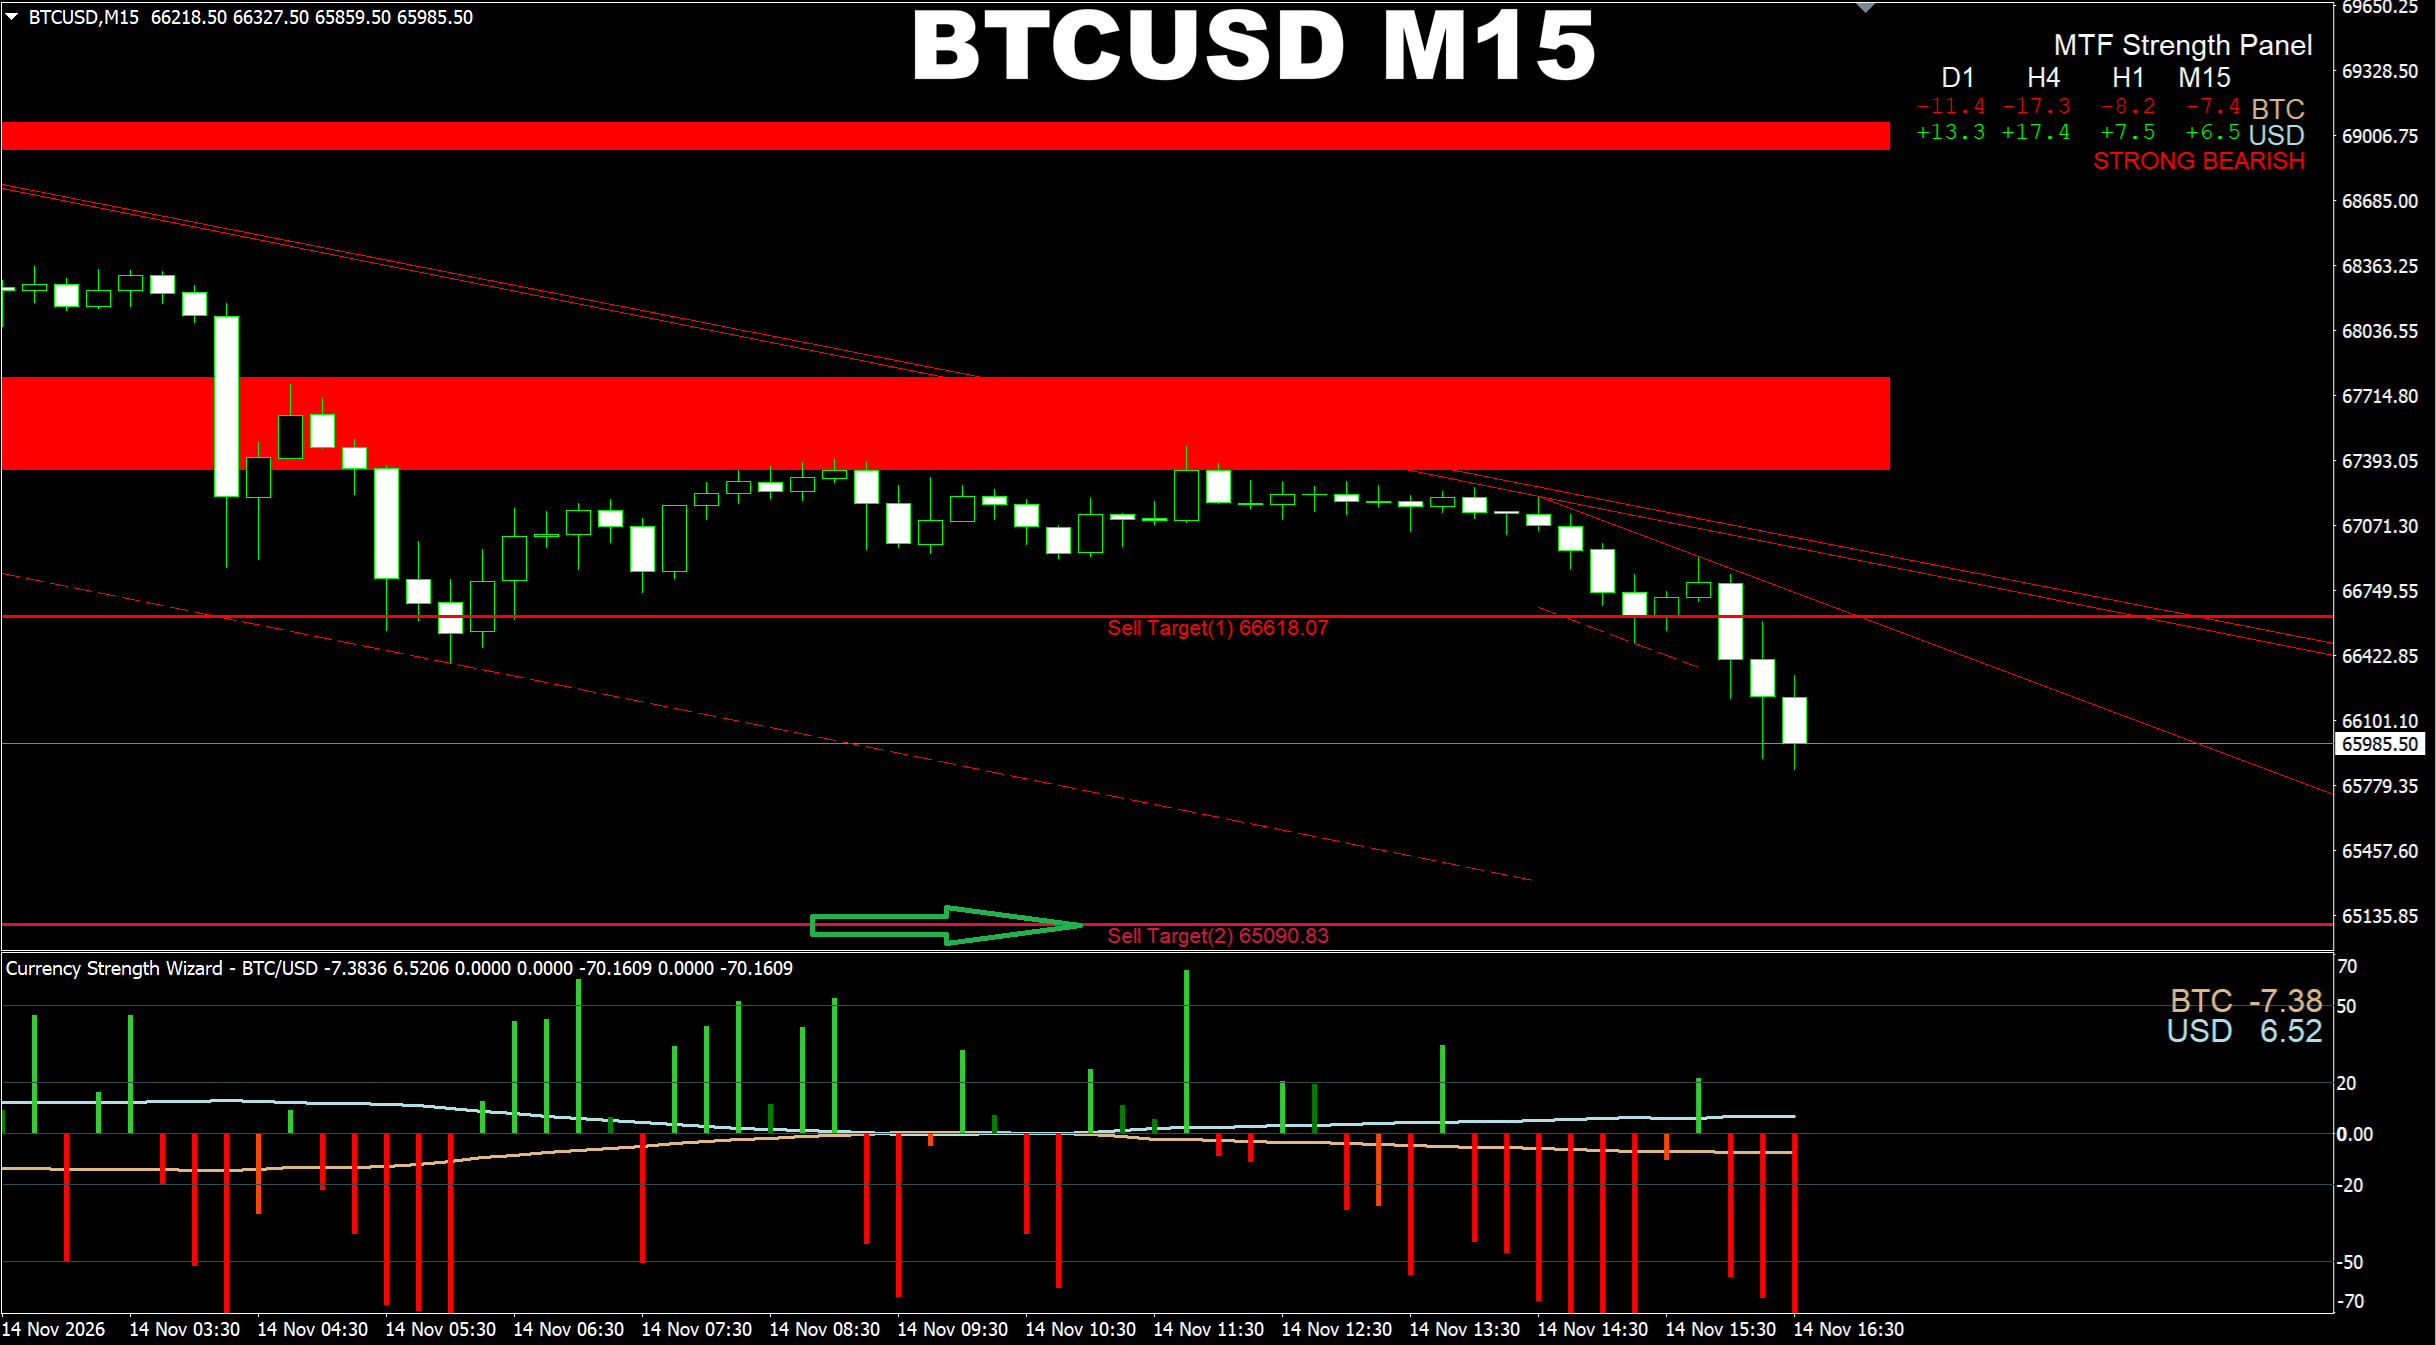
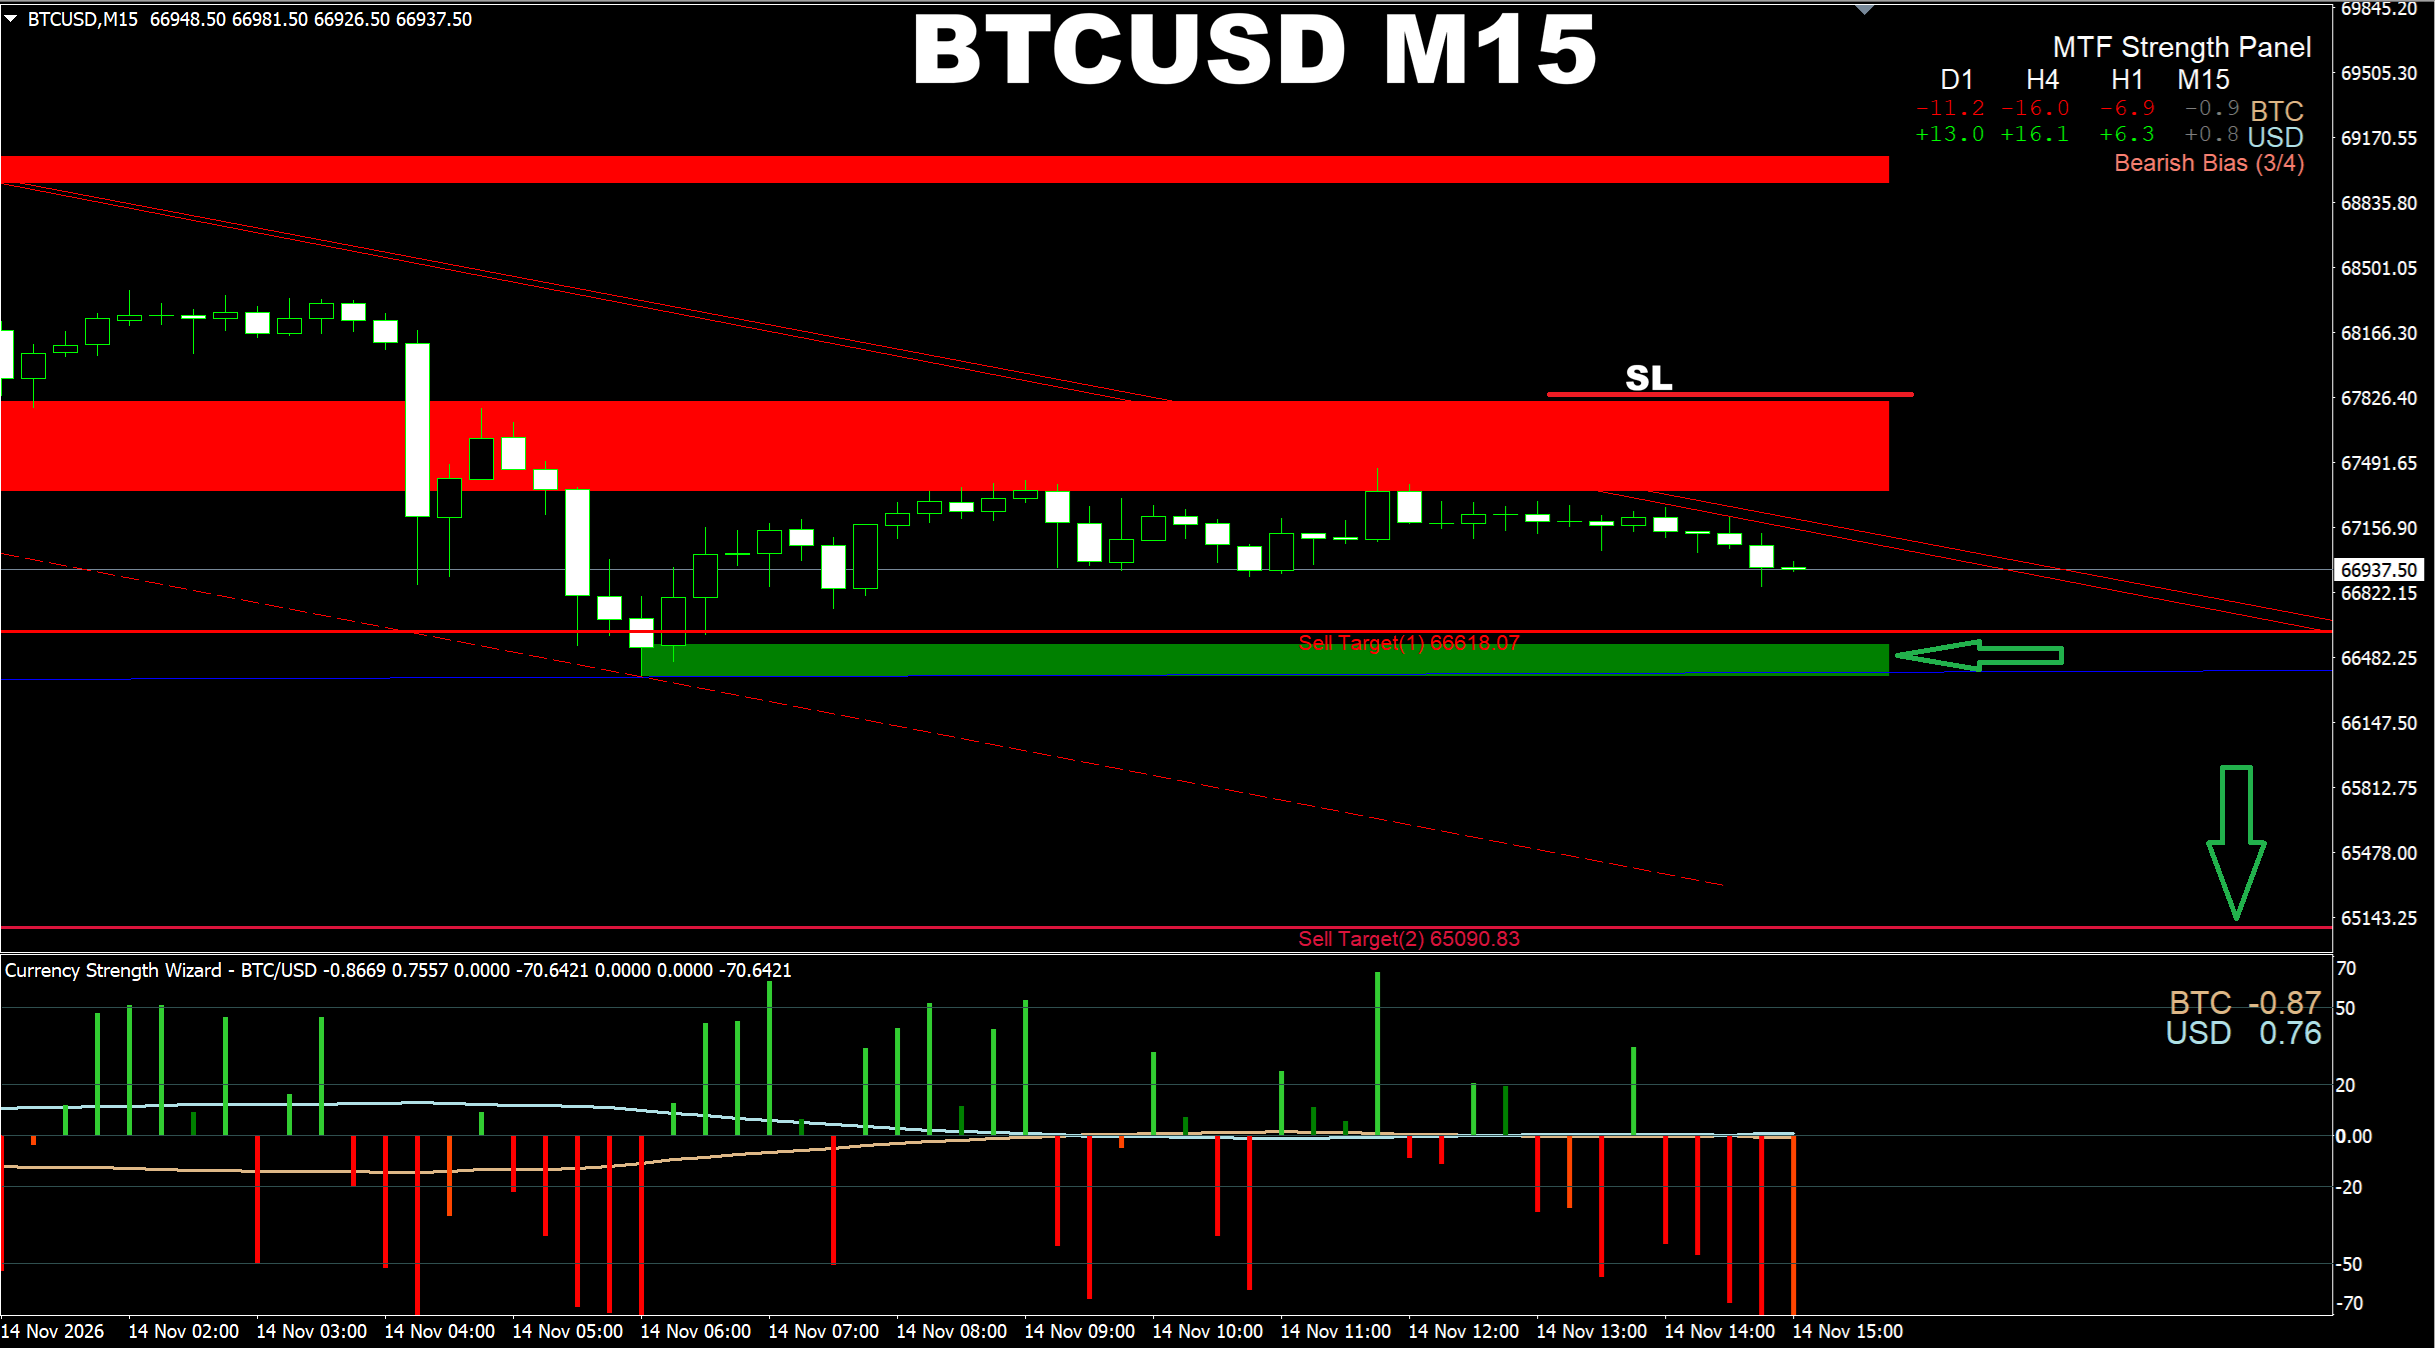
Currency Strength Wizard. BTCUSD M15. Another update on current market. If the price breaches the green Demand area down below, we can use the Sell Target 2 shown in the screenshot as the actual target.
Oleg Rodin
Oleg Rodin
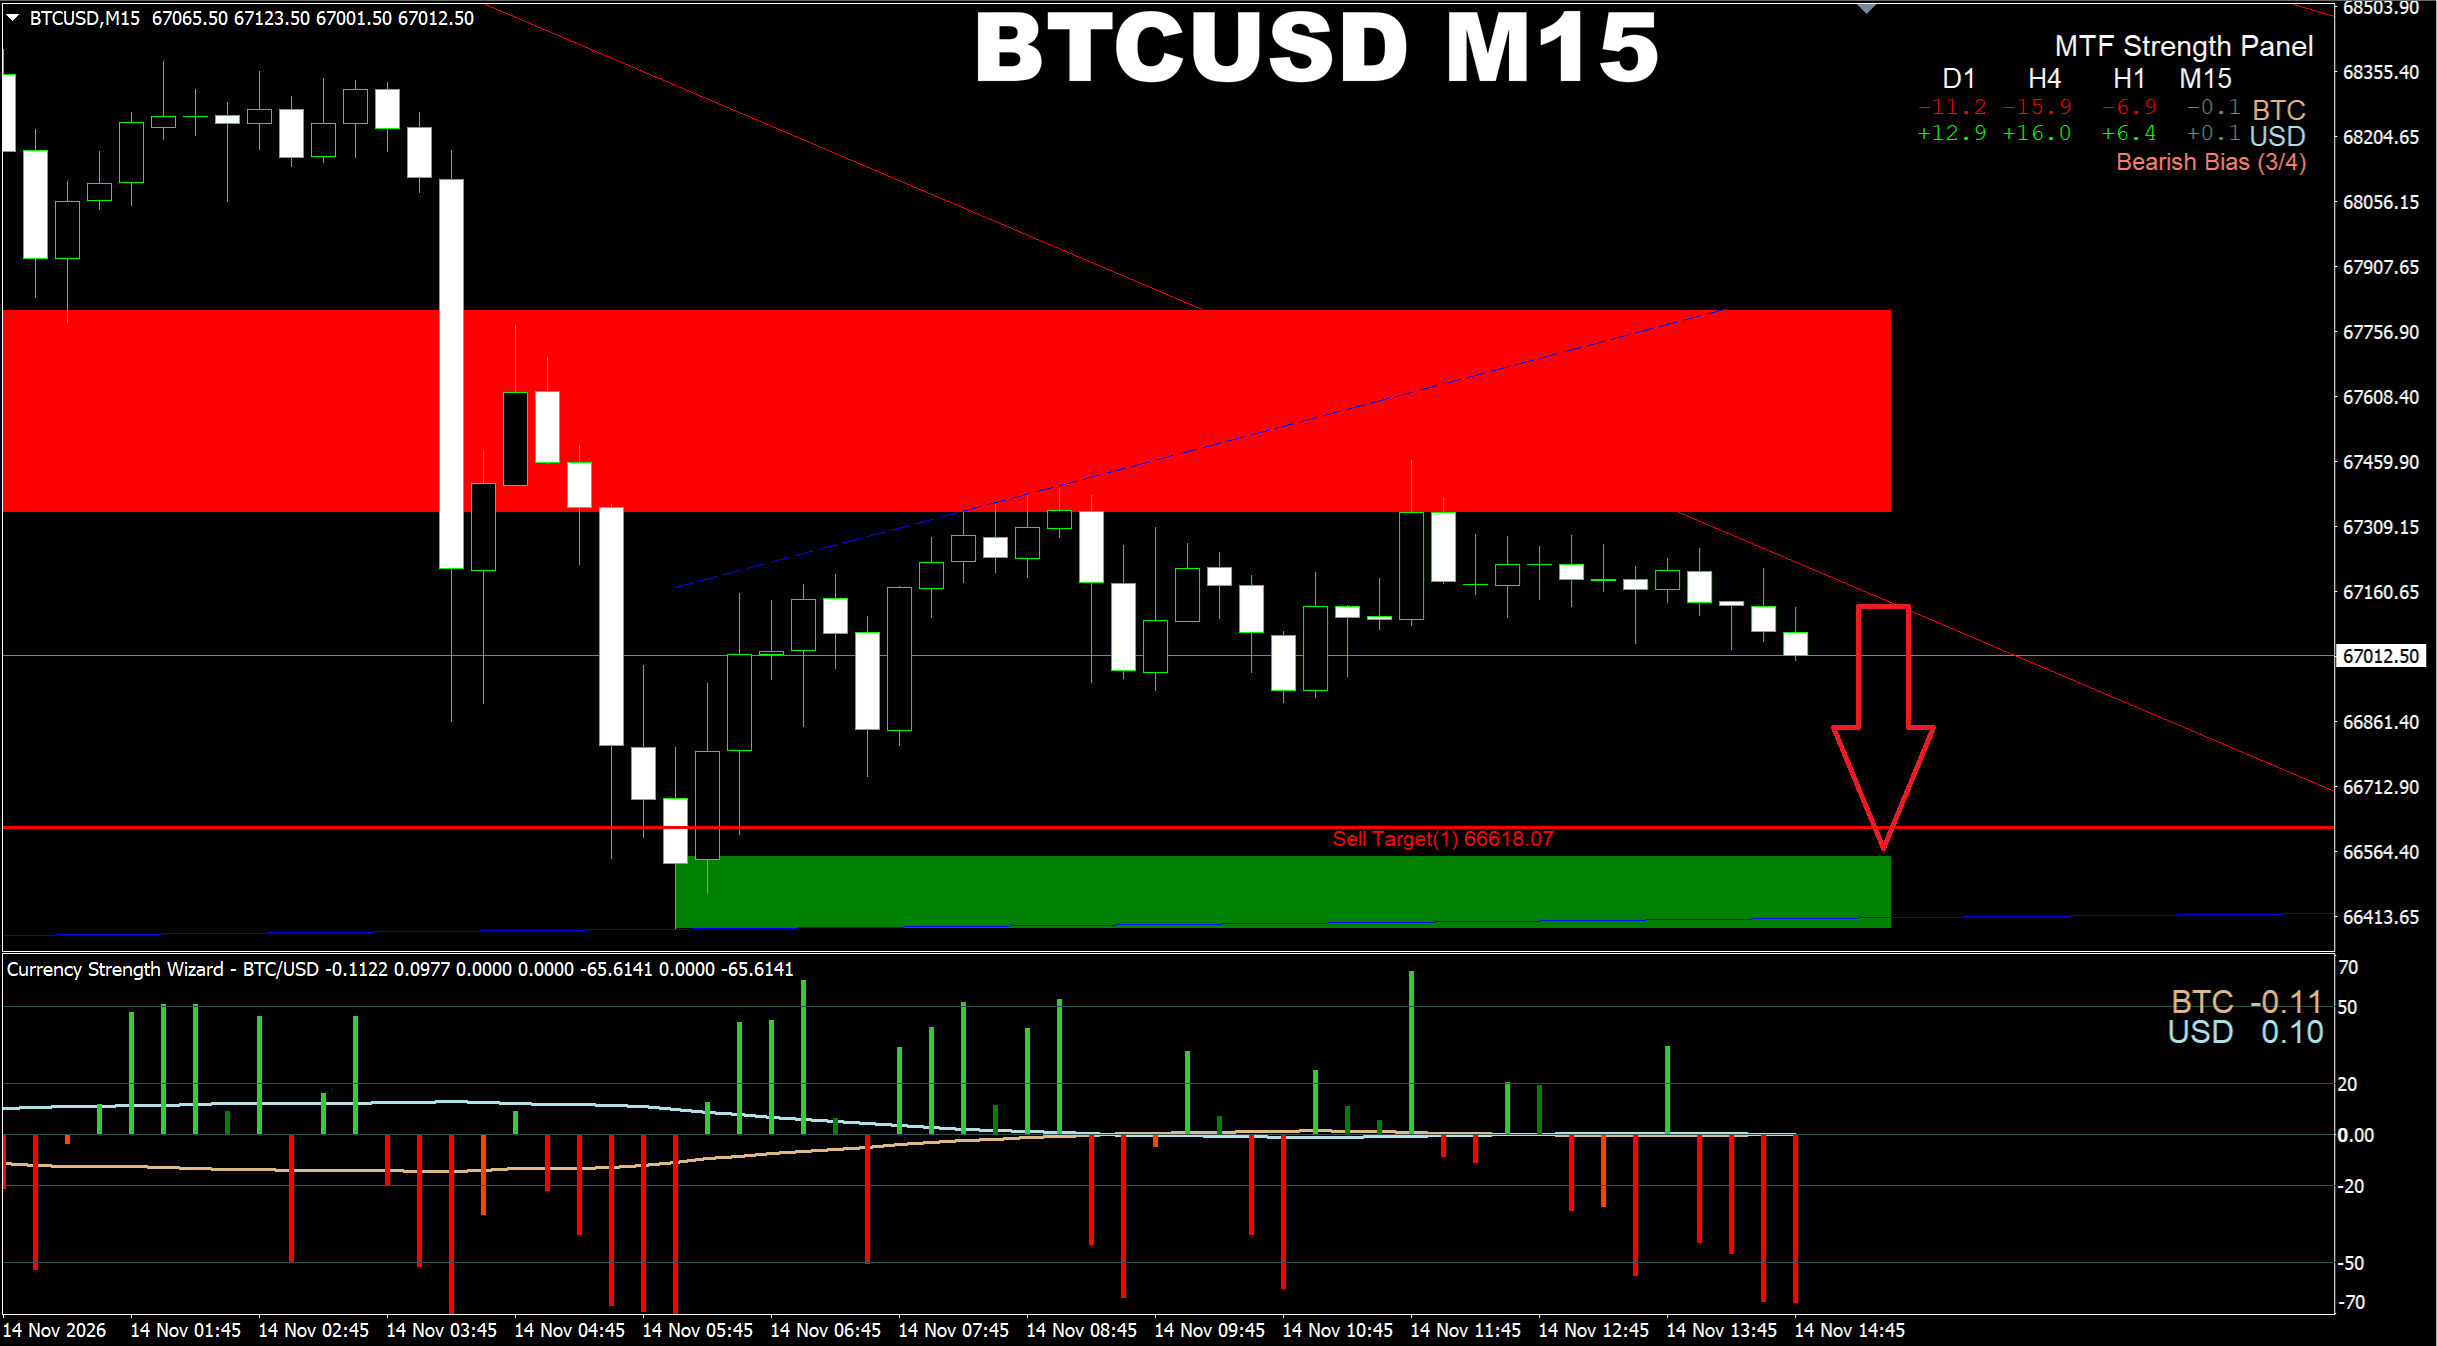
Currency Strength Wizard. BTCUSD M15. As we have a good Supply area above, it is possible to SELL now using the Demand area down below as the TP. The SL can be used at the upper border of the Supply area.
Oleg Rodin
Oleg Rodin
Currency Strength Wizard. BTCUSD H1. It seems we may see another selling wave sooner than later. Though we need to be prepared that there might be a pullback up too. I will provide more info in the next post in case you want to sell now.
Oleg Rodin
Oleg Rodin
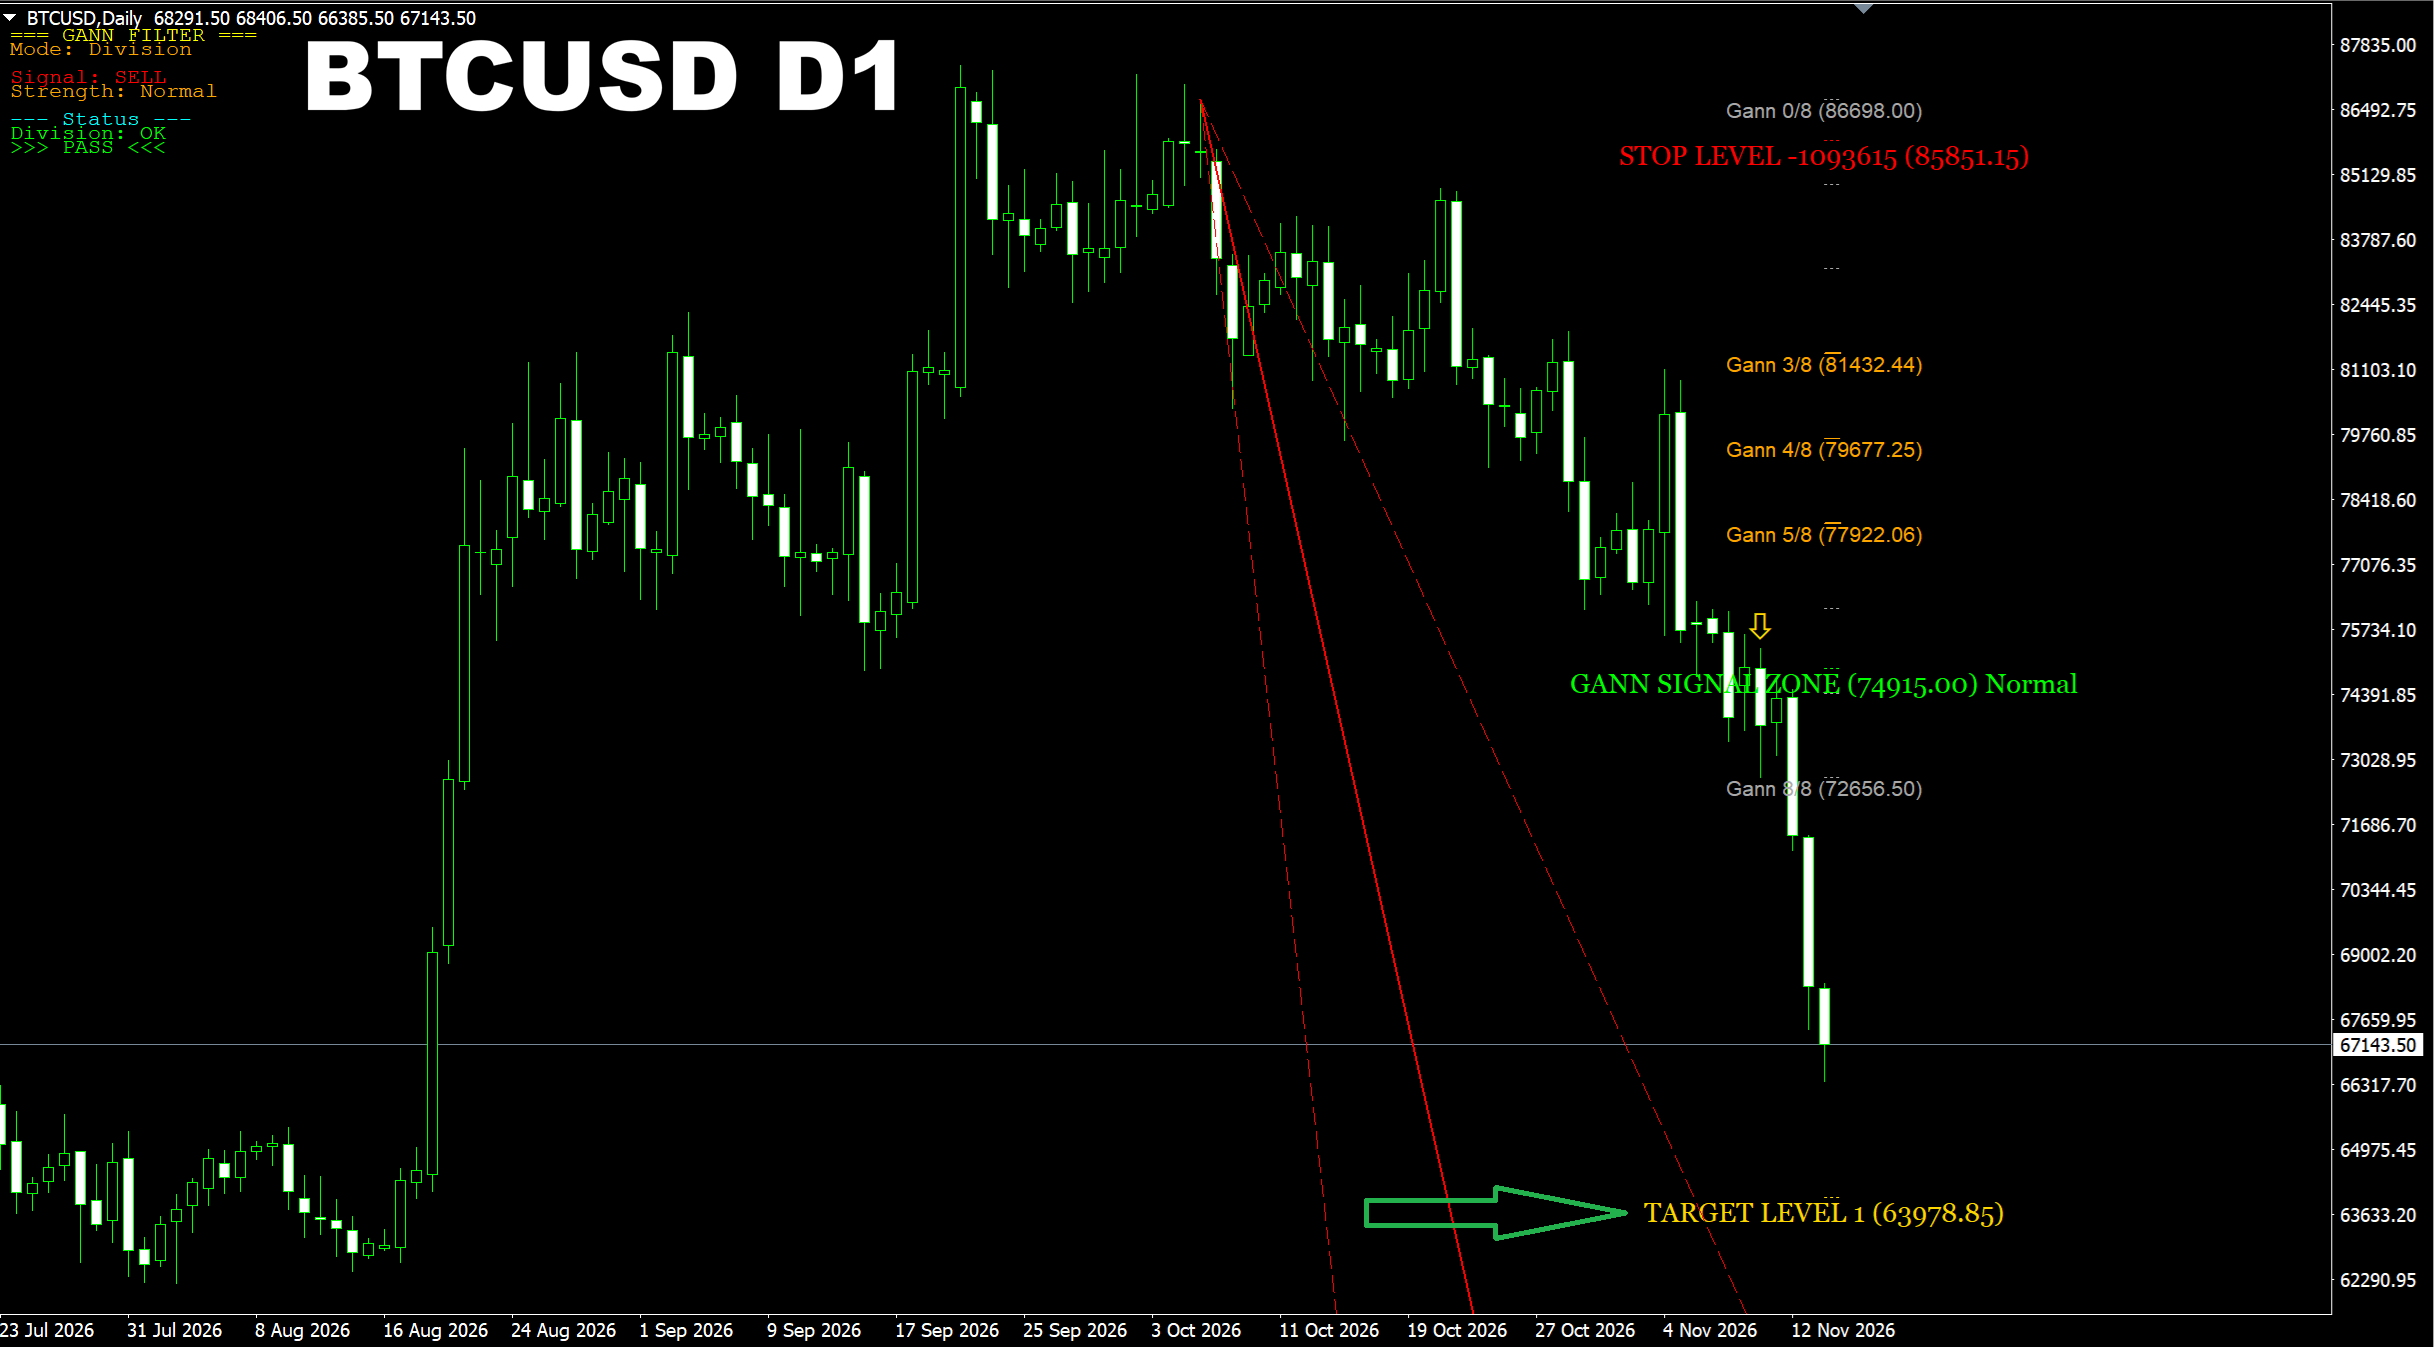
Gann Made Easy. BTCUSD D1. Update on my previous post. As you can see here we have the TP1 level at 63978 area. So this is the area the price will definitely come to. There can not be any other option here, so the price will be down there for sure. Moreover I can tell you that the Gann box's bottom border on the Weekly chart is the 62500 area. So what does it mean? It means we can easily see the price touch this area too.
Oleg Rodin
Oleg Rodin
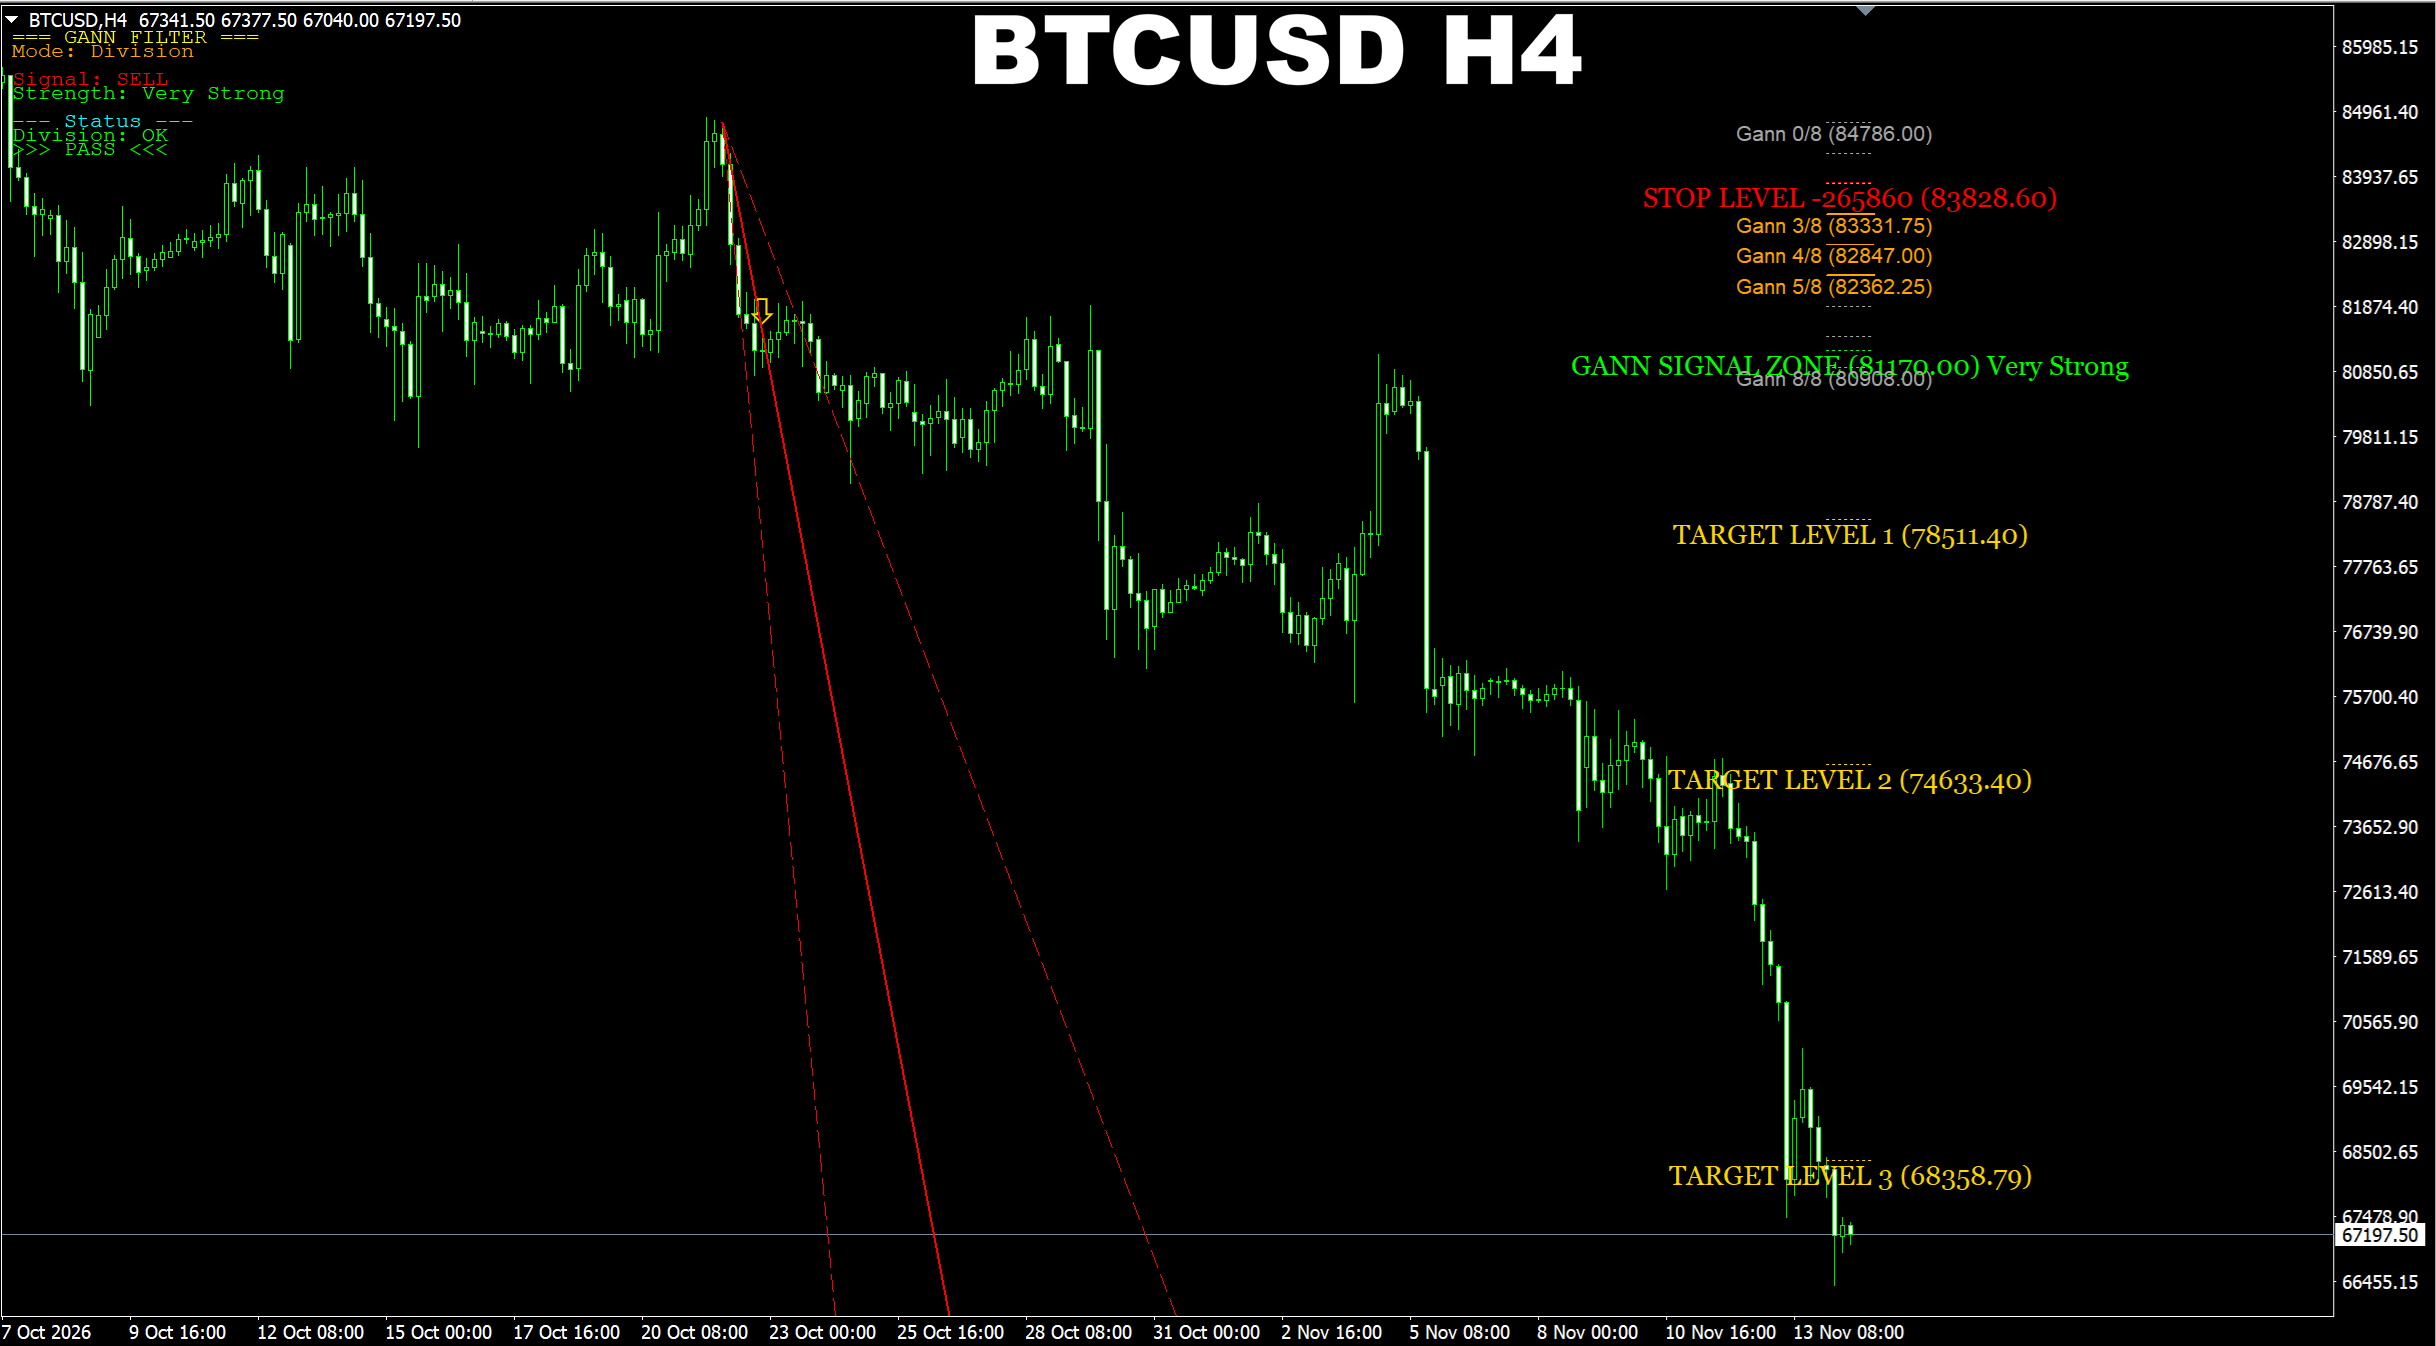
Gann Made Easy. BTCUSD H4. Current SELL signal has recently reached the final target. But the cycle is not over yet, as the D1 price wave first must enter the TP1 area there. So the global down trend will continue for a while. Of course we may see pullbacks and retracements on lower time frames but the global trend is will be down in the near future. I will show you the D1 chart in the next post.
Oleg Rodin
Oleg Rodin
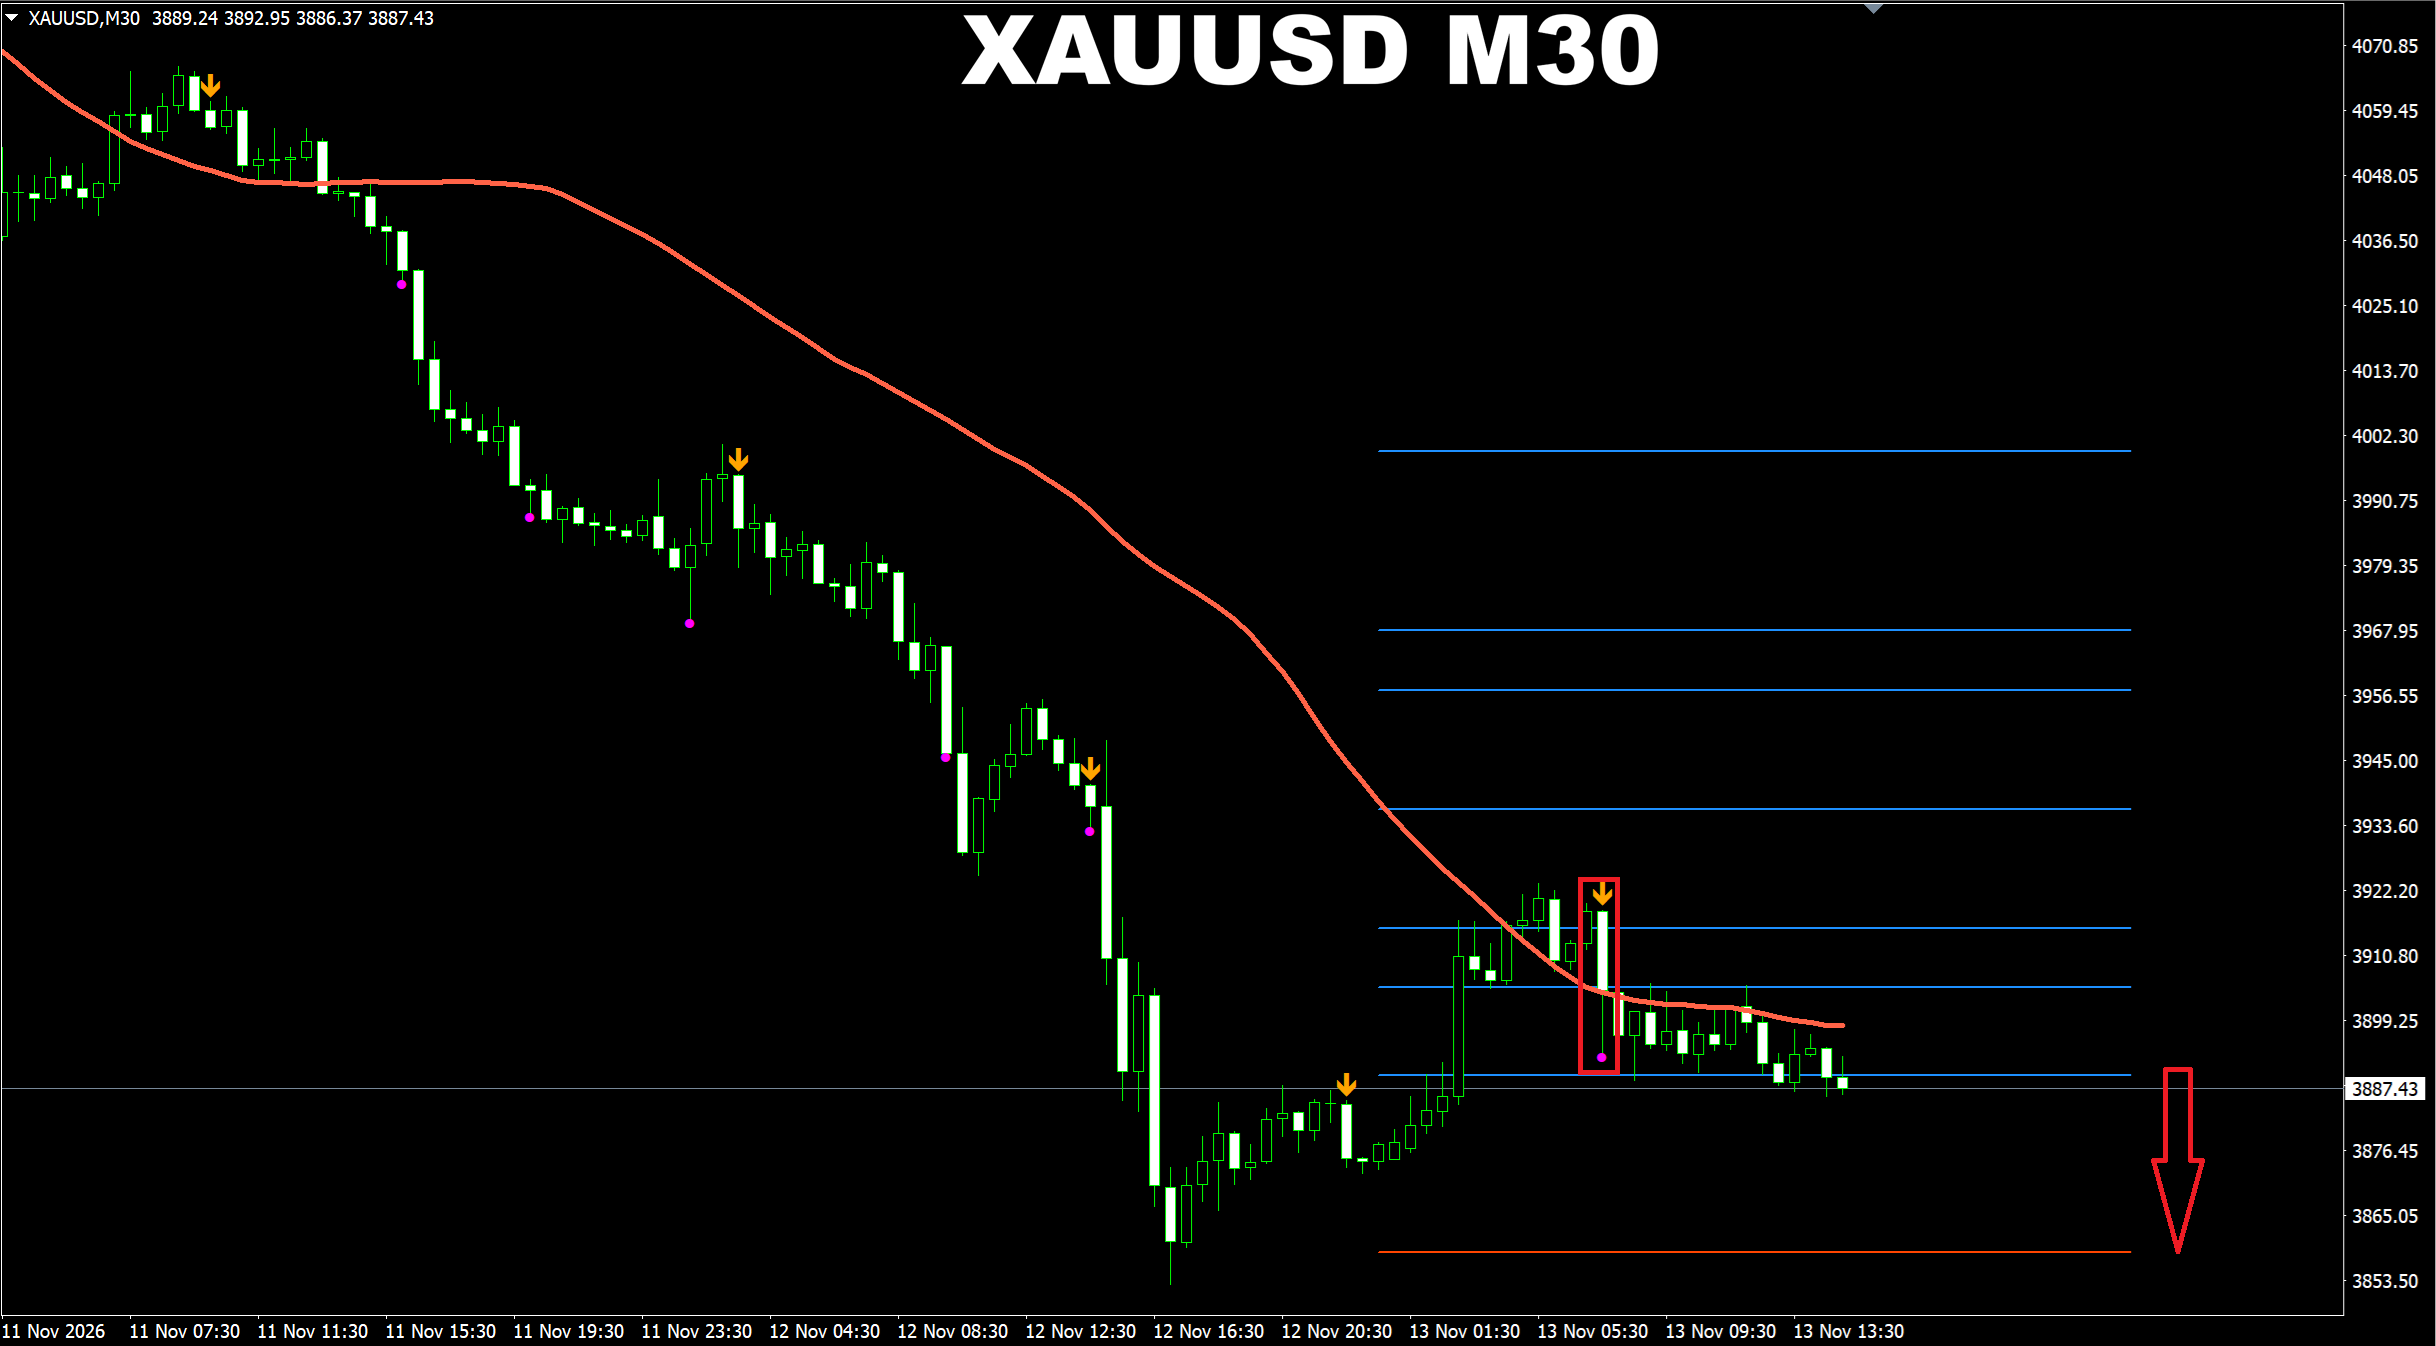
Scalper Vault. XAUUSD M30. Update on current market. We have a SELL patten here and the price which is going out of the buy zone down. What does it mean? It means a selling wave is possible now.
Oleg Rodin
Oleg Rodin
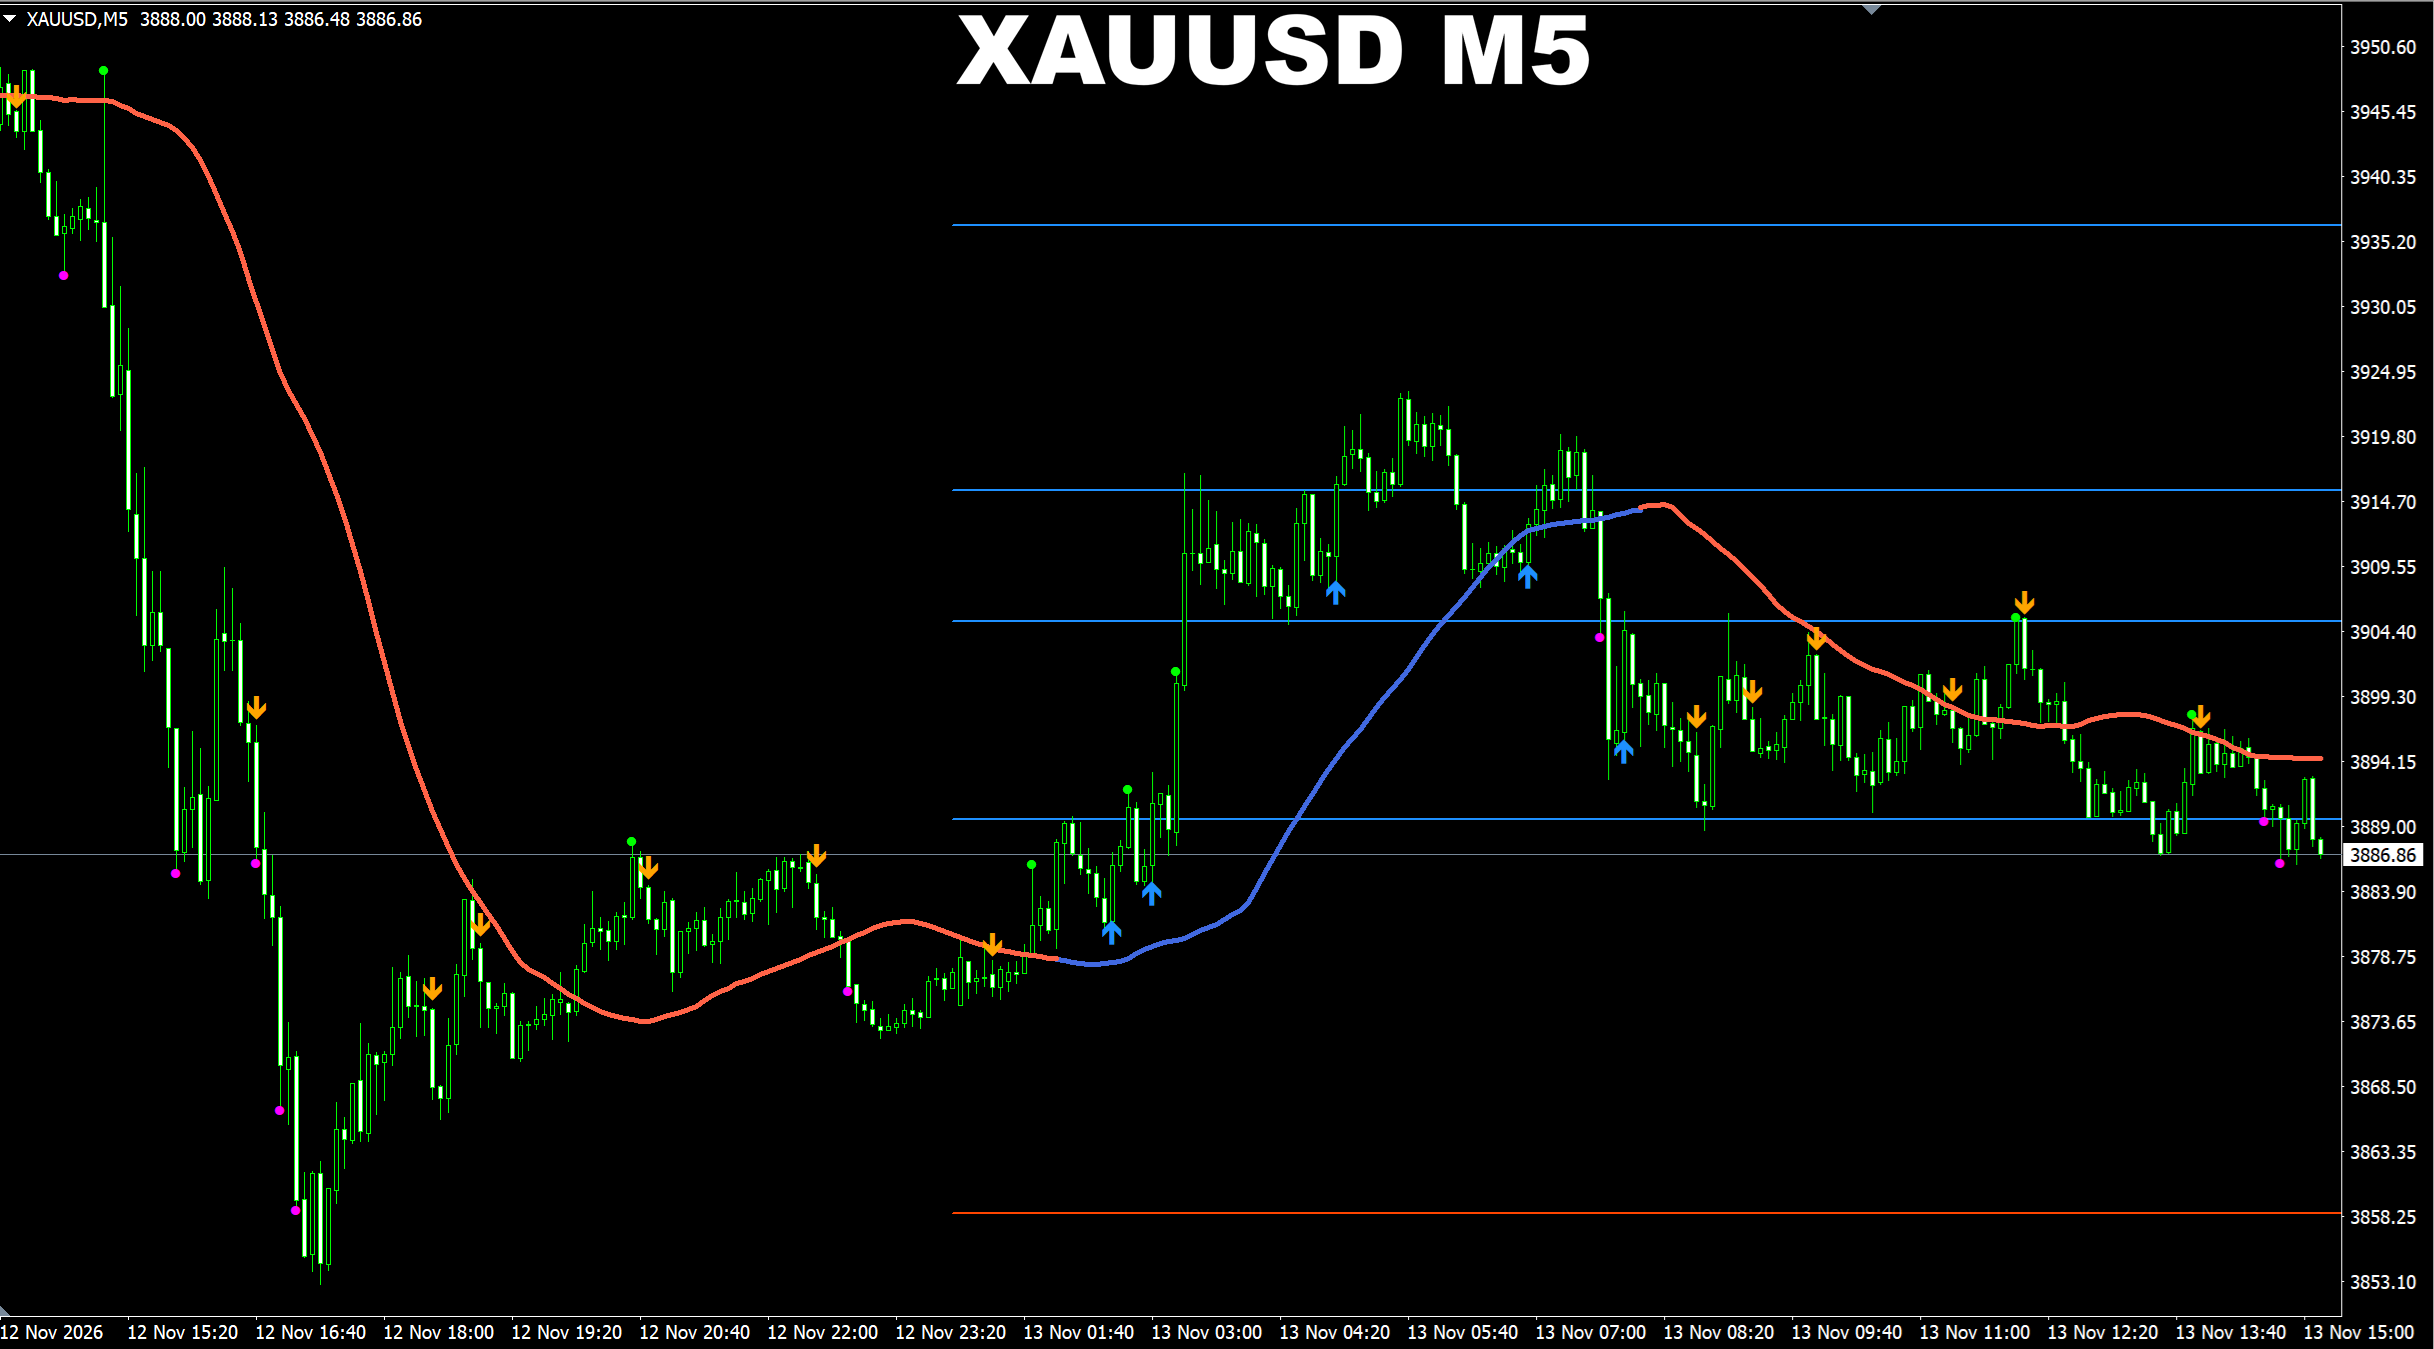
Scalper Vault. XAUUSD M5. Default settings. Recent signals performance.
Oleg Rodin
Oleg Rodin
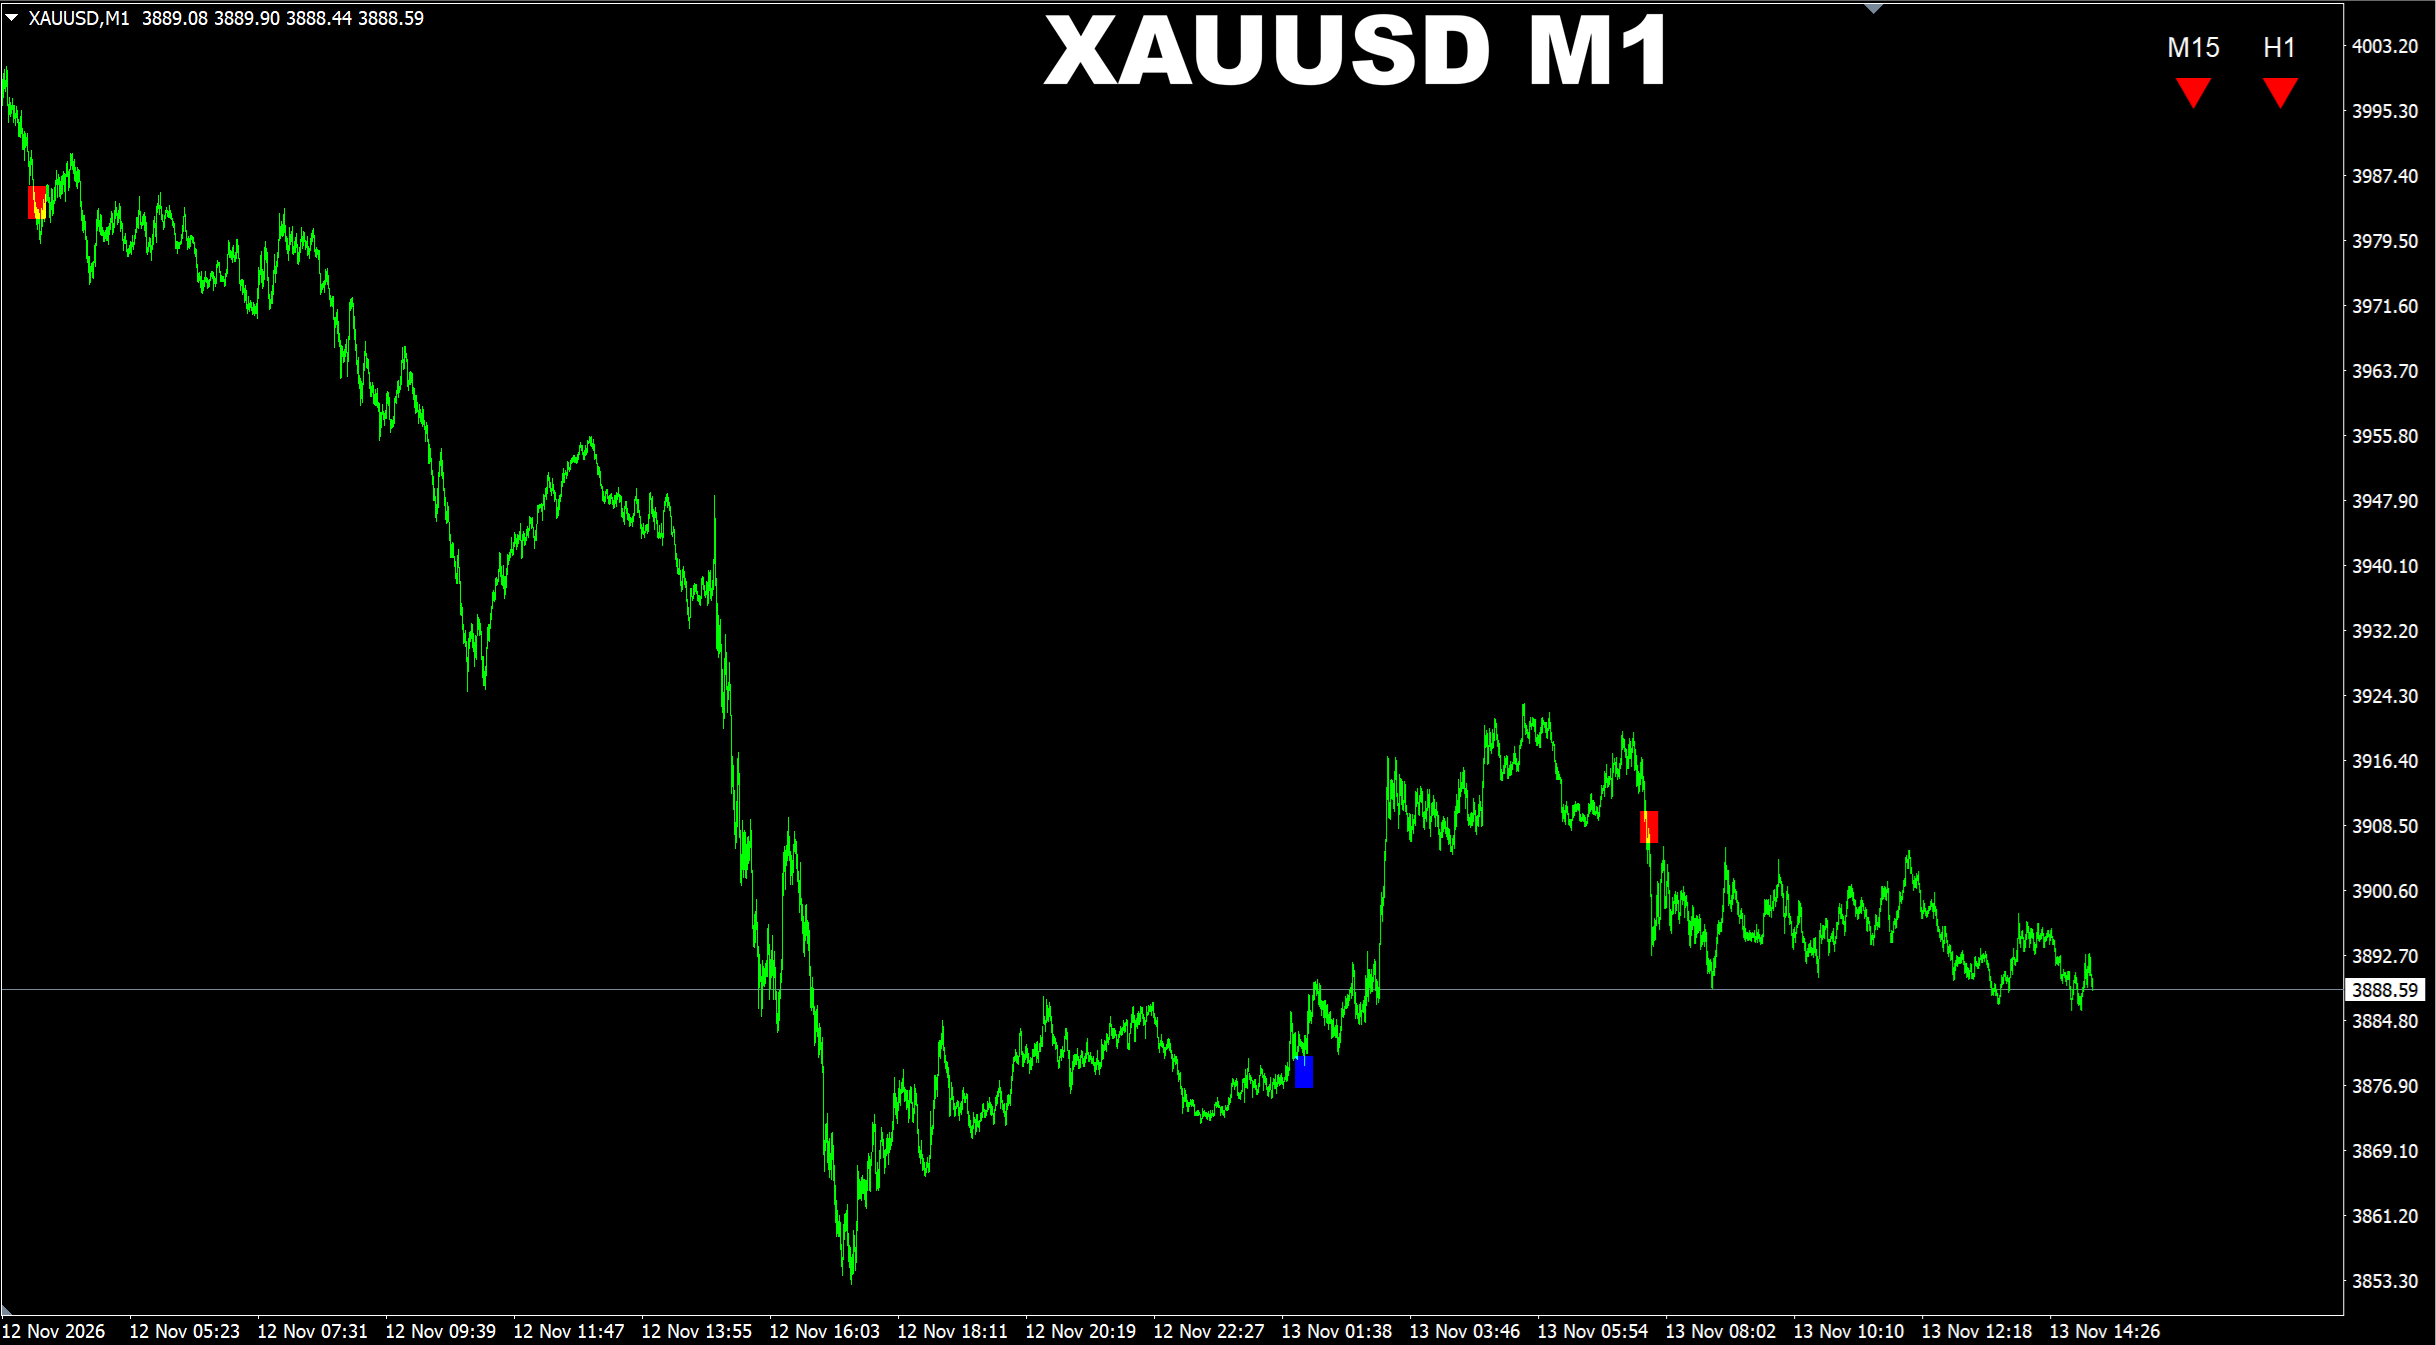
SR Liquidity. XAUUSD M1. Default settings. Recent signals performance.
Oleg Rodin
Oleg Rodin
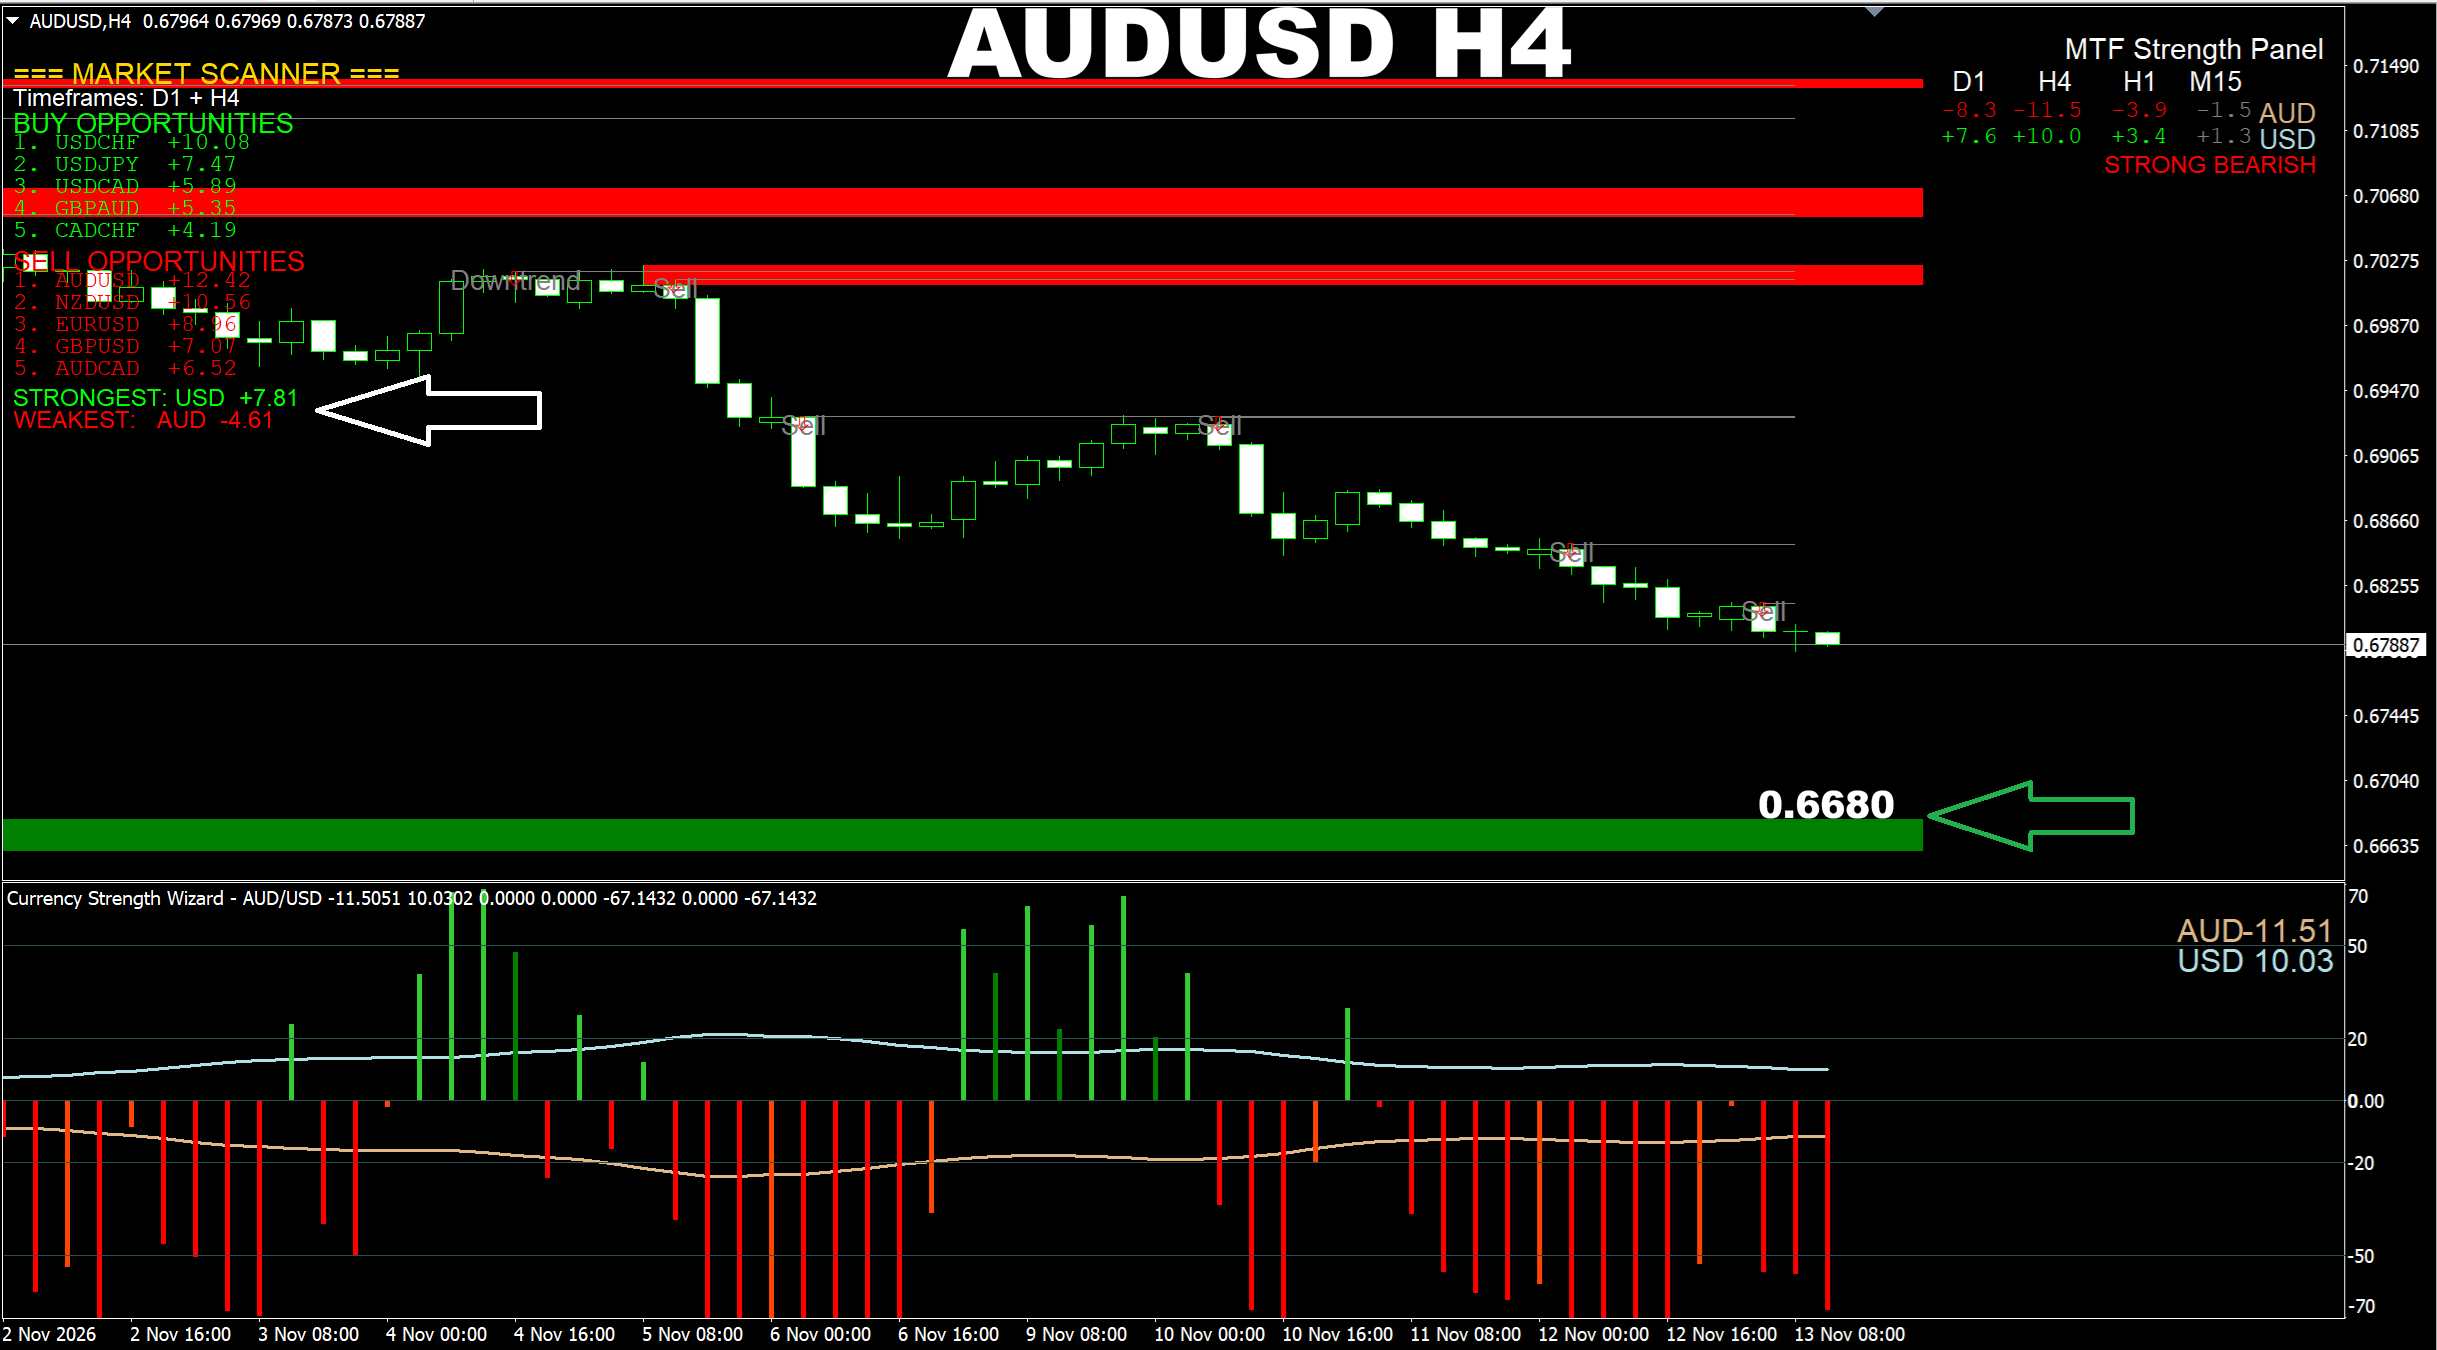
Currency Strength Wizard. AUDUSD H4. Update on the area the price is heading to. Here based on this screenshot I want to tell you a bit about the Market Scanner. This is actually a feature of the Currency Strength Wizard indicator which can be activated in the input parameters as well as some other features which are off by default. So the Market Scanner scans the strength of currencies based on the time frames you specify in the settings. For example in this screenshot we can see I used the D1 + H4 TF combo as I find this useful when I want to predict where the price is actually heading to. As you can see the indicator is showing now that the AUD is the weakest currency. The Scanner shows you top 5 BUY and SELL opportunities. So what does it mean? It is not a list of just random pairs. No. Instead it chooses the best pairs out of all to show you the top pairs in terms of strength which we can sell or buy. So instead of just telling you which is the strongest or the weakest, it also shows you other possible pairs for trading which can be used based on current market conditions. And the thing is you can adjust the Scanner's "sensitivity" by choosing the time frames it works with so you can deal with bigger or short-term waves depending on your trading needs and preferences. As a result you always know what pairs to trade. Moreover the Scanner can take into consideration not only currencies but also Gold and Silver and BTCUSD. The indicator itself can work not only with forex currencies but also with any cryptos, metals and CFDs. Though the Scanner supports all forex currencies, Gold and Silver and BTCUSD for now.