Oleg Rodin
Oleg Rodin
4.8 (527)
  • Information
12+ years
experience
53
products
541
demo versions
0
jobs
0
signals
0
subscribers
Hello!

I've been a trader and trading software developer for more than 15 years already. Here I do my best to share my experience with other traders providing them with high-quality trading tools which can be used for trading different markets.

My goal is to help traders get success in trading no matter what level of experience they currently have.

I truly believe with my support and trading tools every trader can become better in forex trading.

I wish you great success and good luck in trading!
Oleg Rodin
Oleg Rodin
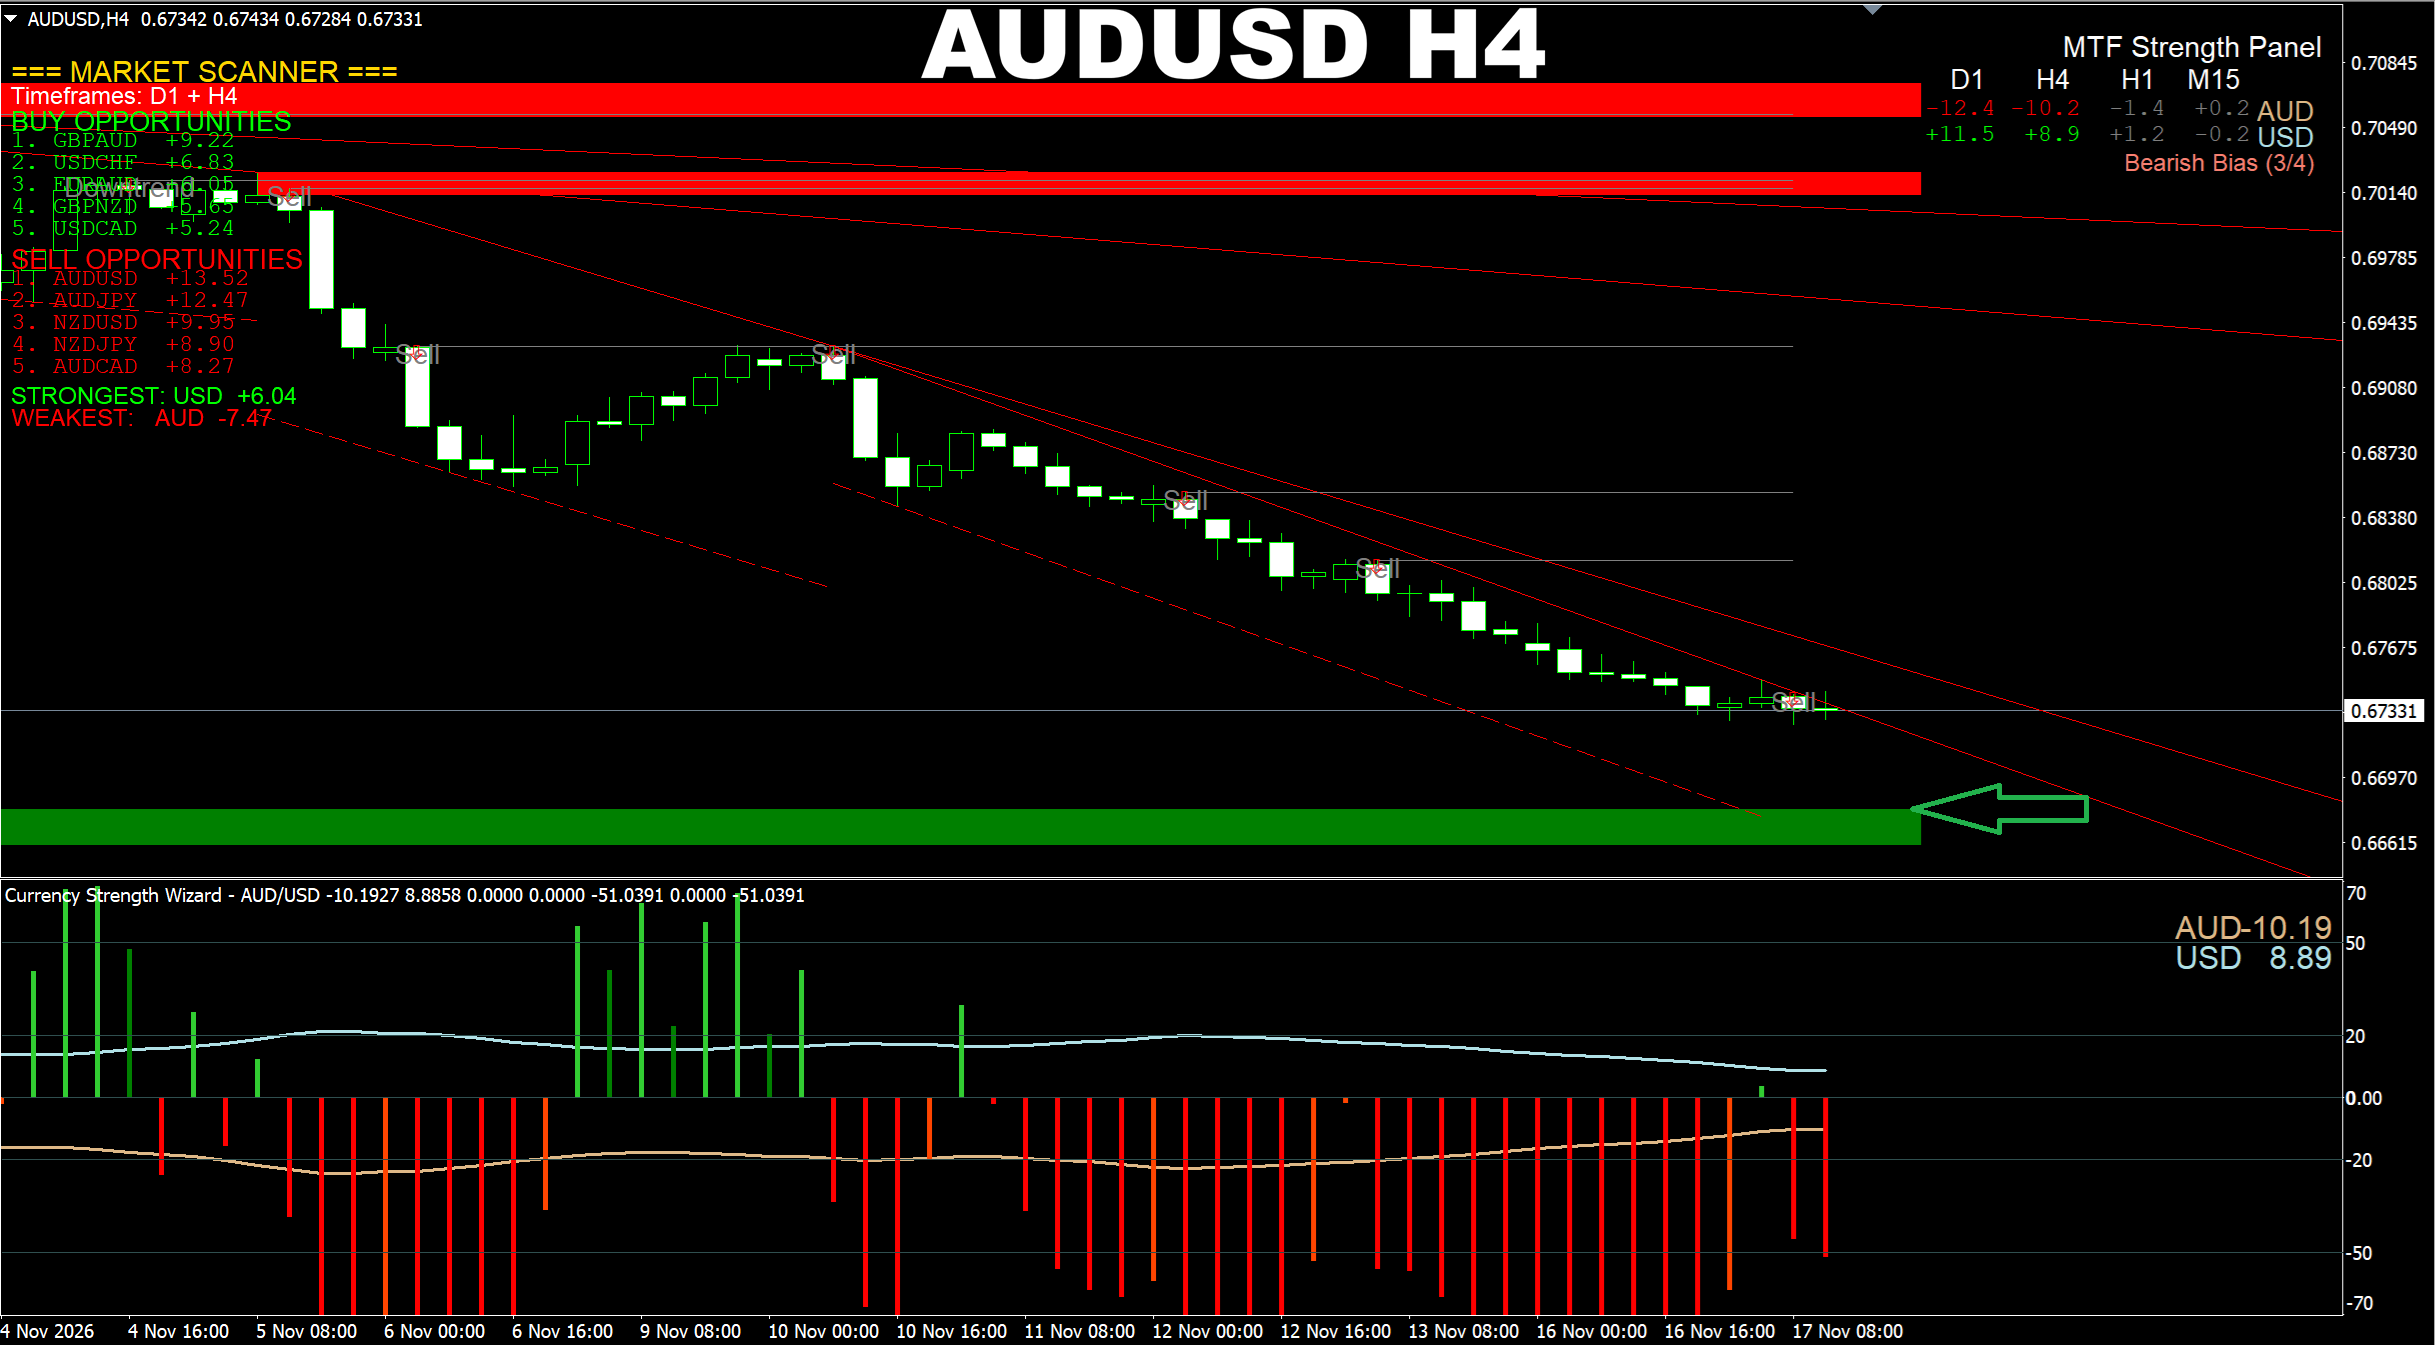
Currency Strength Wizard. AUDUSD H4. Update on current market. This pair is going down non-stop. The Demand area down below is the next area it is heading to. But eventually it should come to the area I mentioned before based on the Gann Made Easy indicator. You will find this in my previous posts.
Oleg Rodin
Oleg Rodin
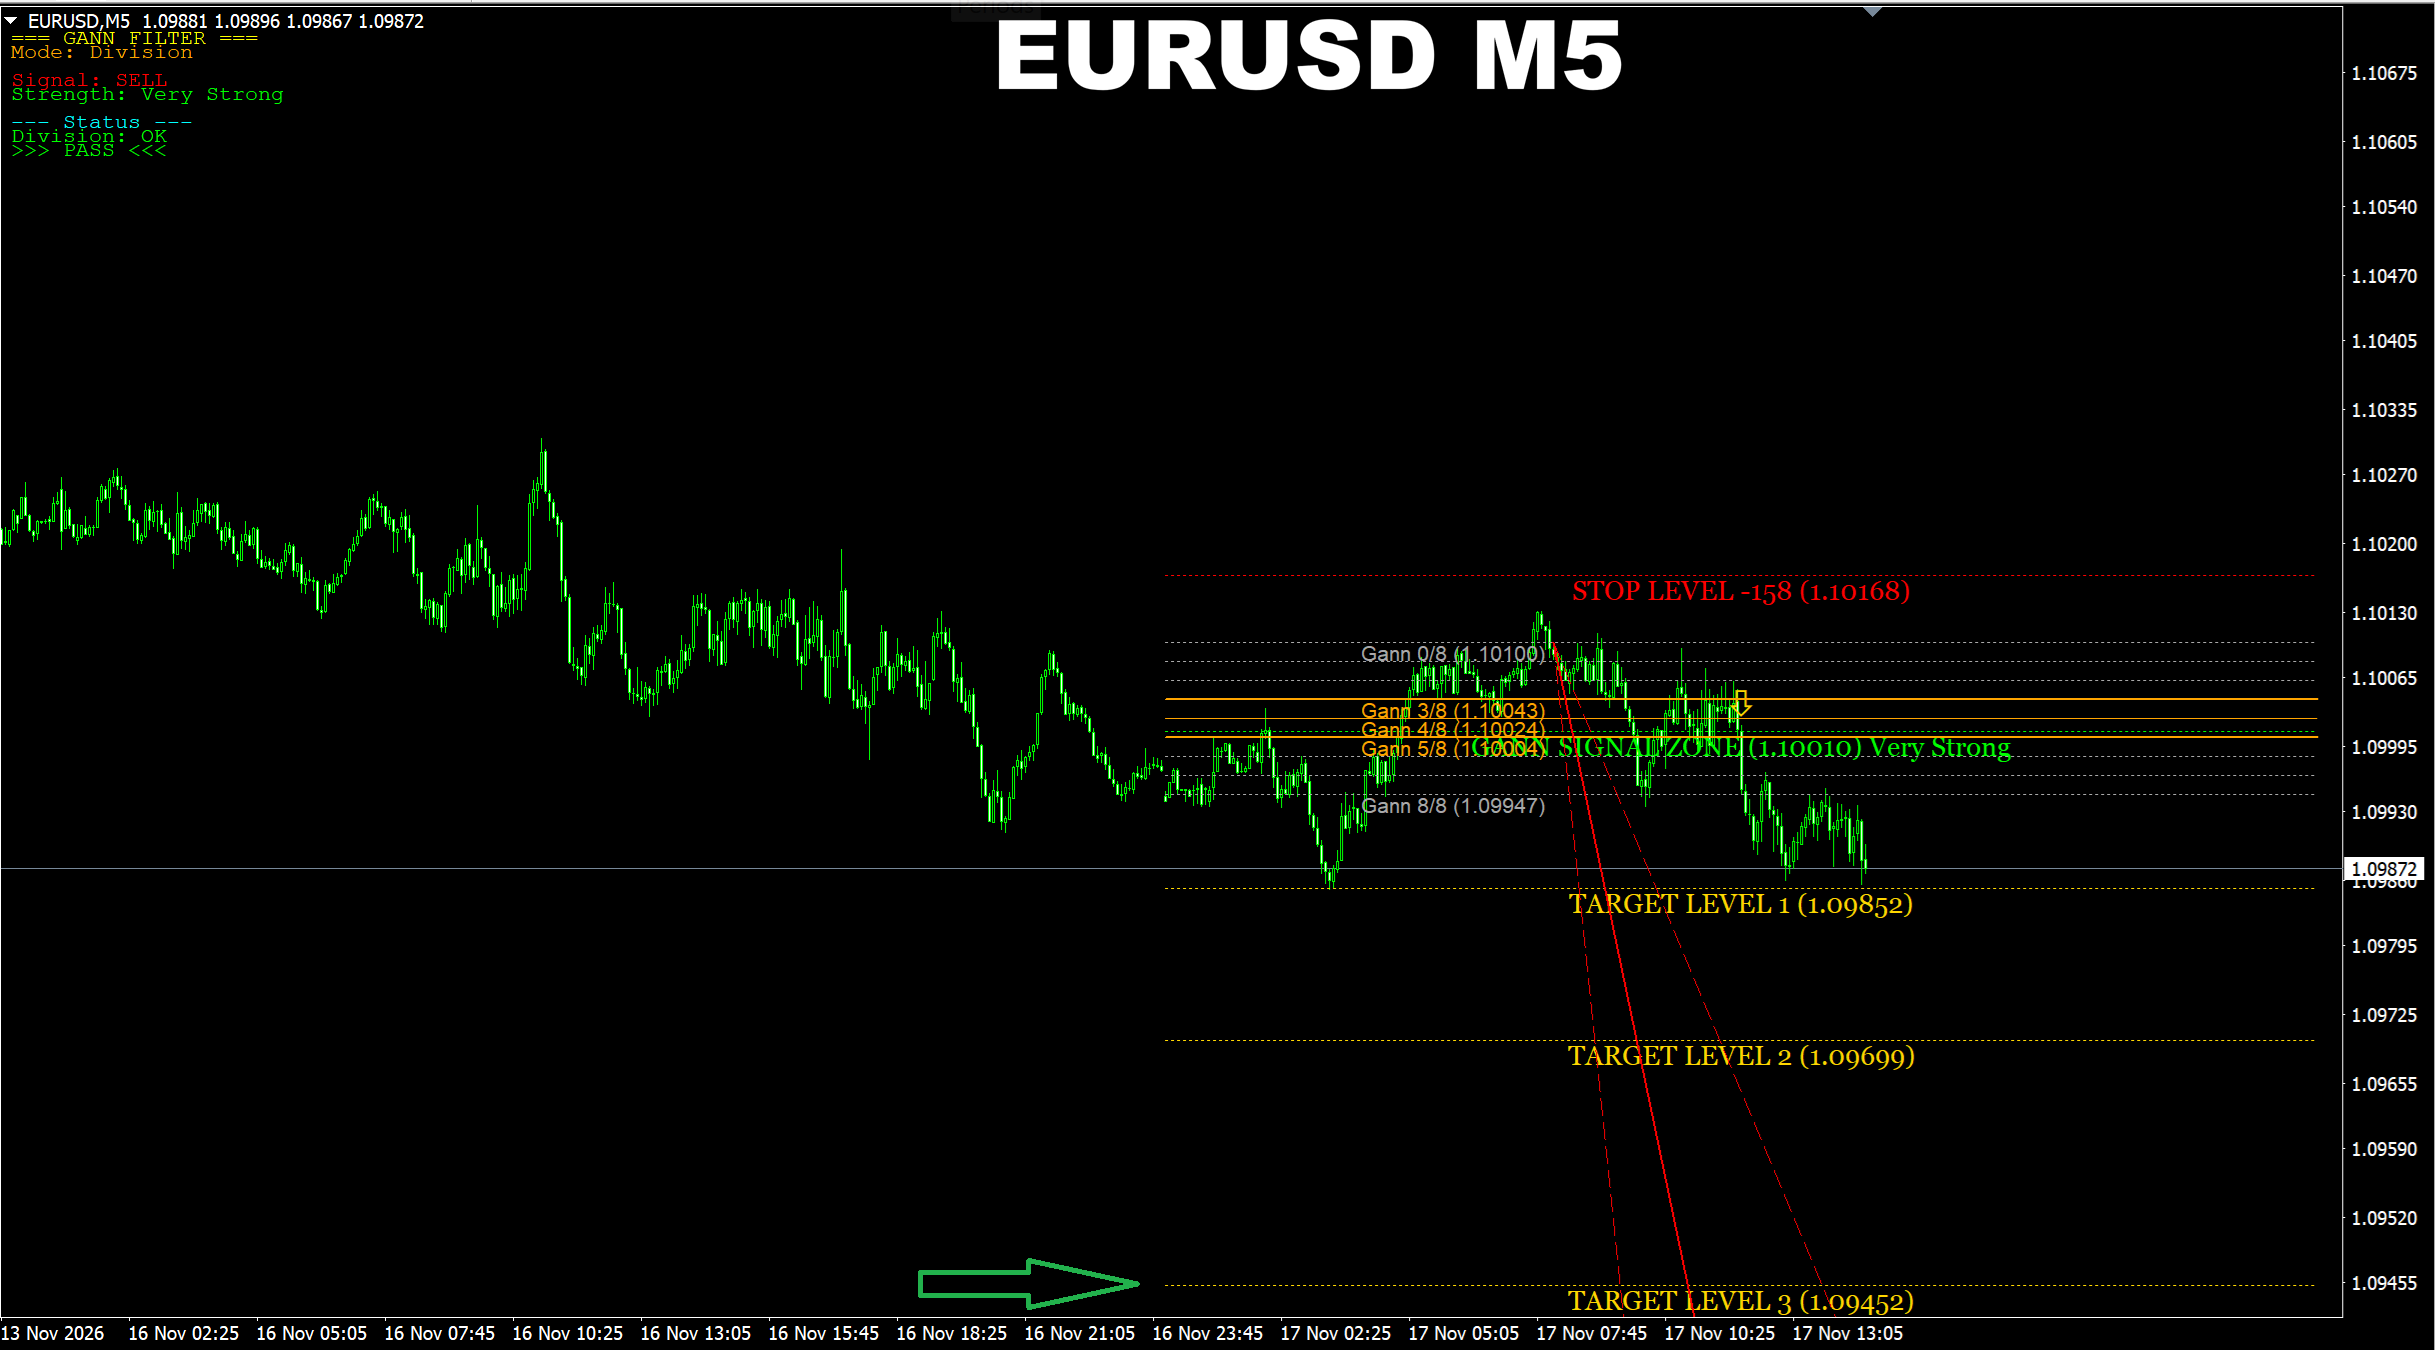
Gann Made Easy. EURUSD M5. Update on current market. We may see a new selling wave soon which will bring the price down to the 1.0945 area.
Oleg Rodin
Oleg Rodin
M1 Sniper. EURUSD M5. Default settings. Recent signals performance.
Oleg Rodin
Oleg Rodin
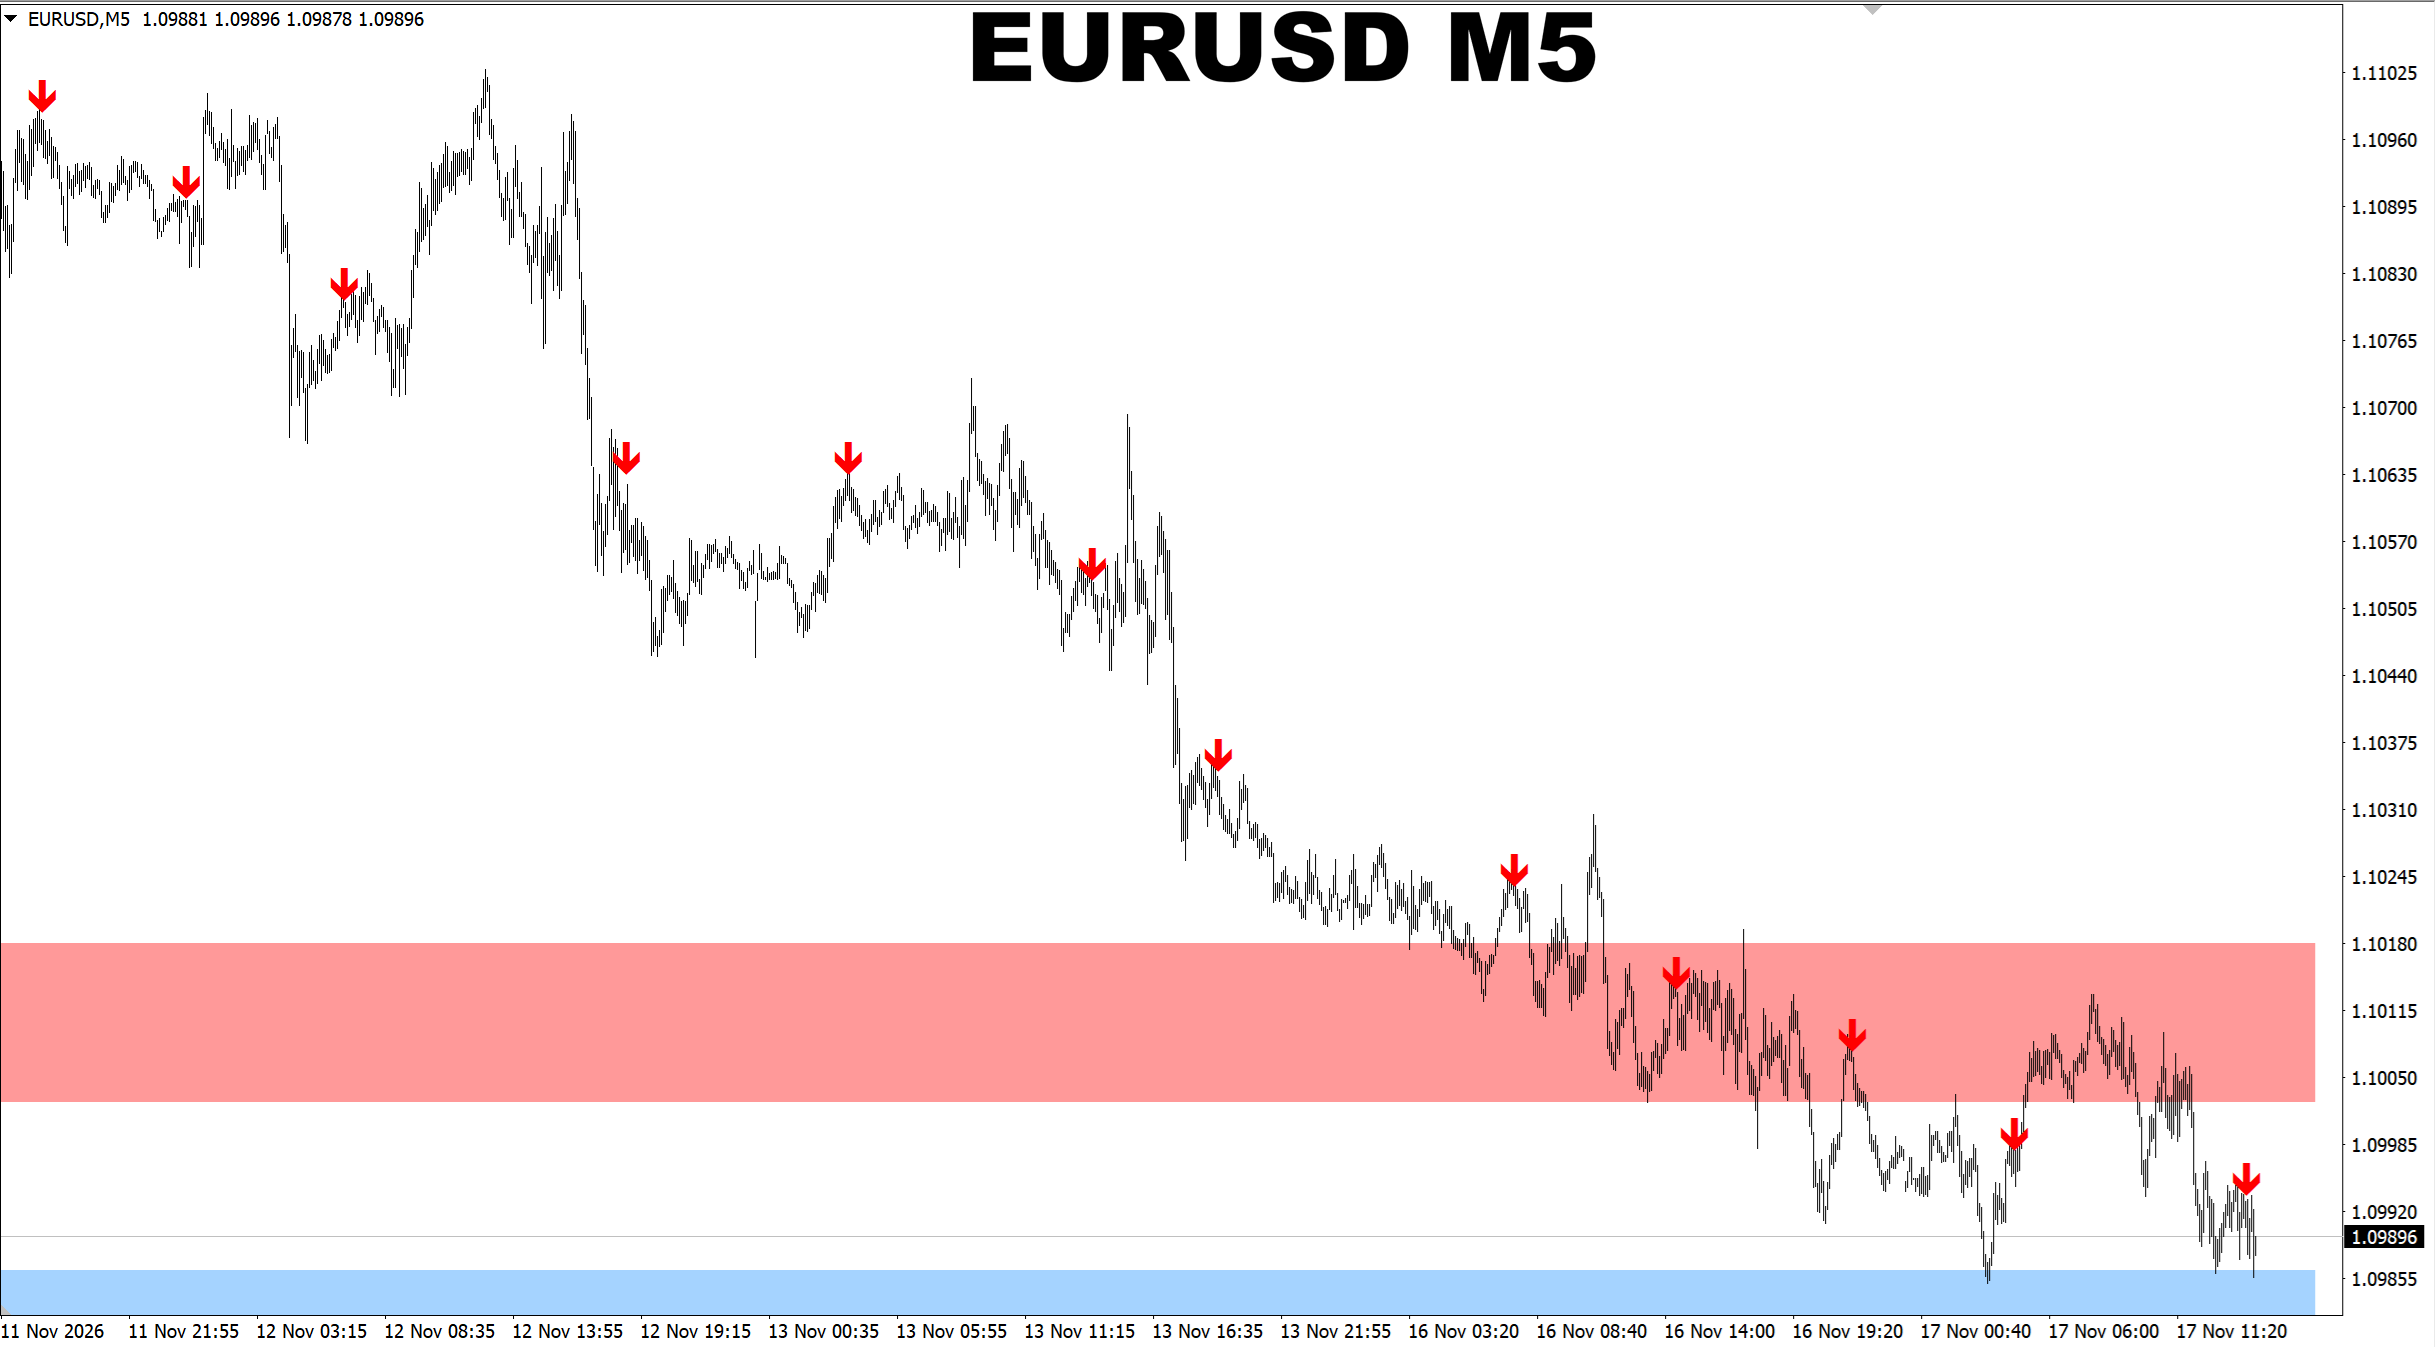
SR Liquidity. EURUSD M5. Default settings. Update on recent signals.
Oleg Rodin
Oleg Rodin
Gann Made Easy. USDCAD M30. Update on current market.
Oleg Rodin
Oleg Rodin
Gann Made Easy. XAUUSD H1. Update on current market based on the H1 TF.
Oleg Rodin
Oleg Rodin
Gann Made Easy. XAUUSD H4. Update on current market. The more the price stays under the Gann 8/8 area, the higher the chance is we will see a new selling wave down to 3700.
Oleg Rodin
Oleg Rodin
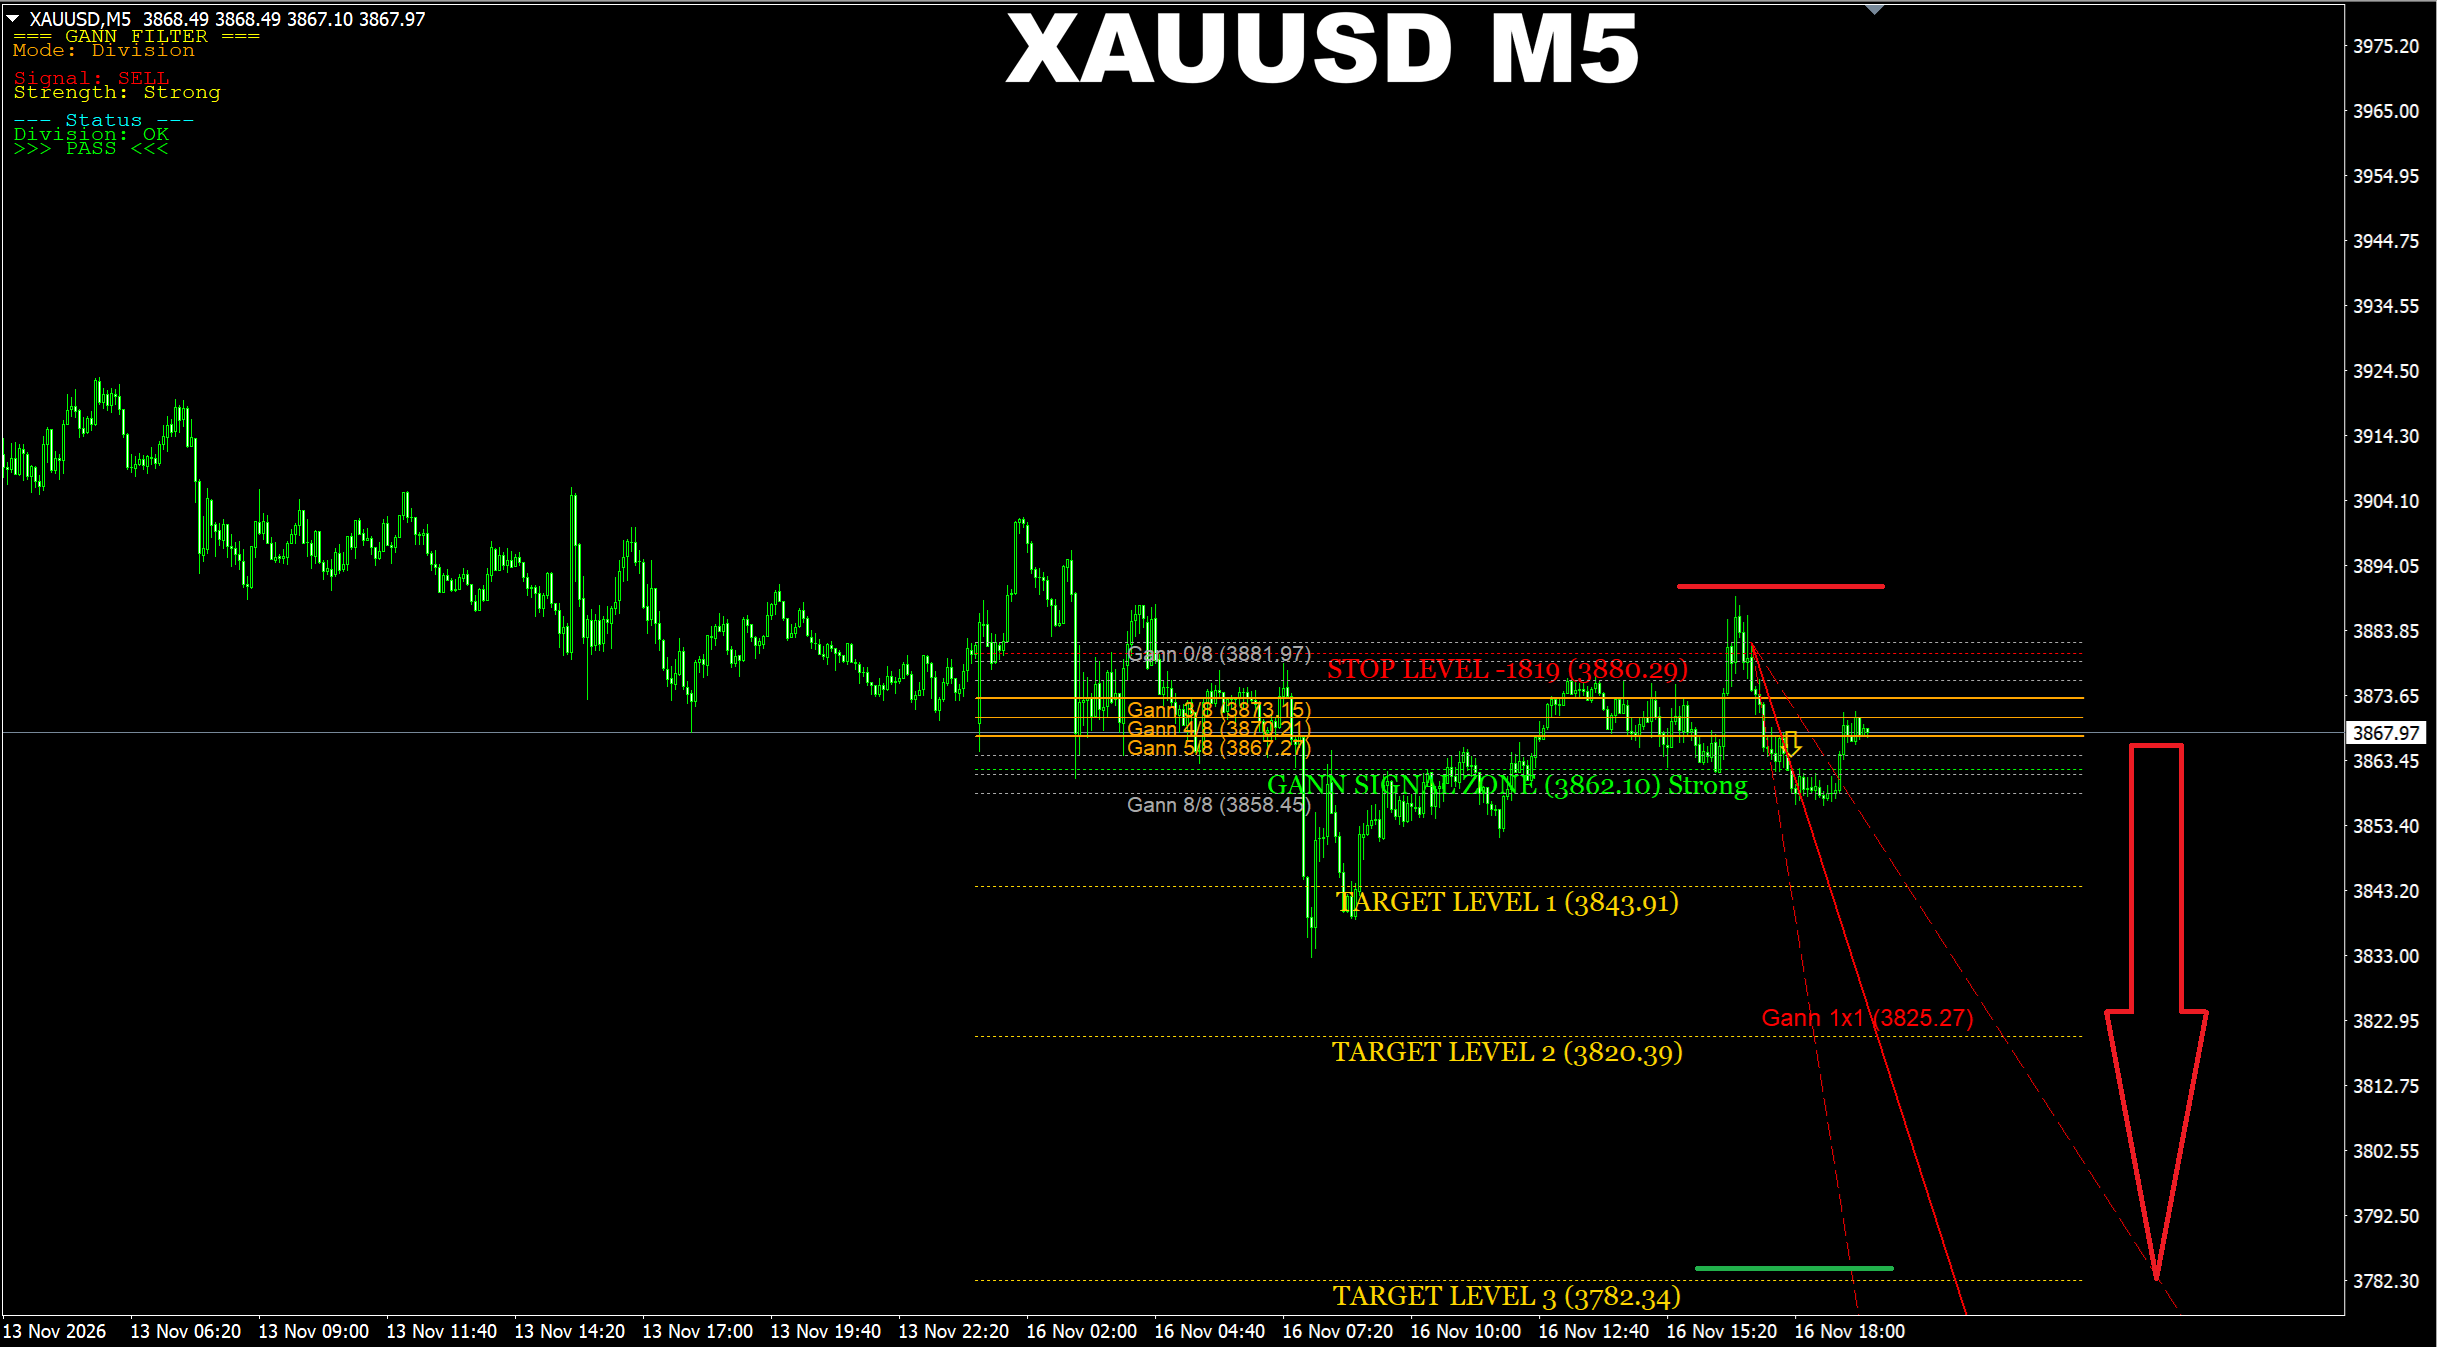
Gann Made Easy. XAUUSD M5. Those who are not afraid of getting the SL hit, they may try selling using a good target. The SL is pretty small in this case. Usually if there are signs of the price to continue moving in this or that direction it terms of the global trend, we can make a couple attempts to catch this wave as early as possible. Of course, such signals are riskier but sometimes they bring very good profit.
Oleg Rodin
Oleg Rodin
Currency Strength Wizard. XAUUSD D1. Update on current market. Sometimes, when I look at my charts, I do not believe this or that price move is possible. But the charts do not care if I believe or not. So what does this chart tell us? Actually it tells that the price may have another sell breakout and continue going down toward the next global target which is the area of 3650. It does not mean this will happen now as we are talking about the Daily chart. But the chart says it may be sooner than later.
Oleg Rodin
Oleg Rodin
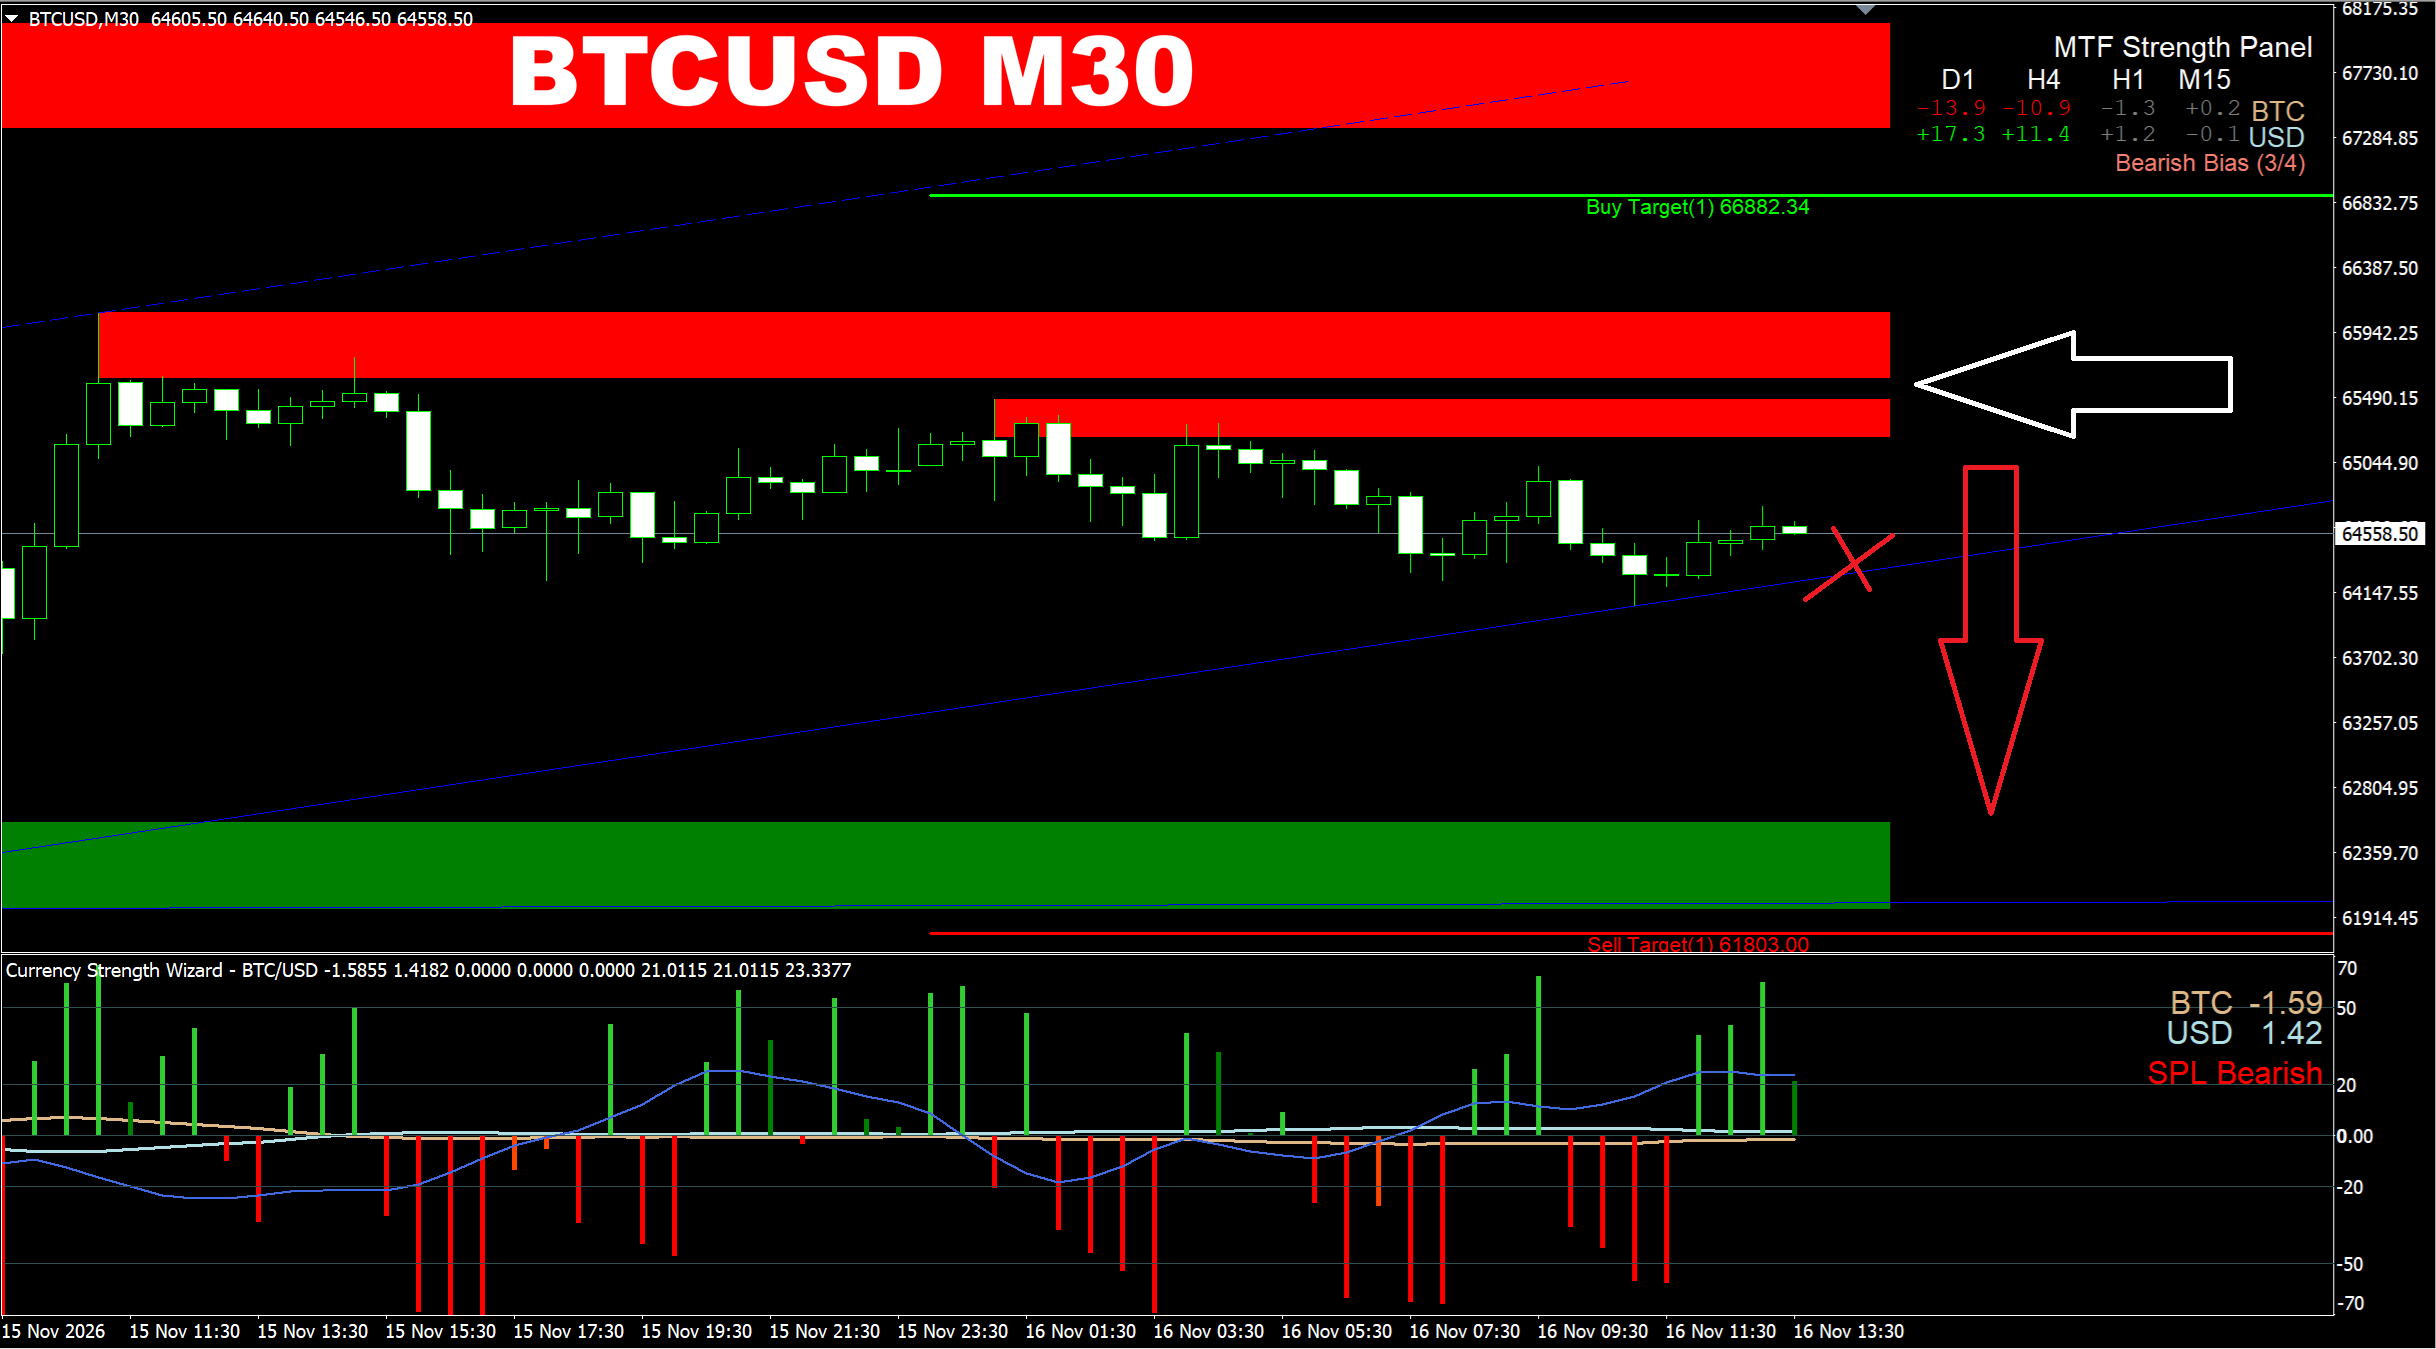
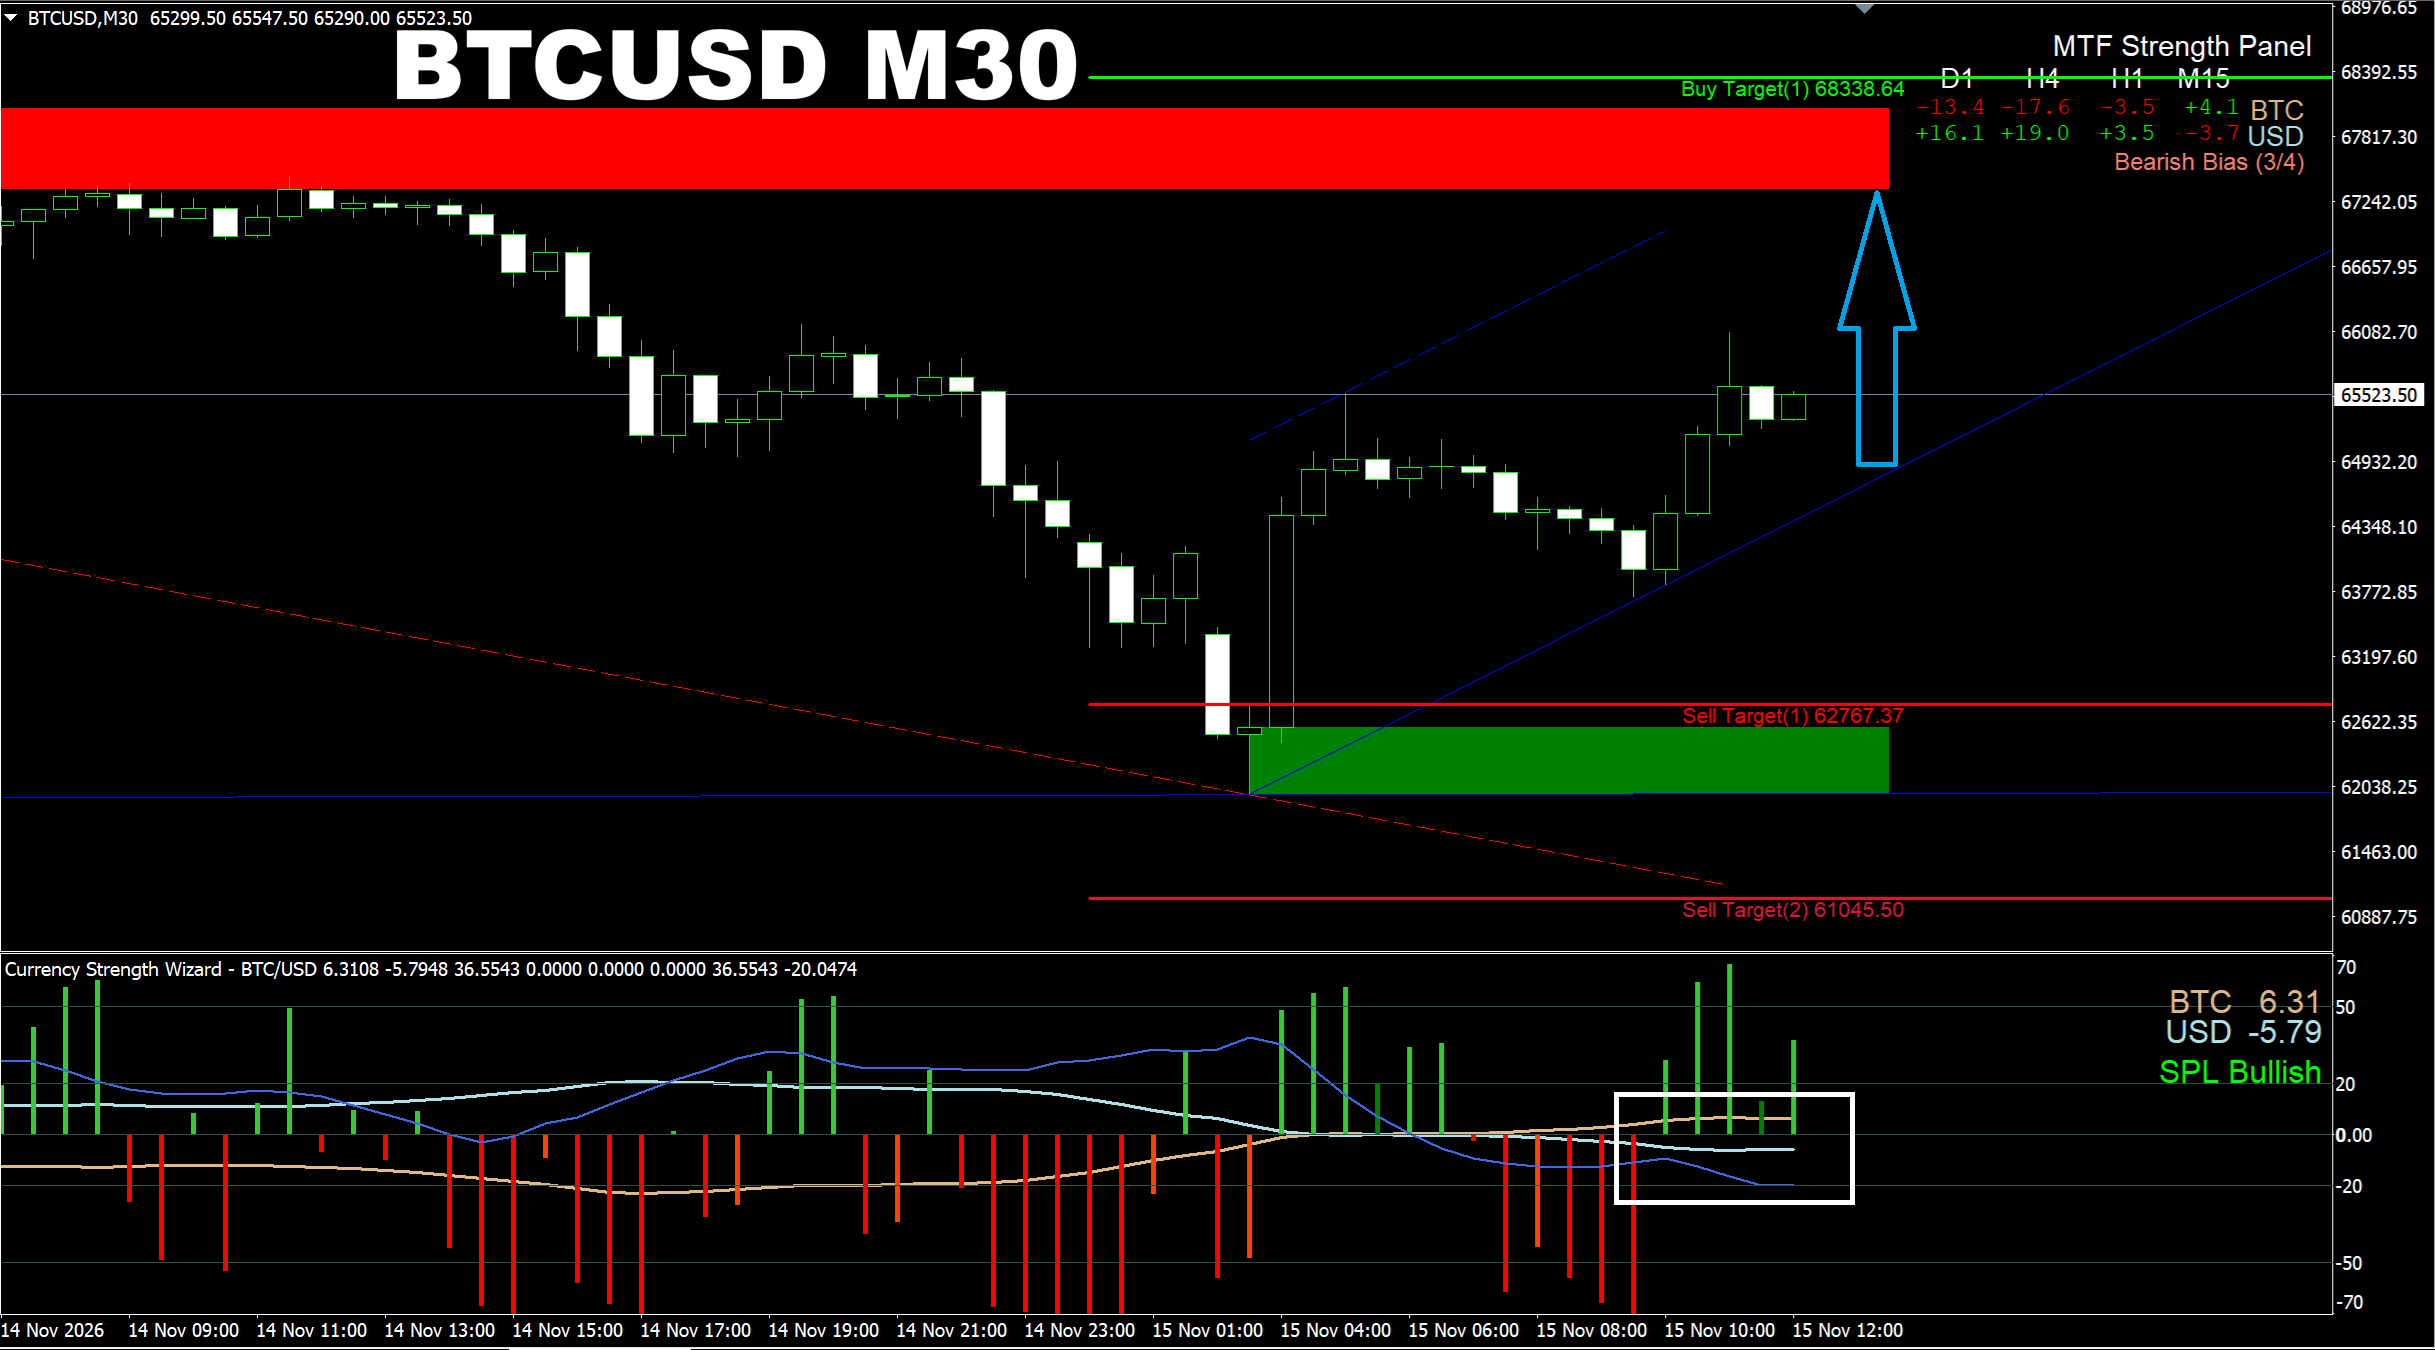
Currency Strength Wizard system. BTCUSD M30. Update on current market. The longer the price stays at the current level, the higher the chance it will go down. This is why we need to be careful with buying now.
Oleg Rodin
Oleg Rodin
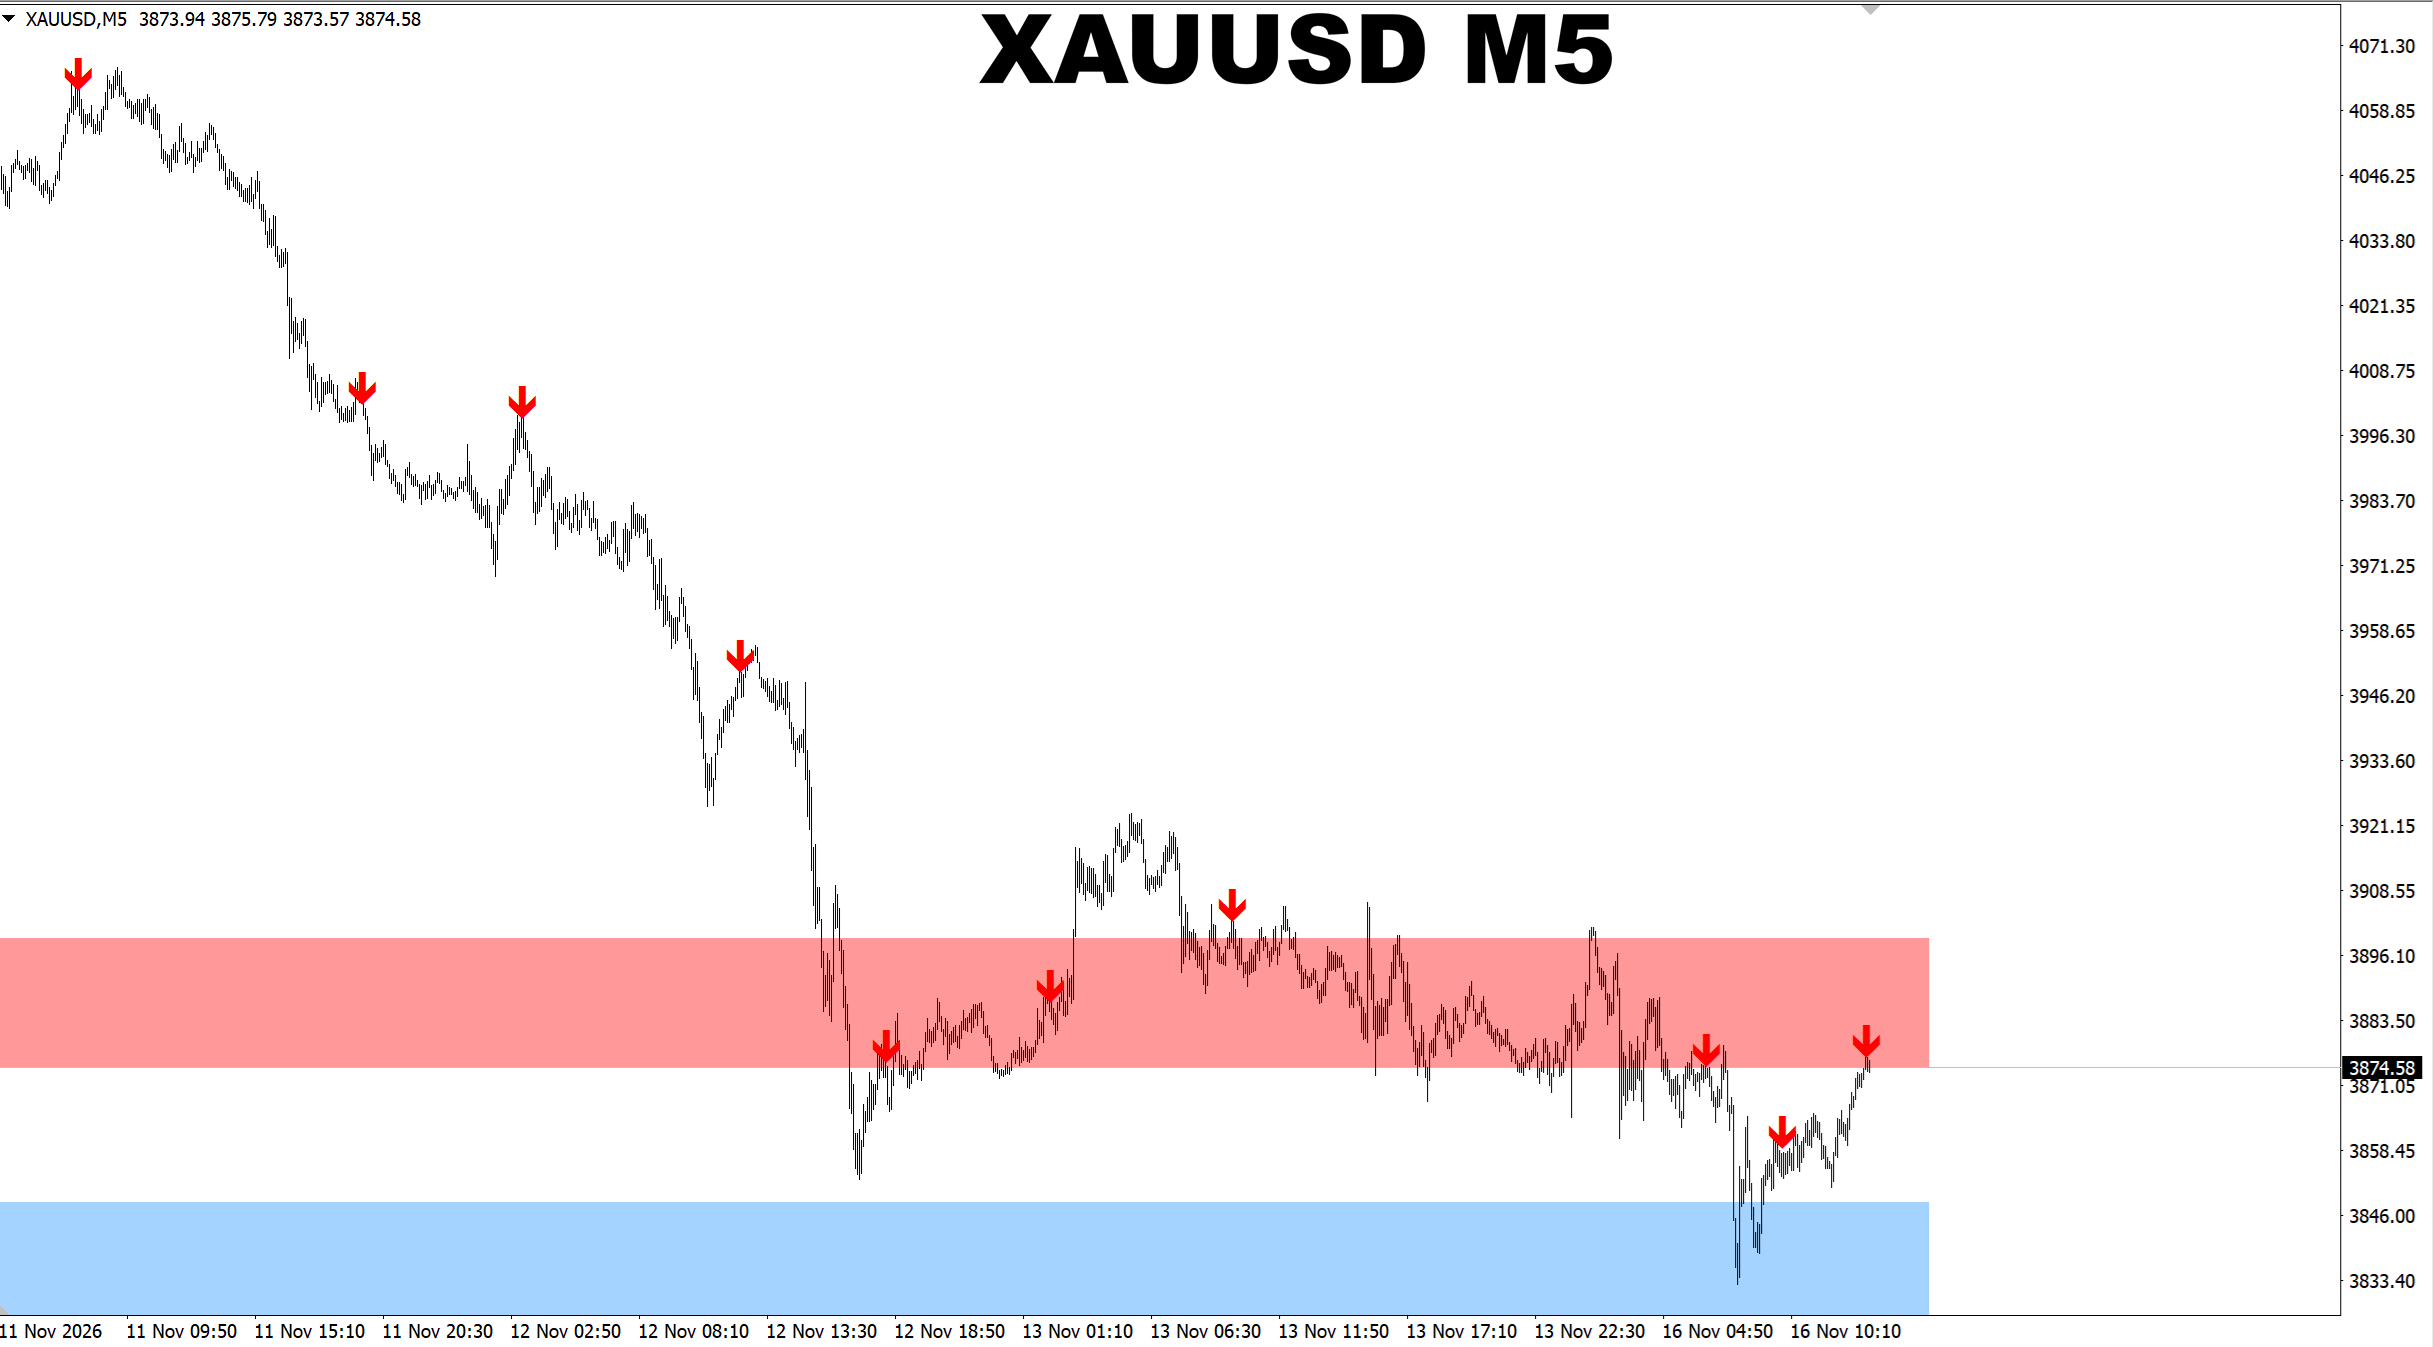
M1 Sniper. XAUUSD M5. Default settings. Update on recent signals.
Oleg Rodin
Oleg Rodin
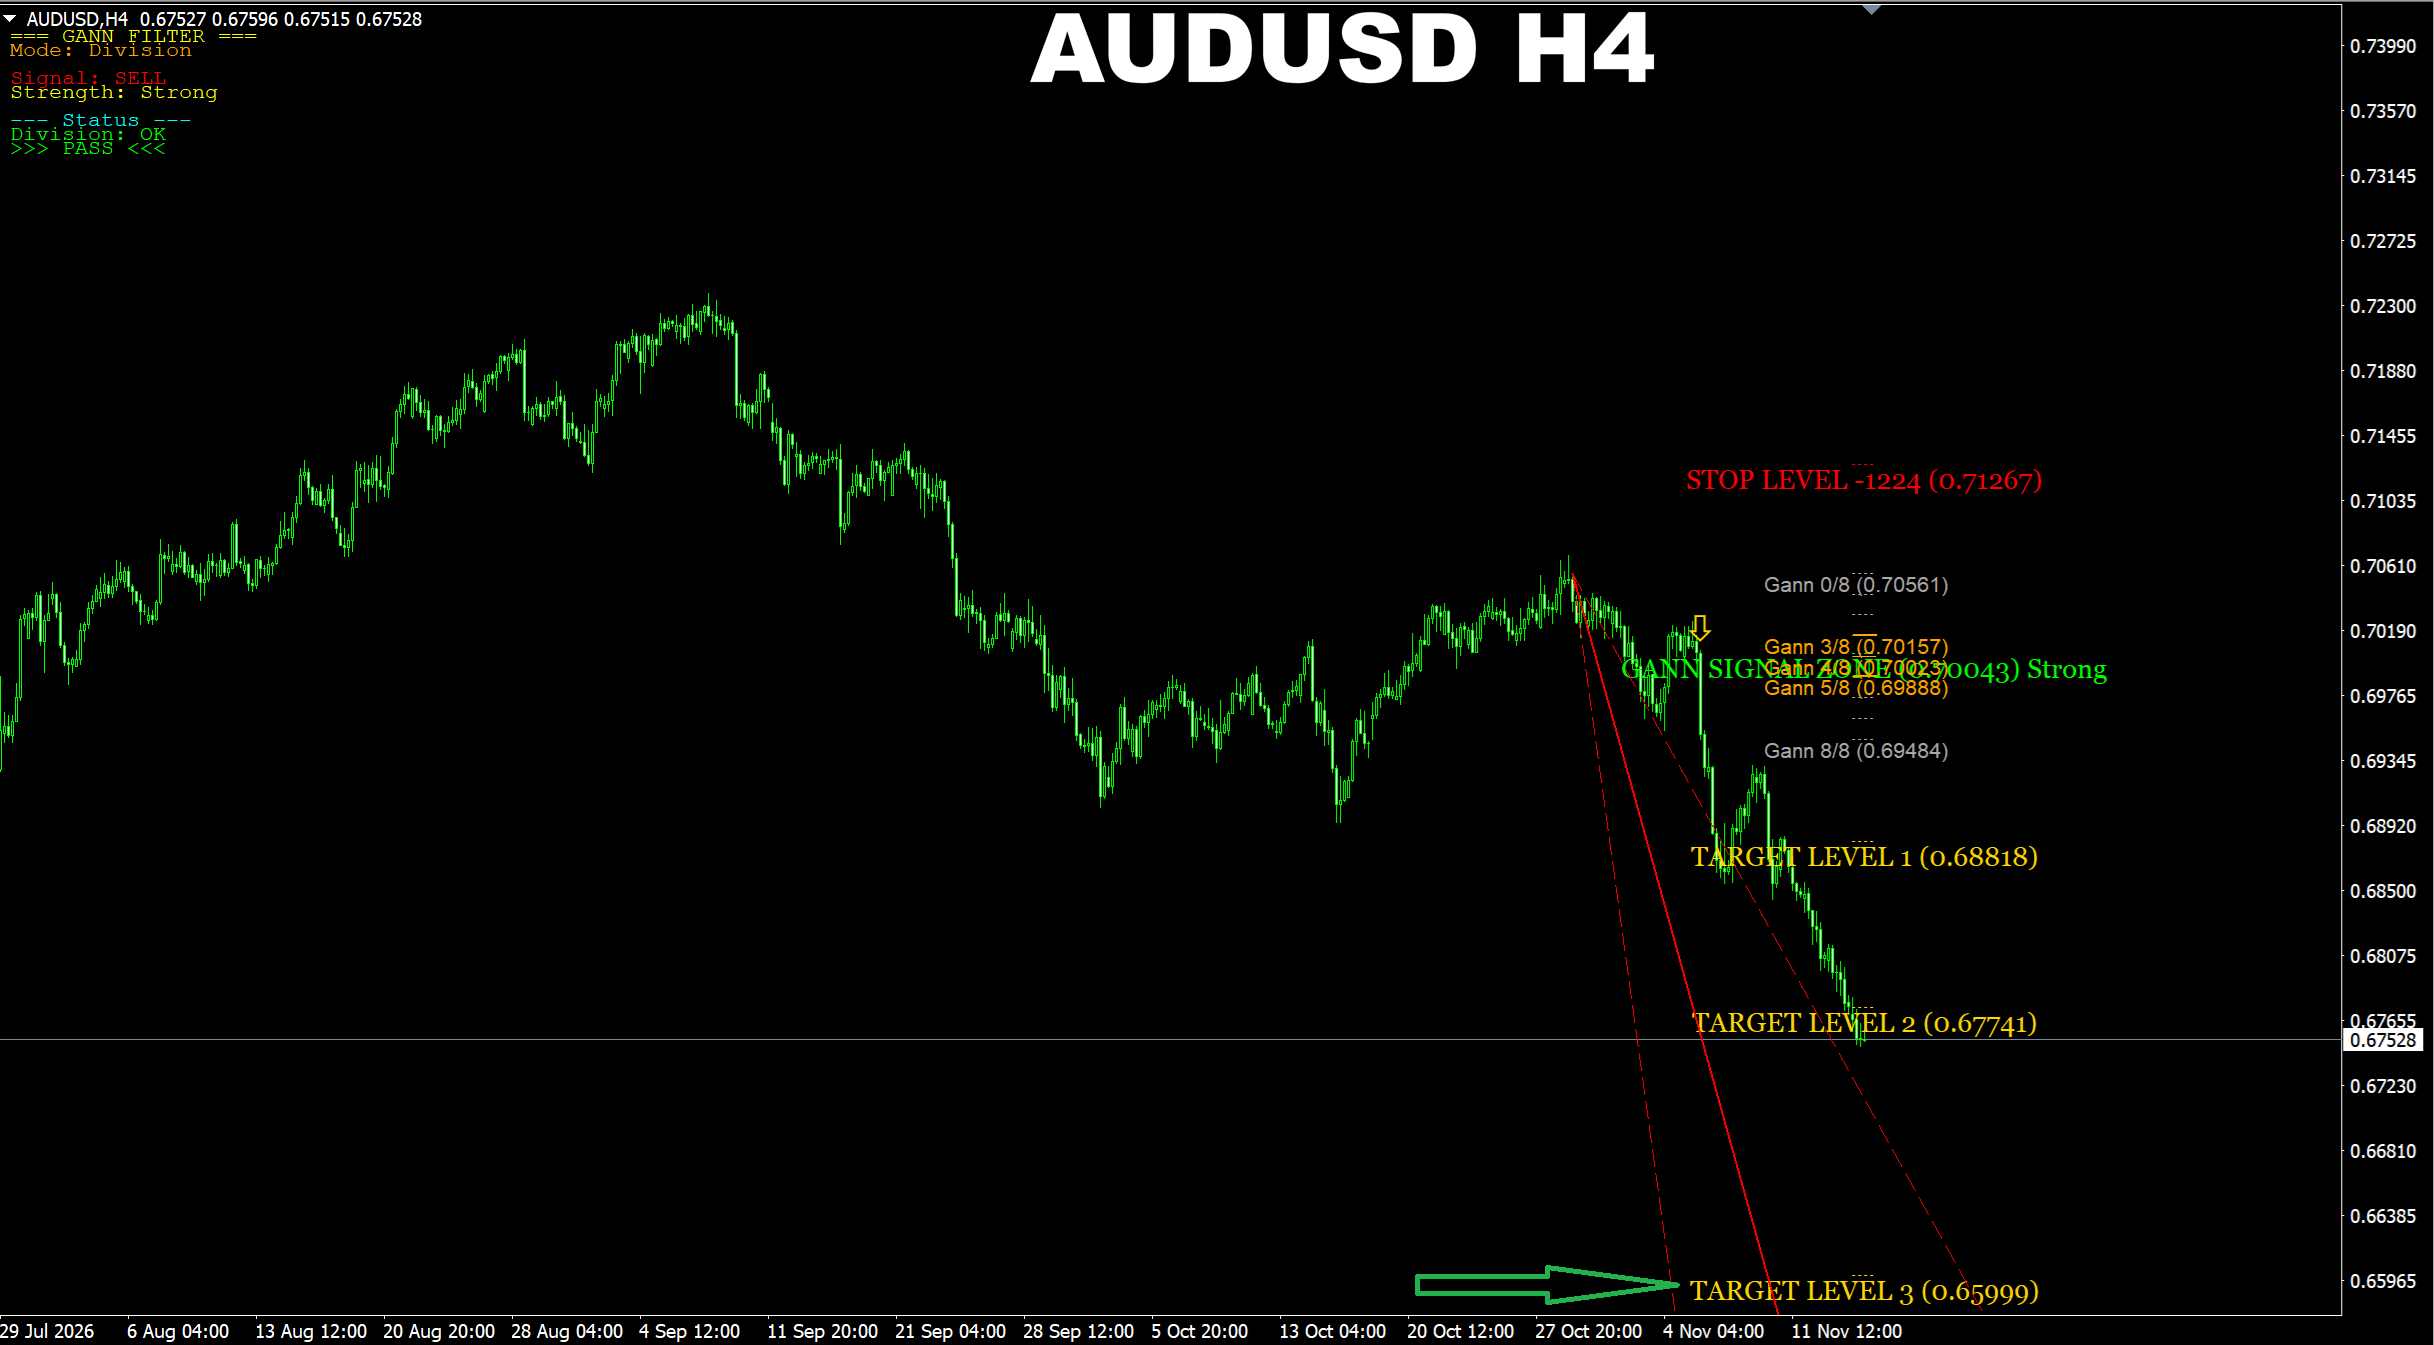
Gann Made Easy. AUDUSD H4. Update on the SELL signal we've been following since the last week. The price has recently reached the 2nd TP. It is slowly moving toward the area I meantioned before. So the outlook is still the same. The price is expected to reach the TP3 eventually.
Oleg Rodin
Oleg Rodin
Scalper Vault. XAUUSD M30. Update on current market. We have had a strong SELL pattern in the SELL zone recently. Now the price is retracing up. But soon we may see the price start returning toward the recent low shown by that SELL pattern.
Oleg Rodin
Oleg Rodin
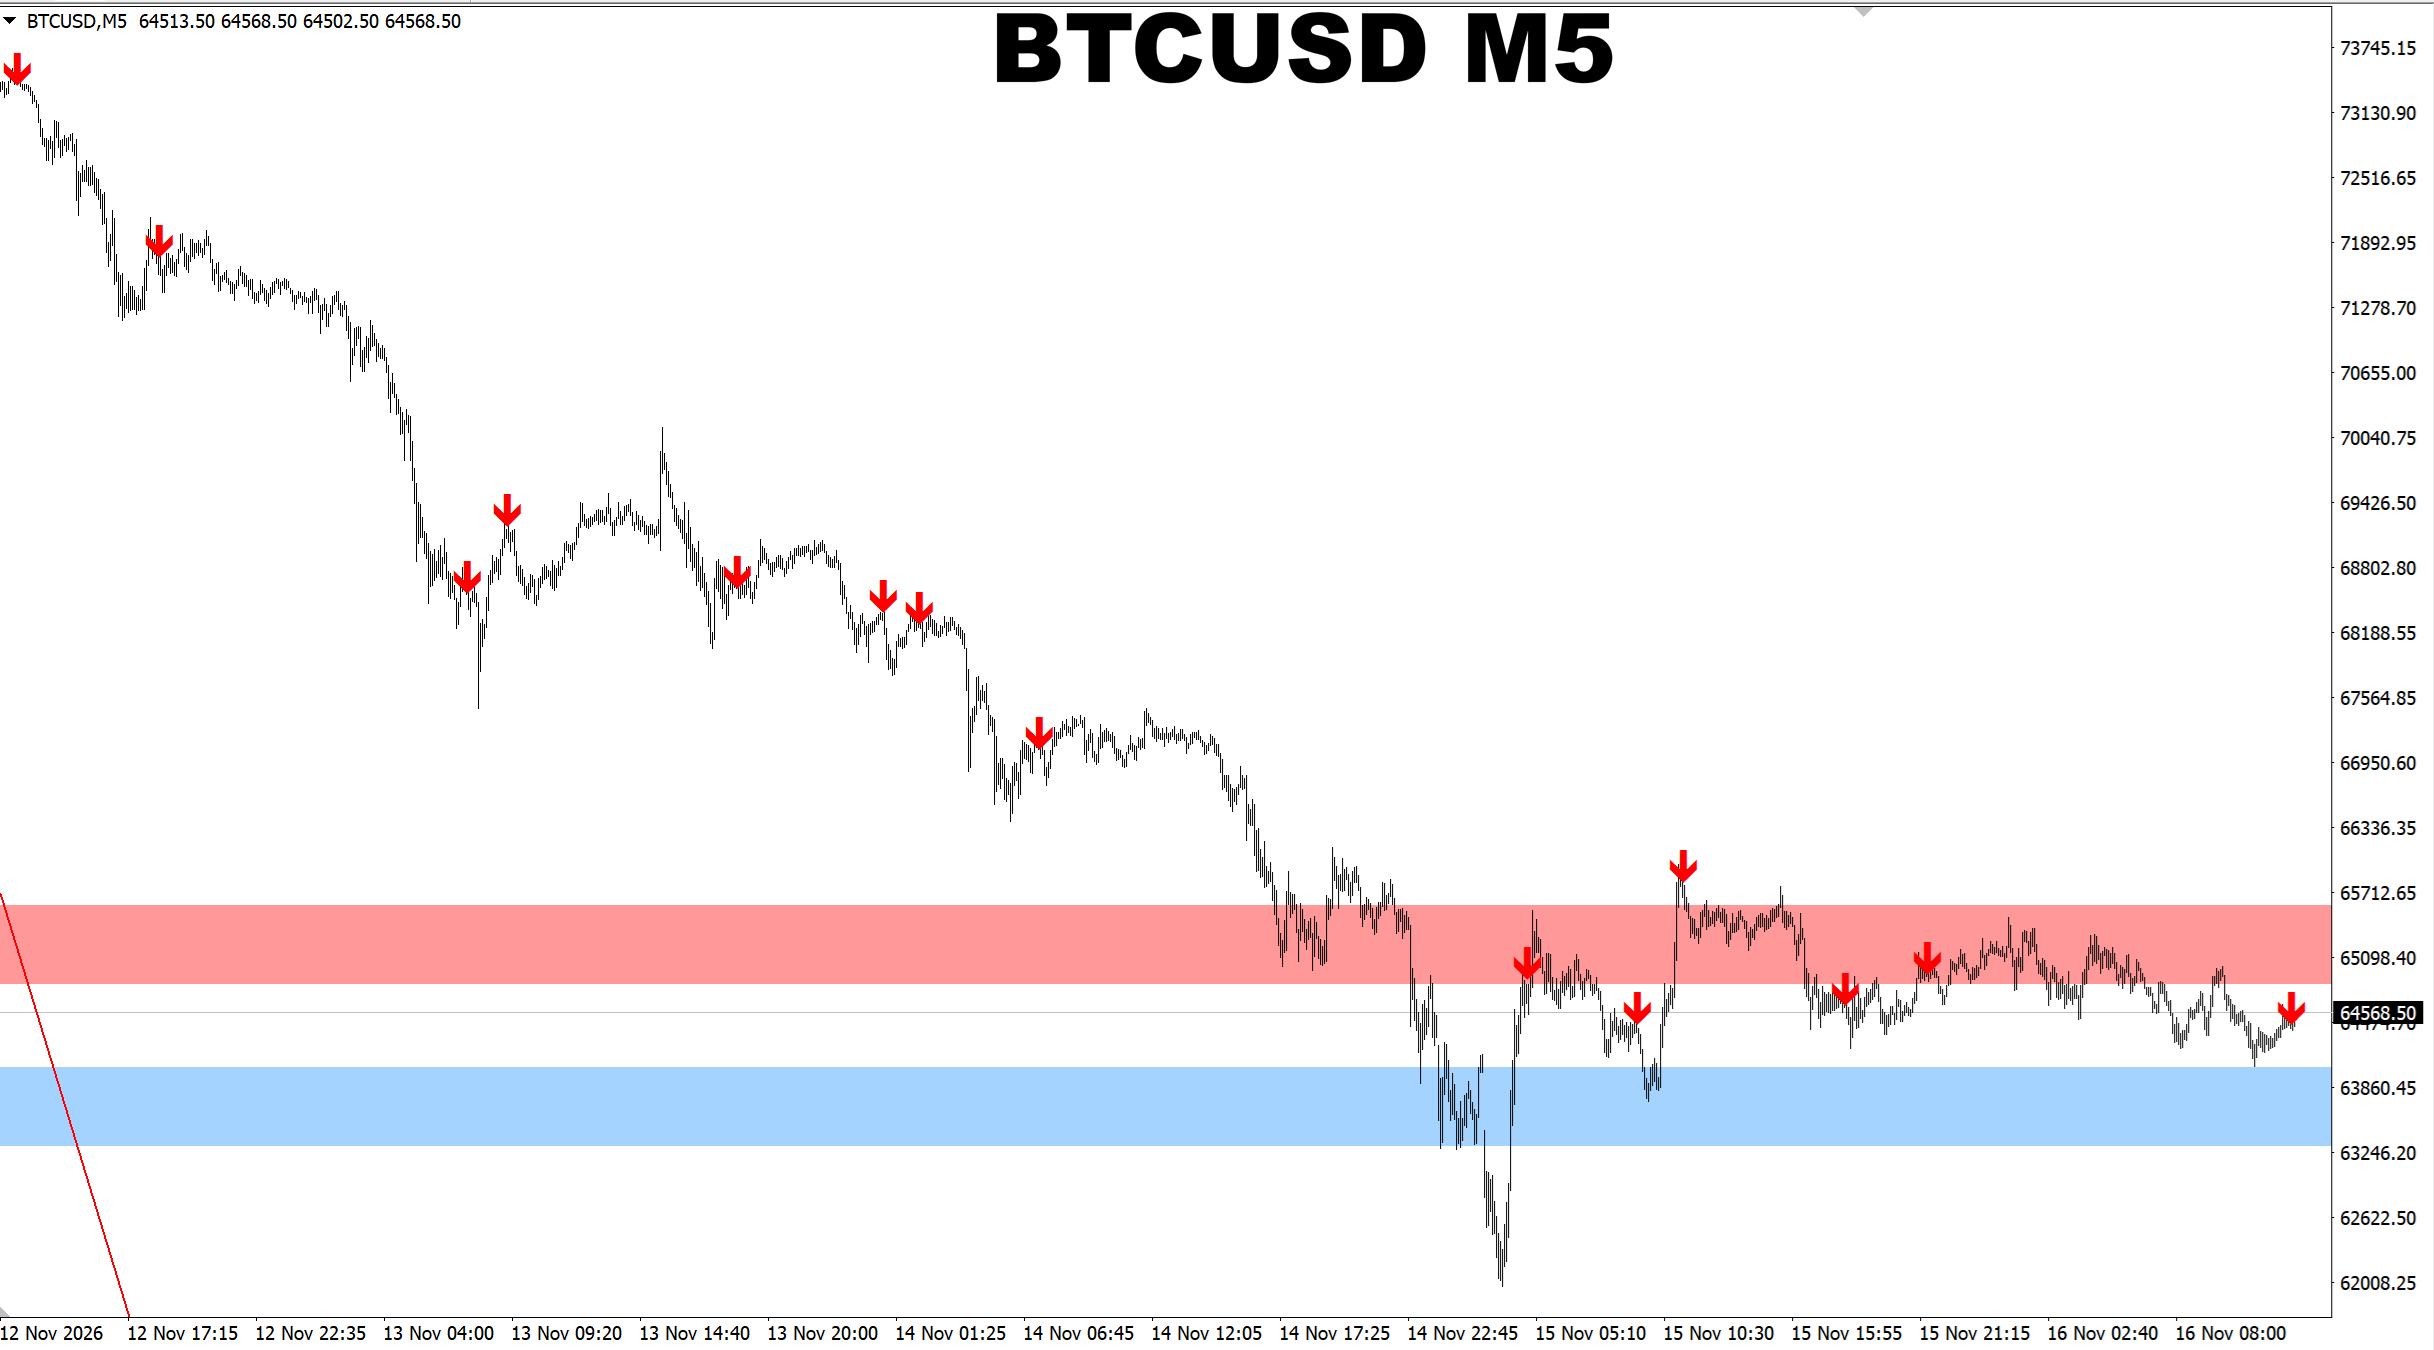
M1 Sniper. BTCUSD M5. Default settings. Recent signals performance.
Oleg Rodin
Oleg Rodin
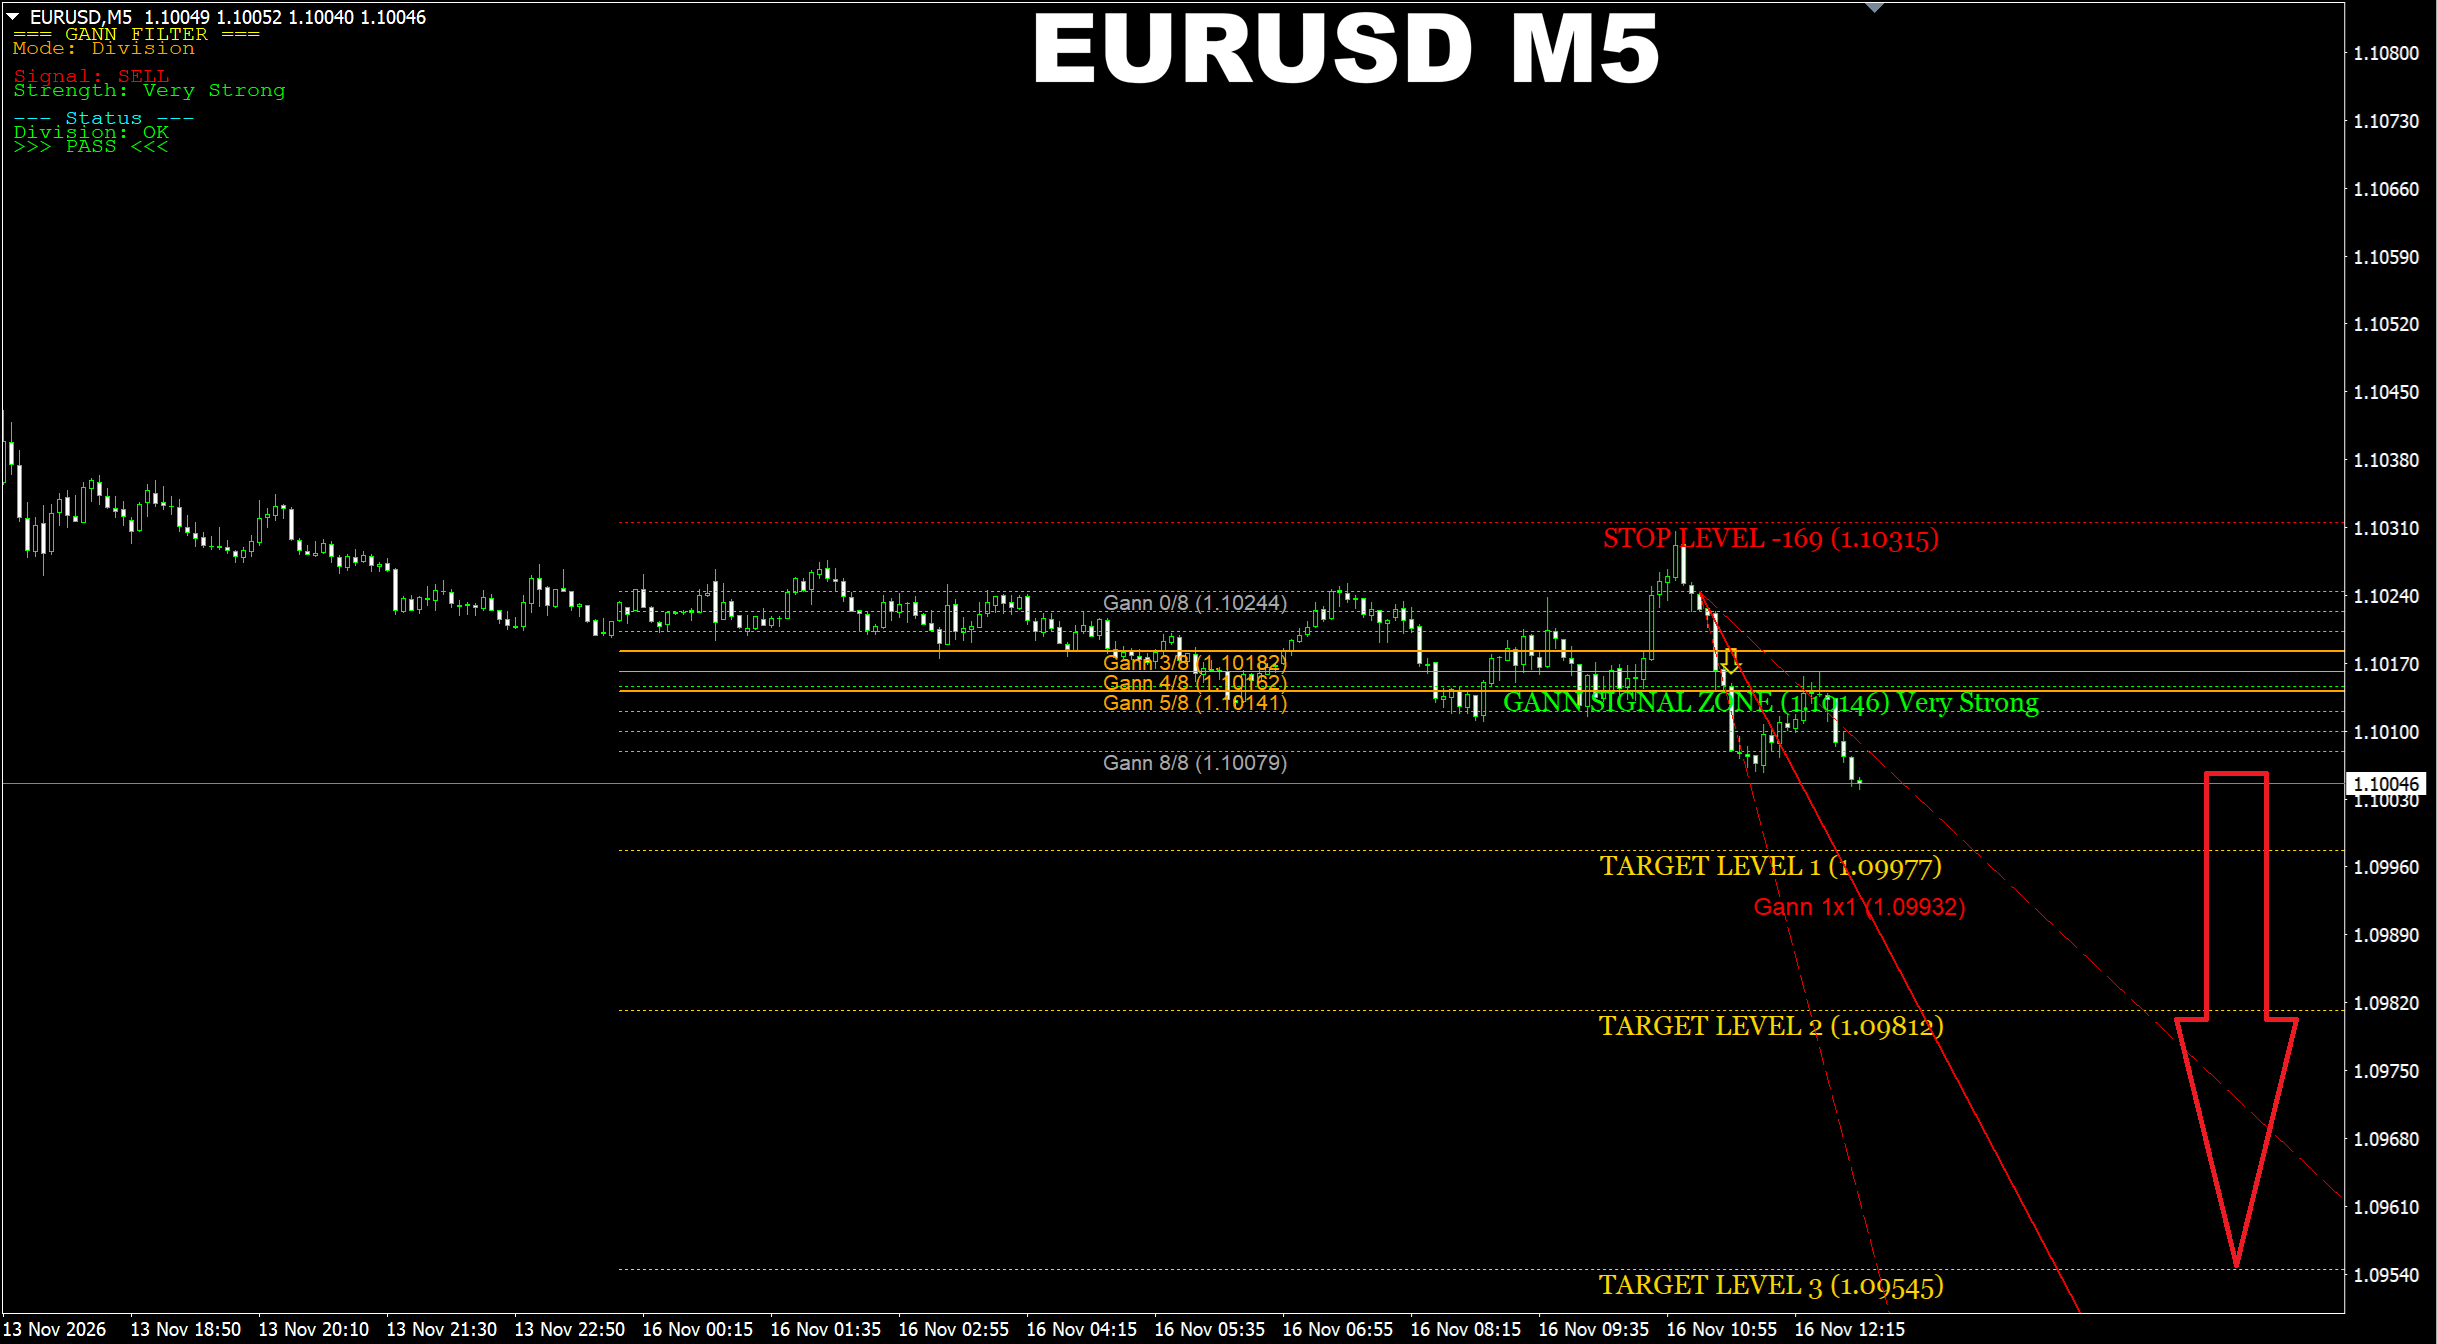
Gann Made Easy. EURUSD M5. We also have an active SELL signal here where it is possible to use the TP3 as the target.
Oleg Rodin
Oleg Rodin
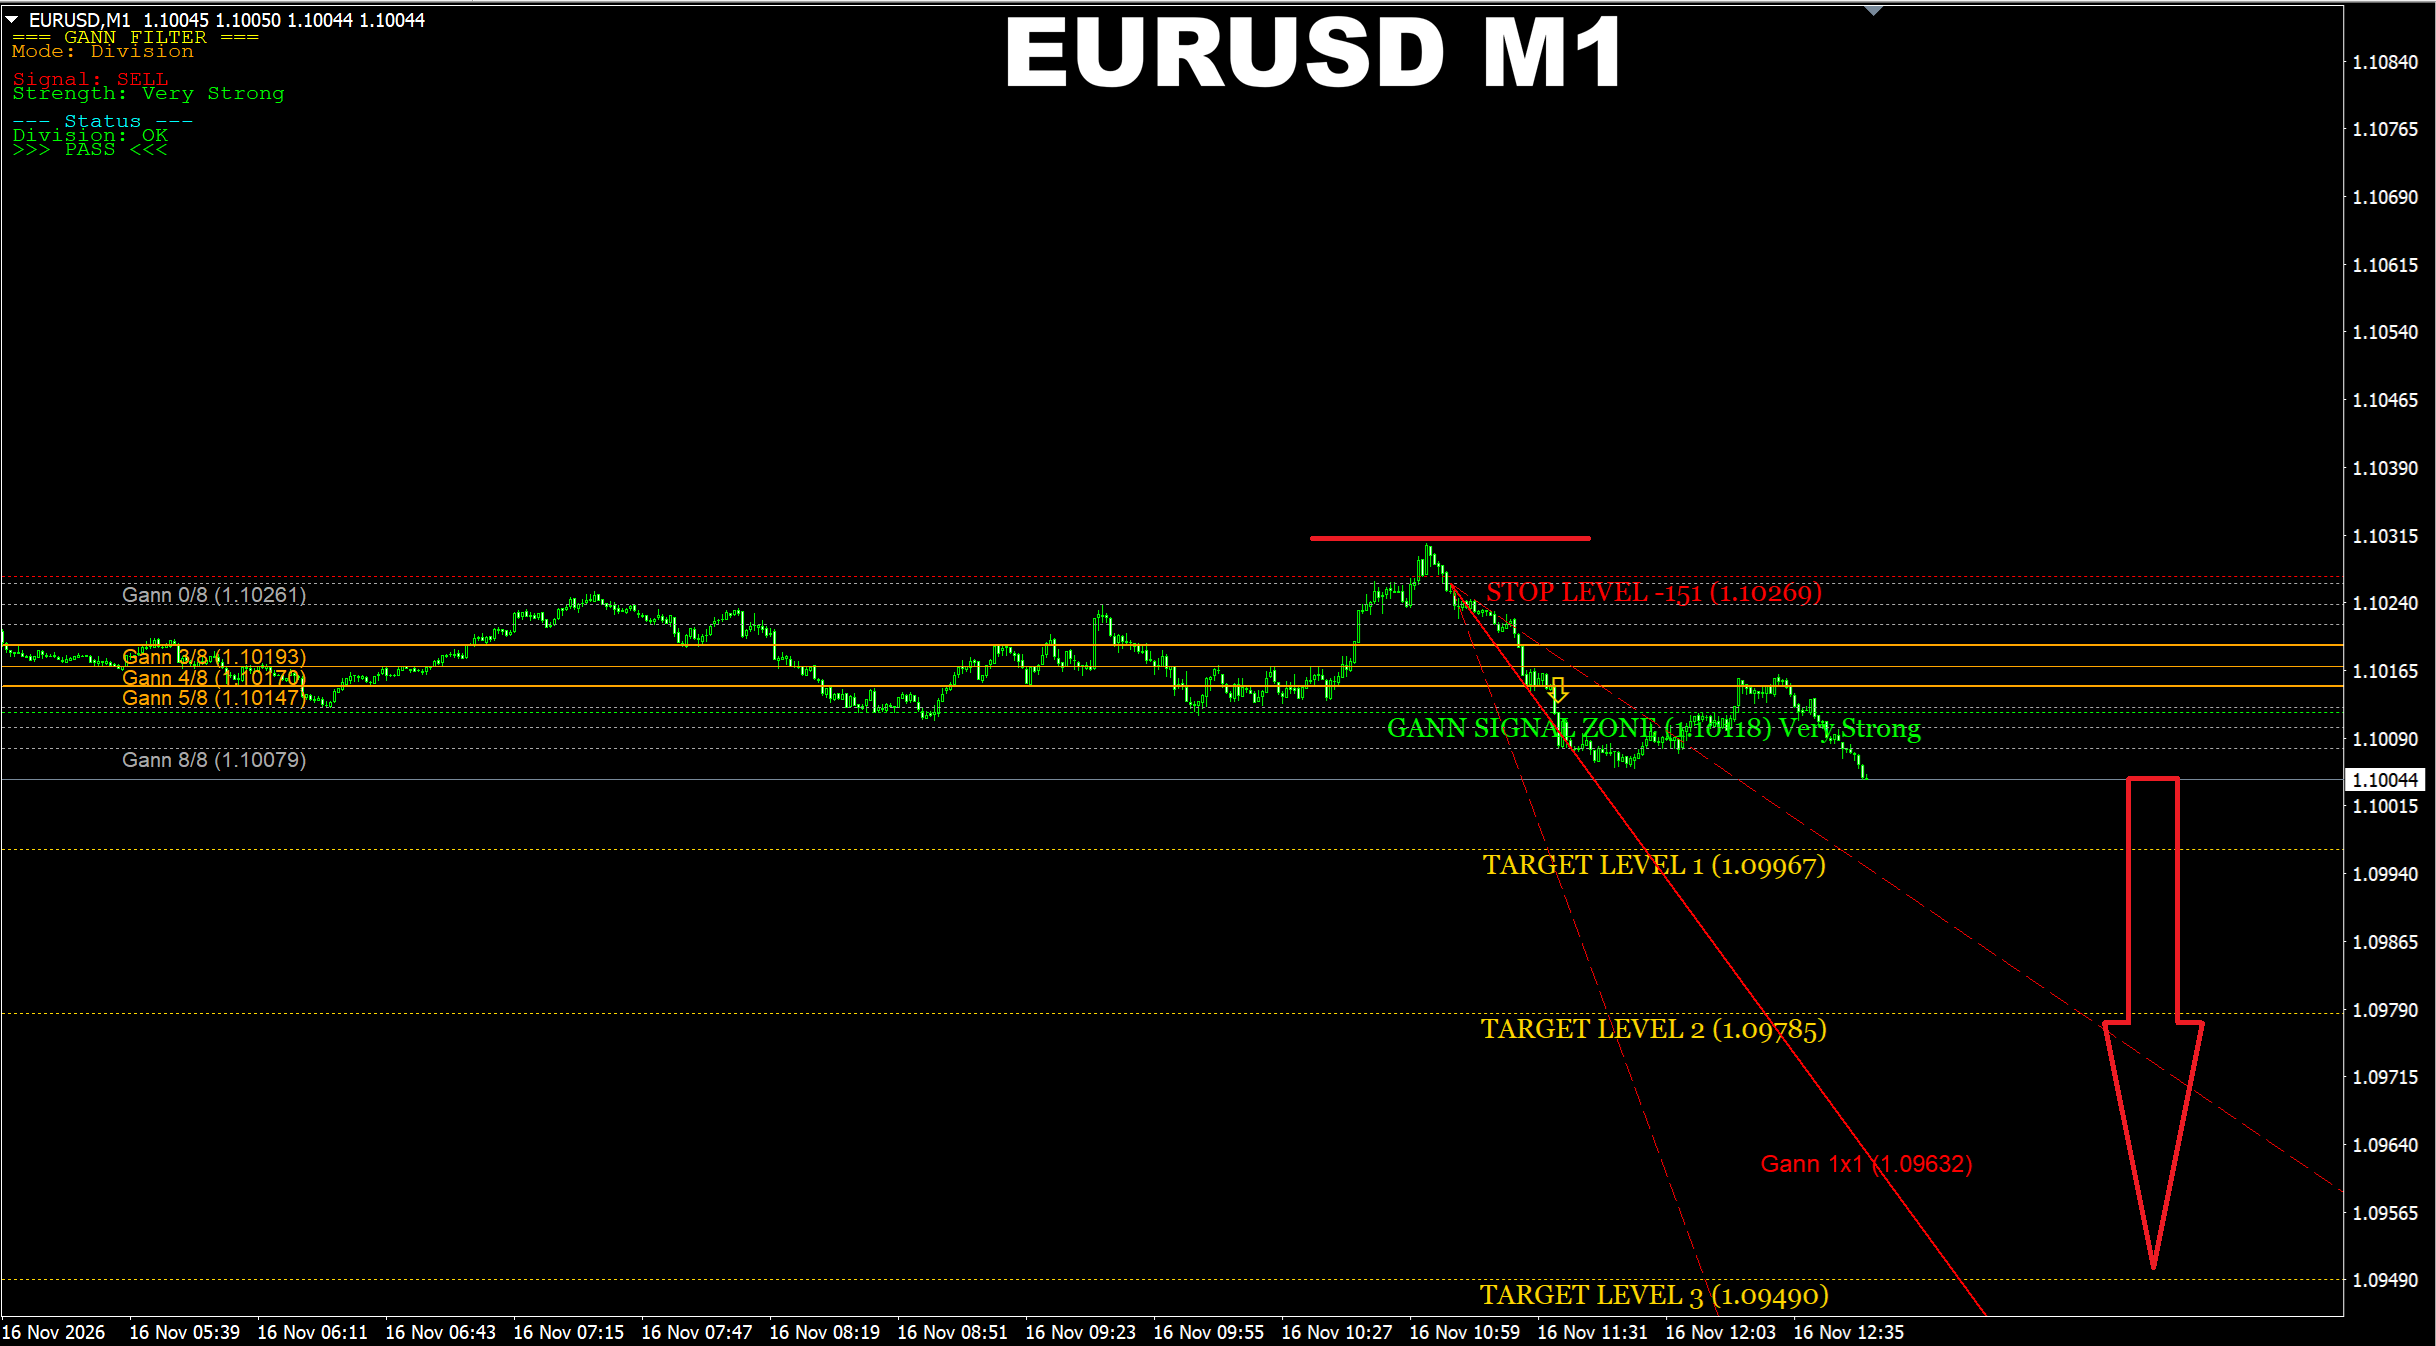
Gann Made Easy. EURUSD M1. We have an active SELL signal here where it is possible to use the TP3 as the target.
Oleg Rodin
Oleg Rodin
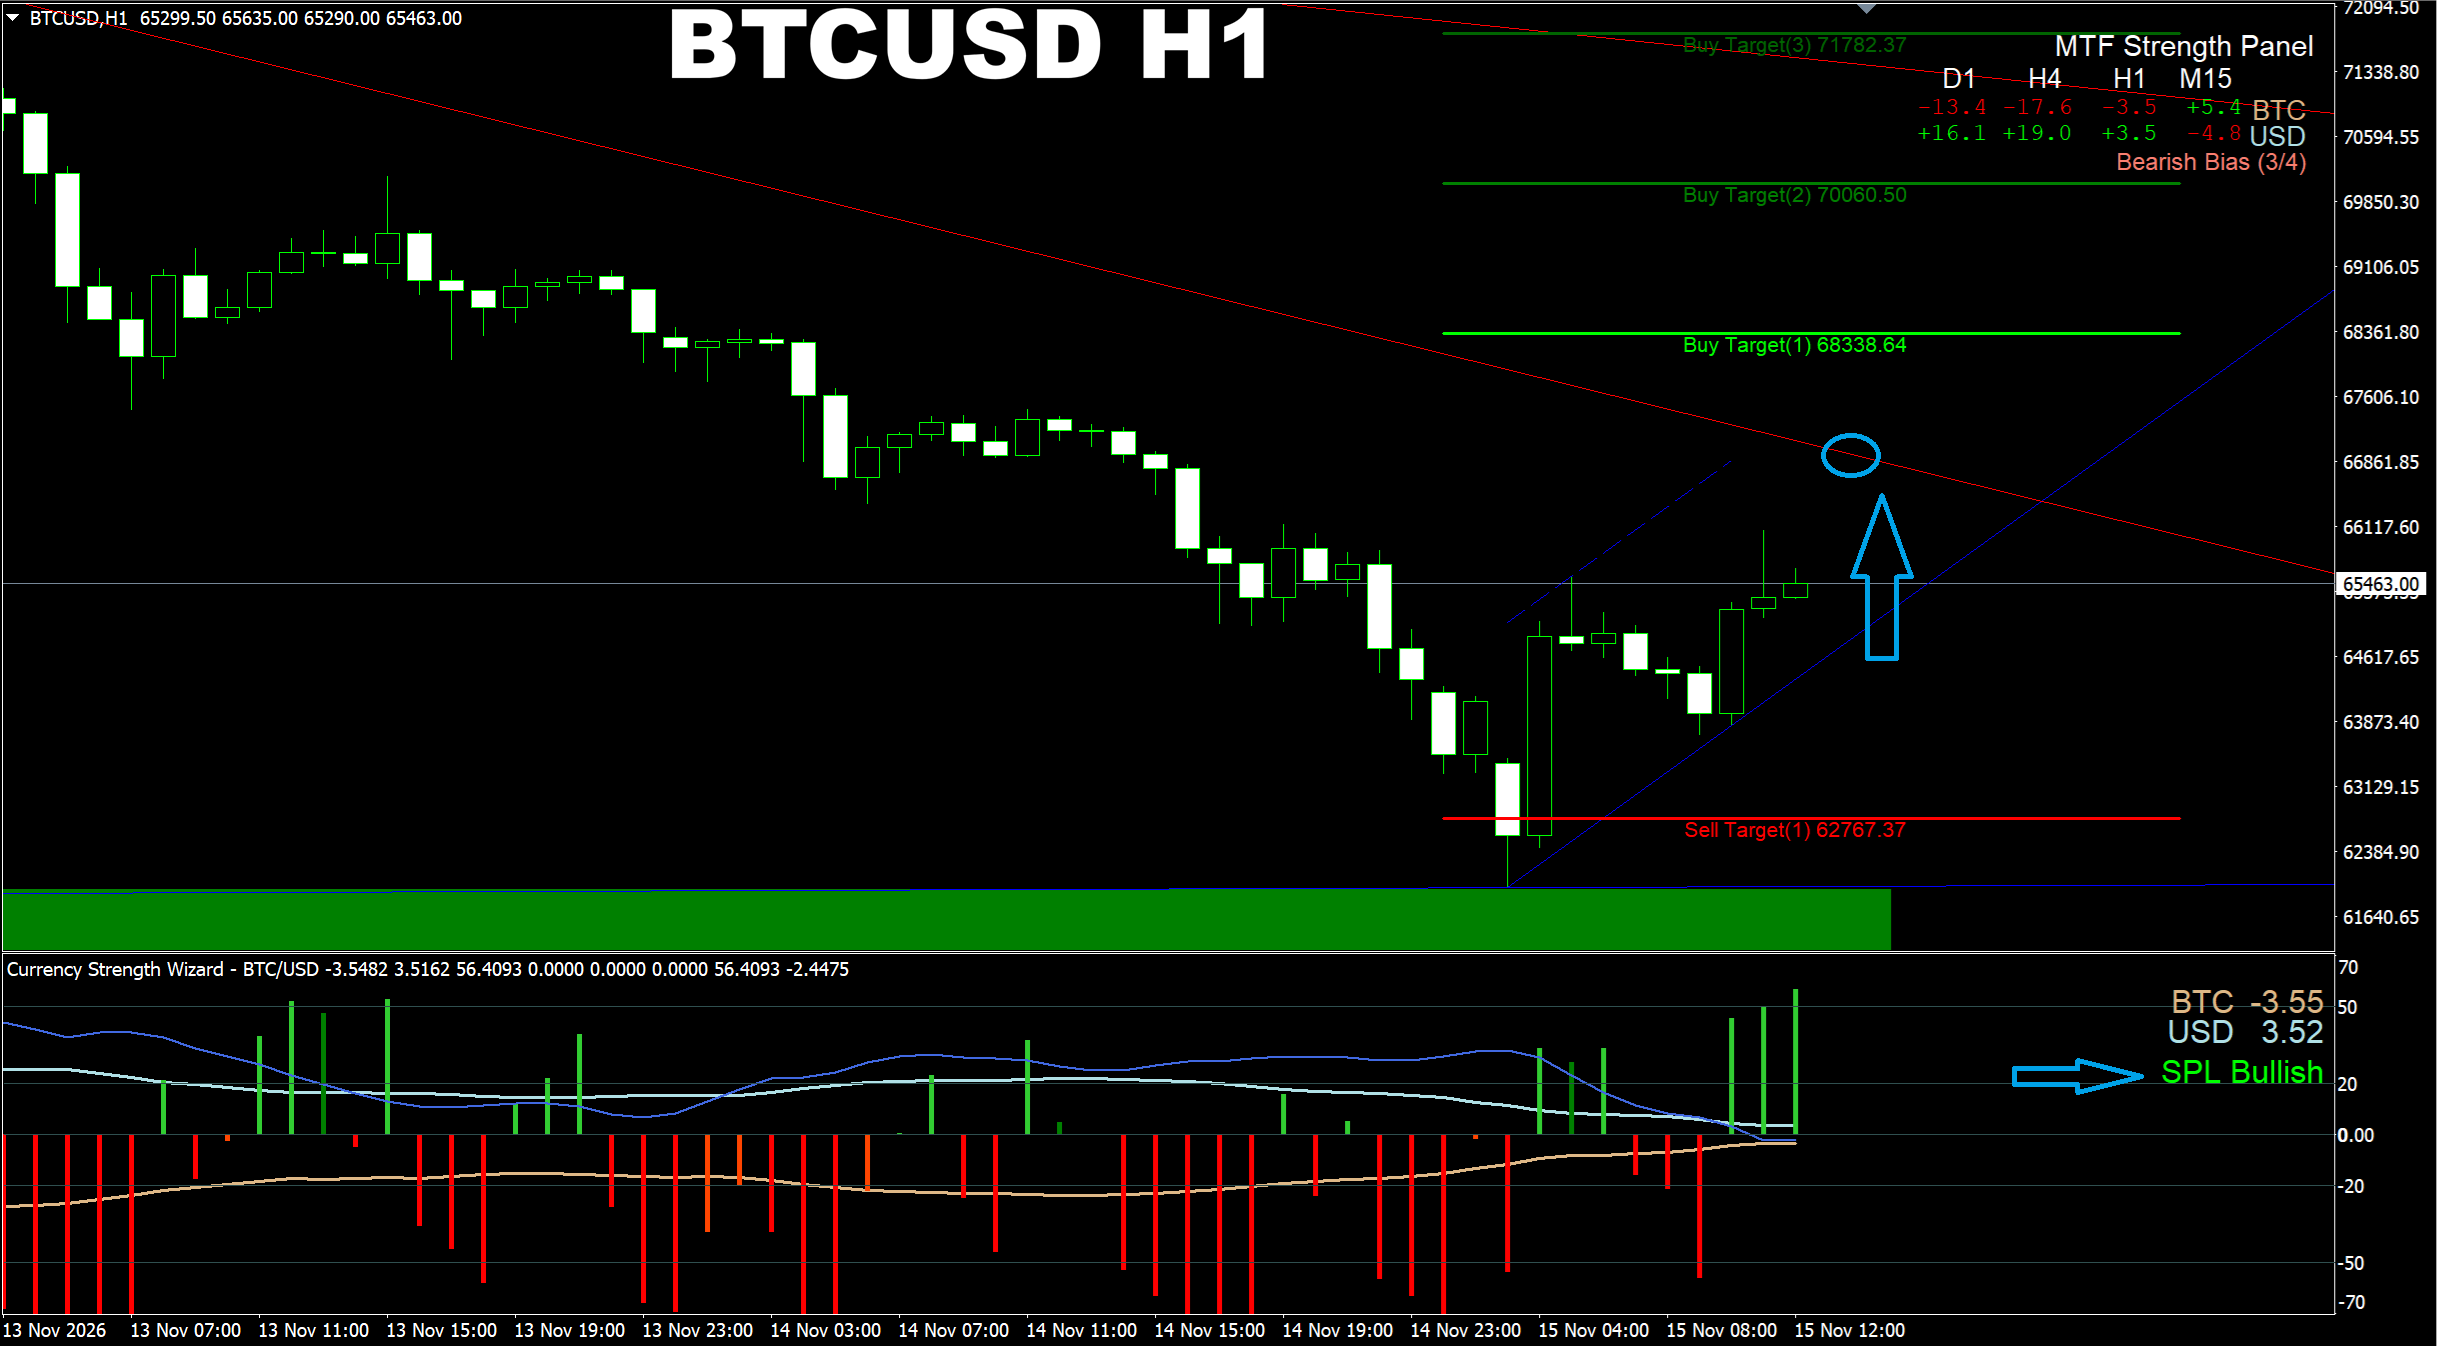
Currency Strength Wizard. BTCUSD H1. And finally let's check the H1 chart. We see the Demand area down below which was the cause of current buy reaction. Just to remind you that this area is based not only on H1 but also on higher time frames like D1 and even the Weekly chart (Demand area there also starts at that price area). So this factor made the price jump from that area. Now let's get back to our task. We wanted to know if the price could go higher. So based on previous screenshots we found out it is possible. Now if we check the H1 chart, we will see that the strength bars are overbought while the main strength lines are in the favor of the sell trend. BUT! We need to pay attention to the fact that these lines became narrow though the strength is in the direction of the selling for now. But this is already a sign that the strengh is not that significant as it was before. Moreover we see that the swing predictor line crossed zero level down. It means the price is "feeling" buying liquidity down below under the price. And as a result that liquidity may push the price higher, at least to the trend lines where I put the blue circle.
Oleg Rodin
Oleg Rodin
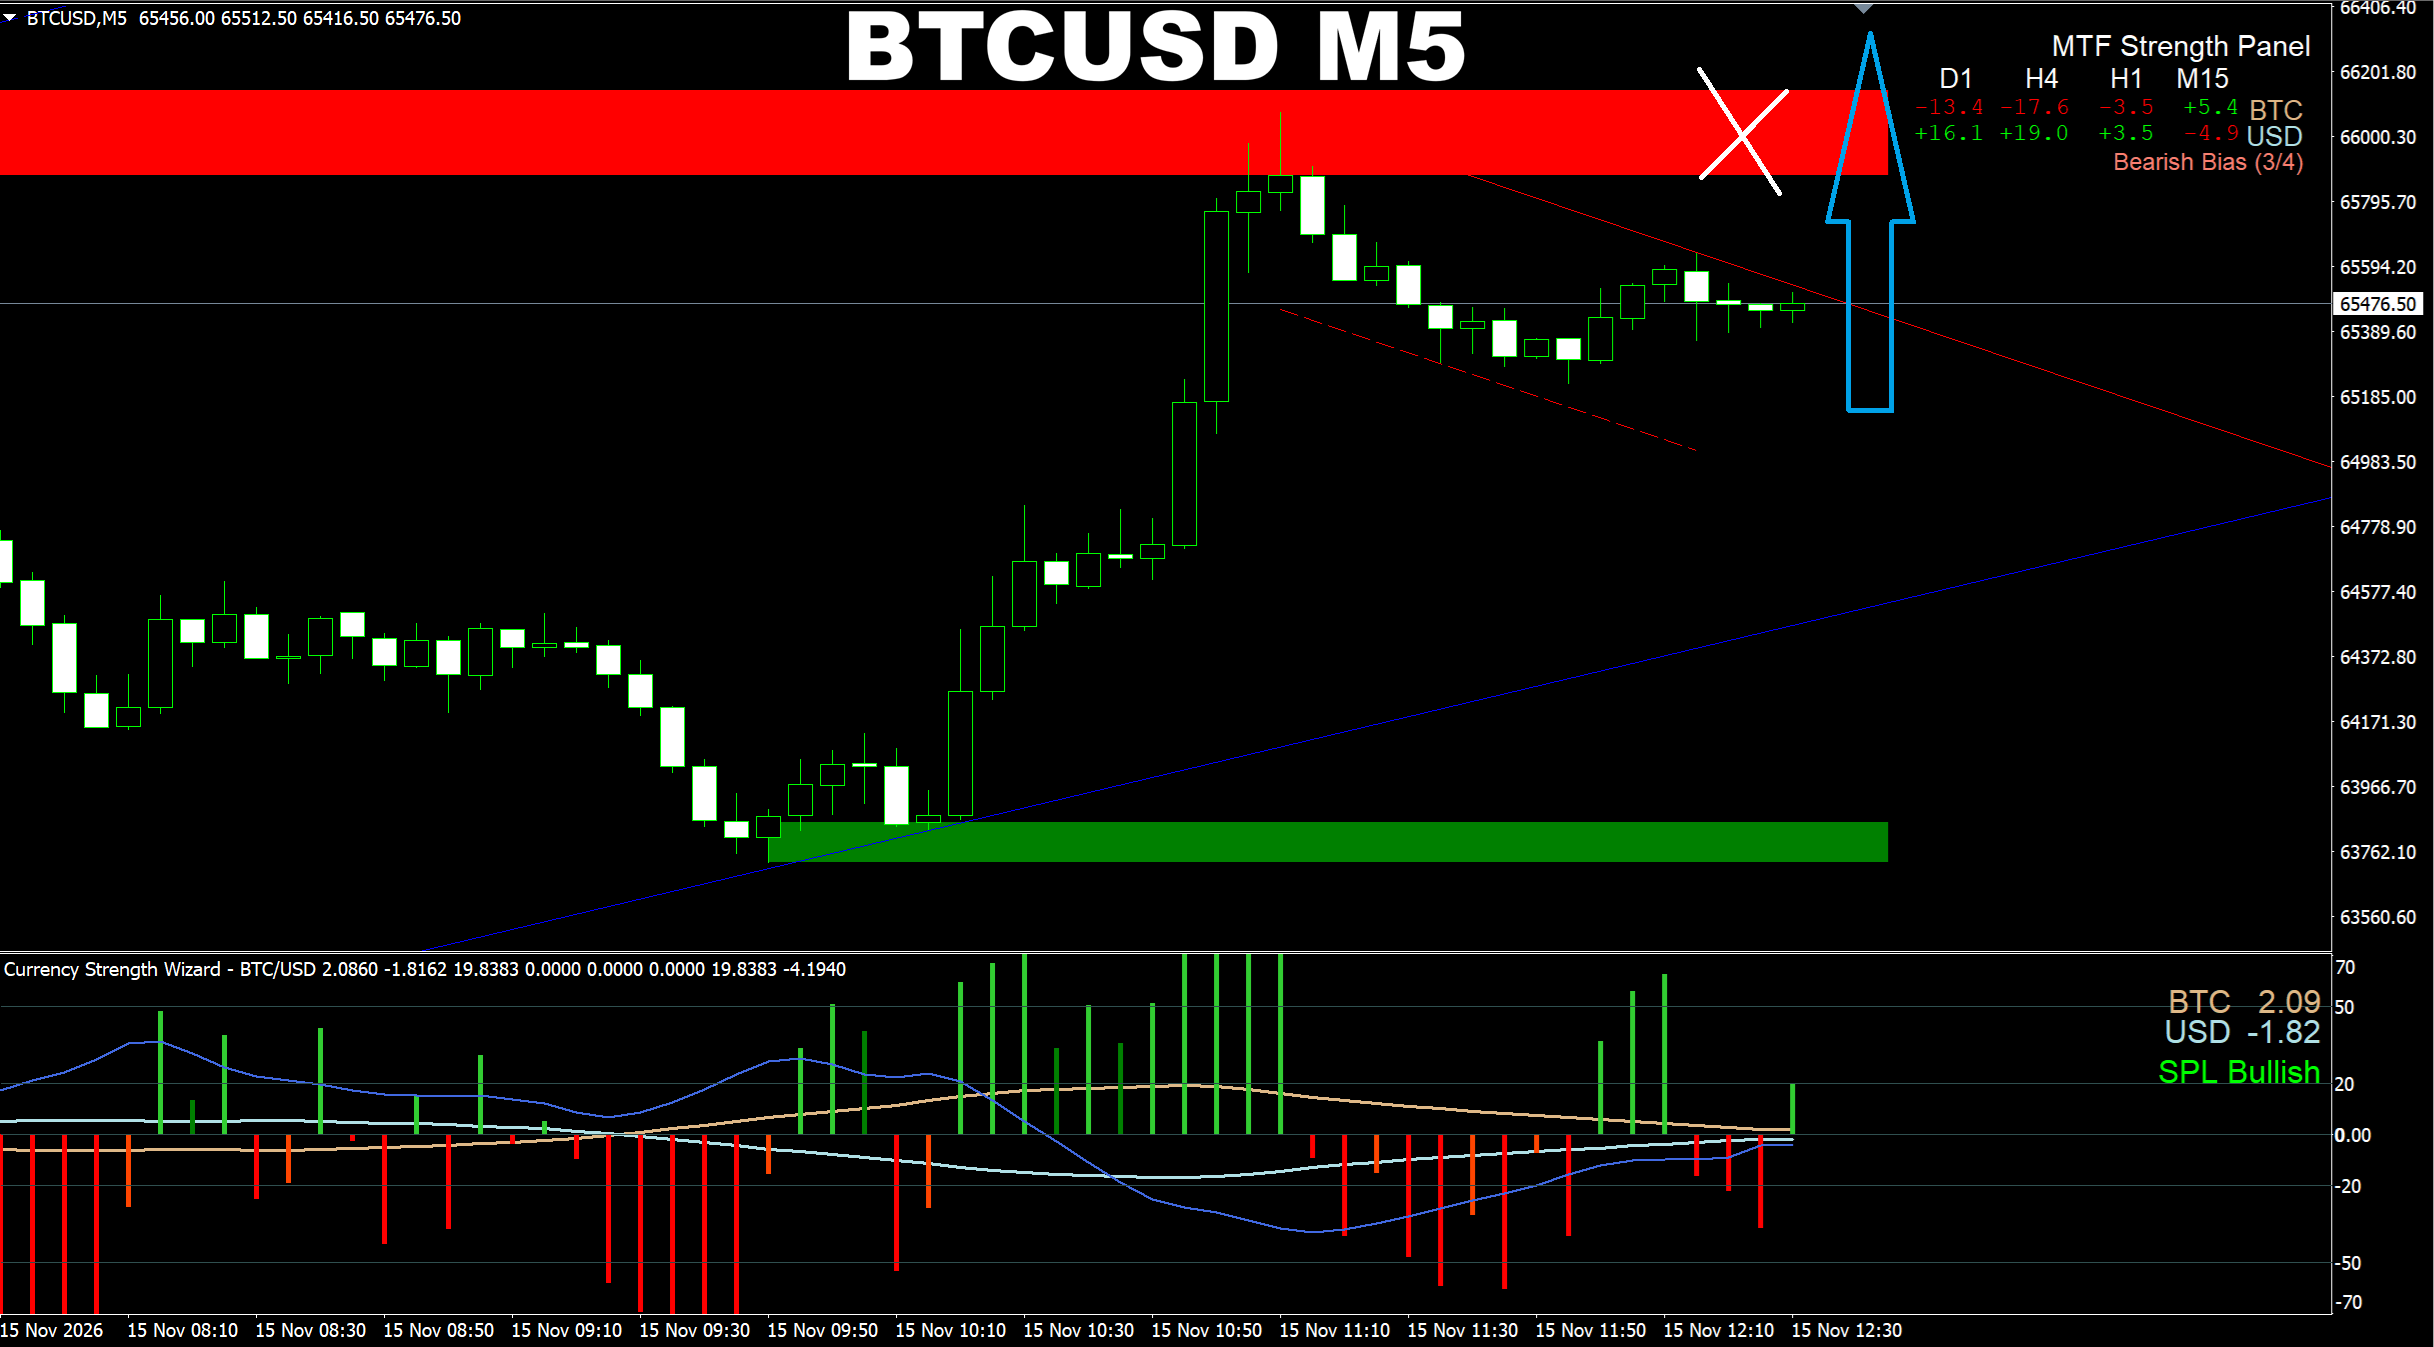
Currency Strength Wizard. BTCUSD M5. Update on my previus post. And if we want to be even more conservative, we can wait for current Supply area above break out or for the situation when the price forms a new demand area. It does not mean you always need to follow all these steps I am showing. But as my goal here is to show how we can work with market, I want to give you as many tips as possible.
Oleg Rodin
Oleg Rodin
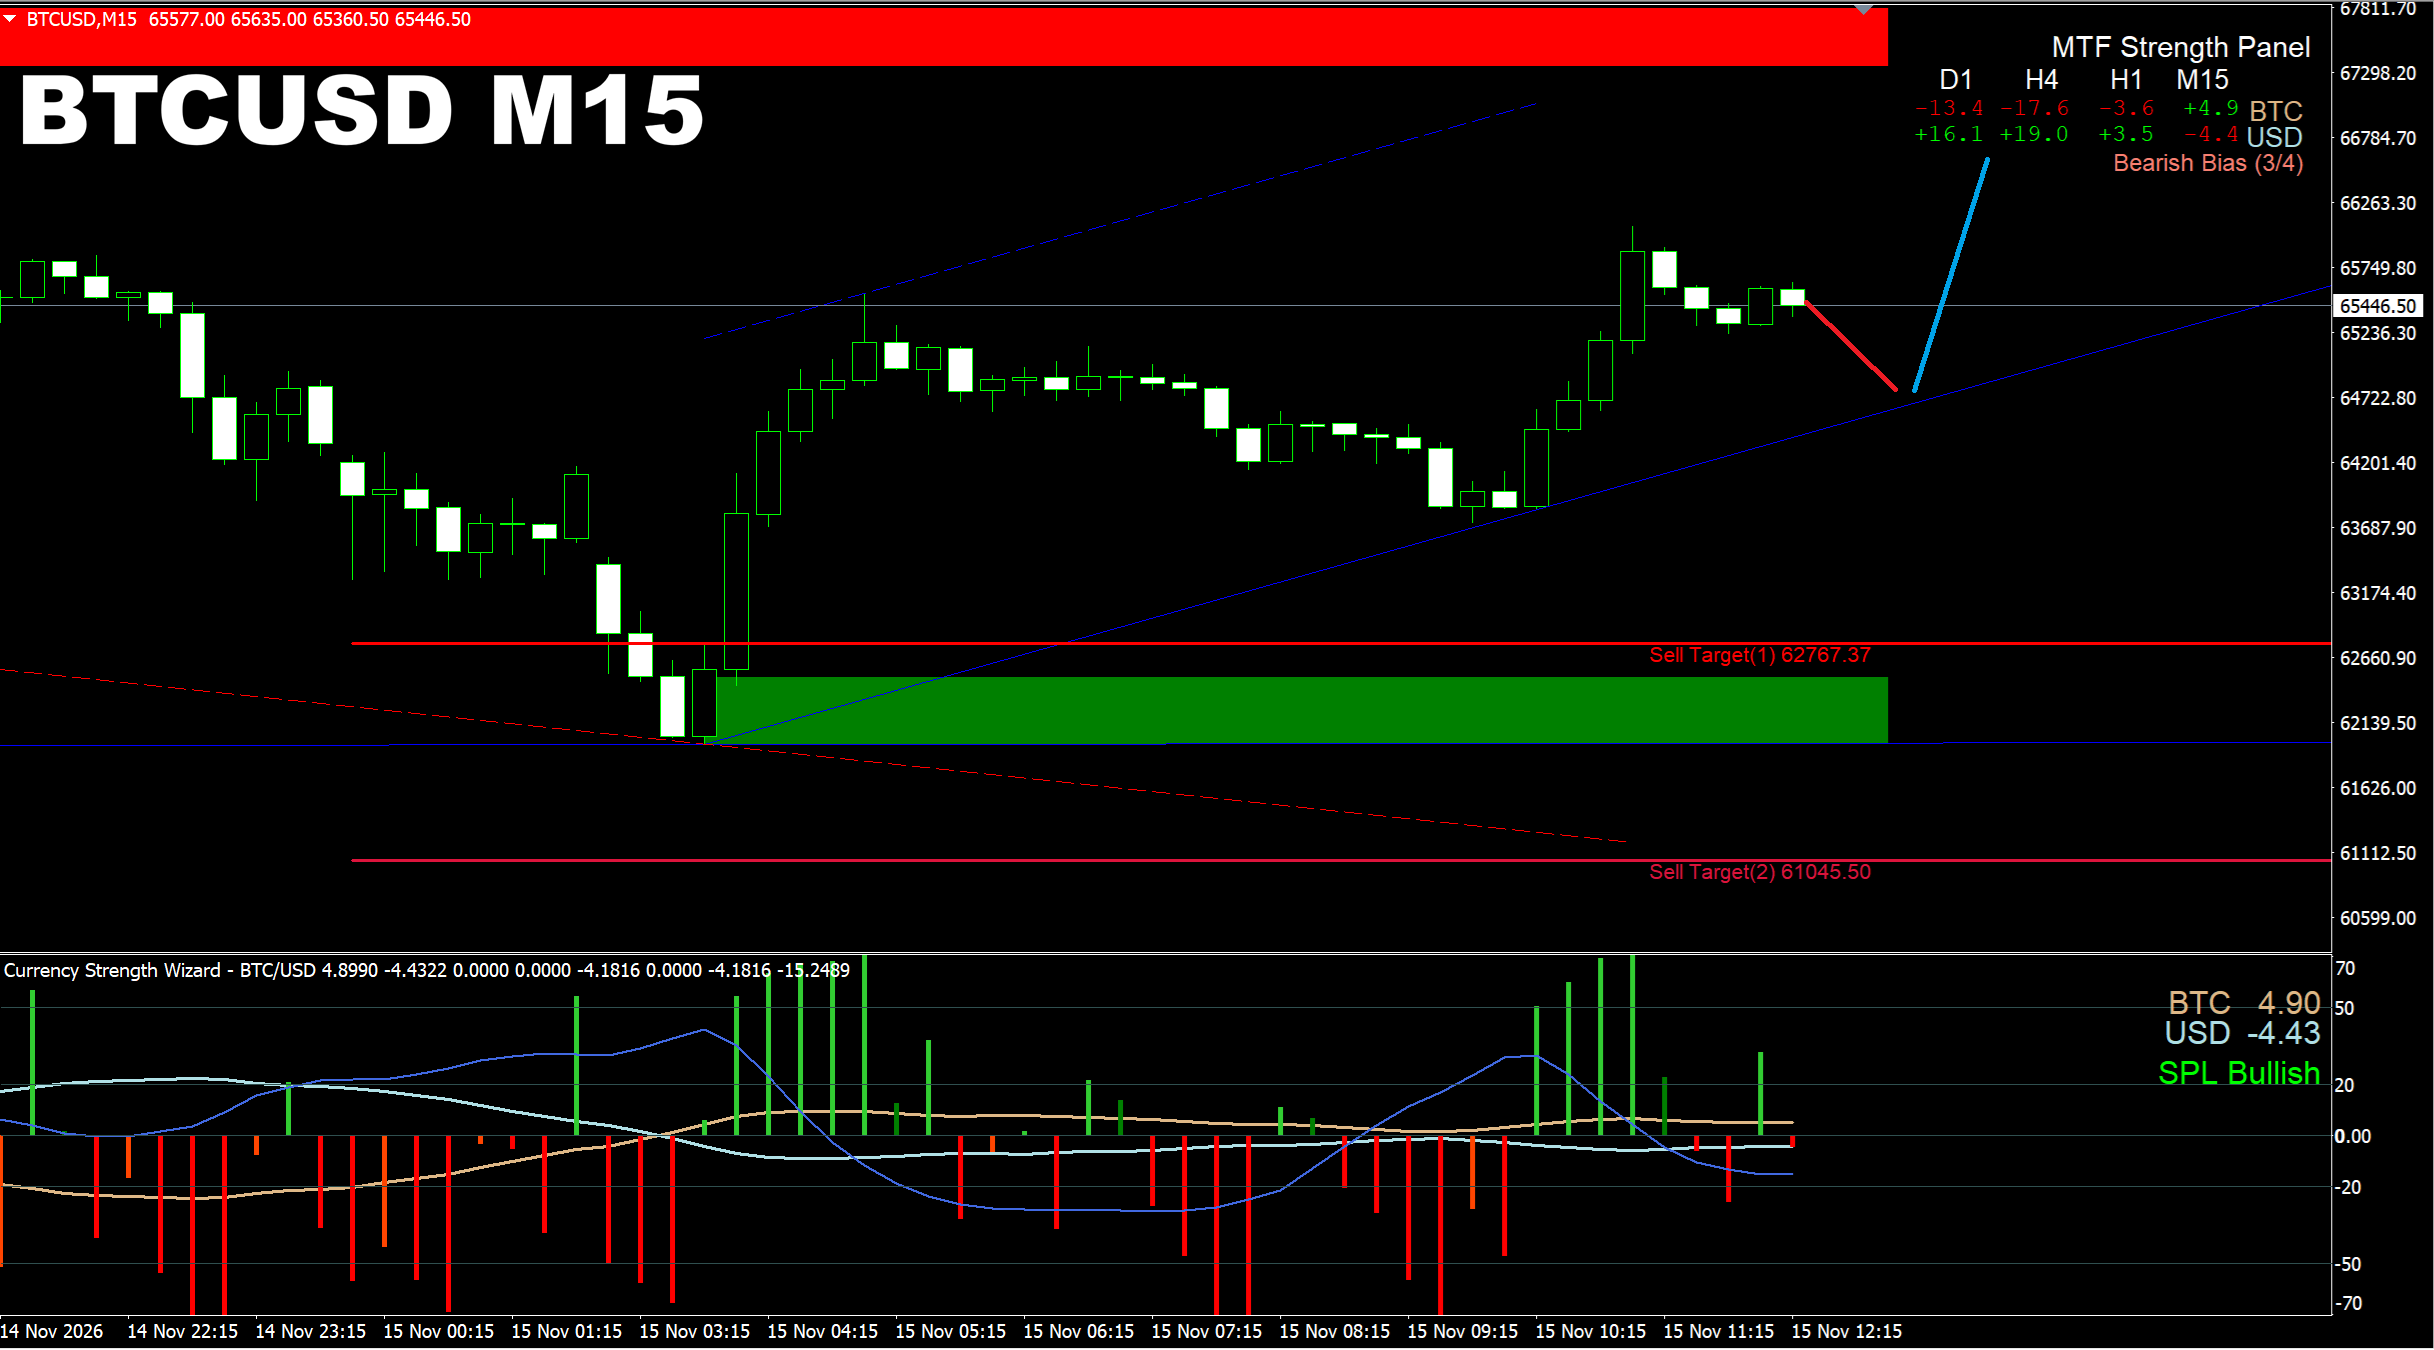
Currency Strength Wizard system. BTCUSD M15. Now let's check the M15 TF. See the width of the channel? So we need to keep this into consideration. So based on current volatility we may see downward movement as well. It means if want to have a good entry we need to do this after pullbacks. The strength bars can help us with this task and the channel itself too.
Oleg Rodin
Oleg Rodin
Currency Strength Wizard system. BTCUSD M30. Update on current market. Based on what we see here, the price is going toward the Resistance area which served as Support before. As the price usually goes form one SD area to another, we just need to determine the direction. Now we see that the retracement will probably continue due to strength factor, strong Support down below based on higher time frames and the SPL -20 which is a good factor that the up movement should continue for a while at least till the price reaches the Supply zone above. If you see there is also a Buy Target right above the SD area. So it means the price may hit it as well.