Published products

Most rated
The indicator generates entry signals for BINARY OPTIONS, drawing an arrow on the chart and emitting an audible alert. OPERATING HOURS: 6.OO GMT/ 17.00 GMT (not recommended after 17.00 GMT and during the night due to too low volatility and lack of volumes) PAIRS: EUR/USD (@EU6), GBP/USD (BP6). Timeframes: 1,2,3,5,10,15 minutes Best timeframe: 3 minutes EXPIRY: 1 candle The indicator needs real volumes (no tick volumes) to work: it doesn't work on EUR/USD, GBP/USD ECC spot pairs but on
THIS INDICATOR, BASED ON ARTIFICIAL INTELLIGENCE, identifies possible market reversal points by reading the footprint, and signals IN ADVANCE small market movements before they occur. Unlike price and volume indicators, which generate "late" entries, i.e. when a confirmation in price or volume has already occurred on a change in direction, and therefore often the movement has already ended, this indicator signals, based on what it reads in the footprint, "WHEN THE MOVEMENT SHOULD HAPPEN" and th
INDICATOR based on ARTIFICIAL INTELLIGENCE that generates possible call and put entries for binary options. the indicator works on 3 different strategies: 1) by reading volumes, it sends a signal when the price should reverse 2) through the divergence between price and volume, it sends a signal when the trend should continue or reverse 3) through the convergence between price and volume, it sends a signal when the trend should continue. the indicator works on all time frames, but
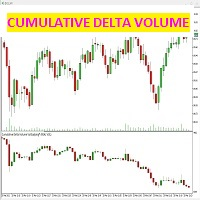
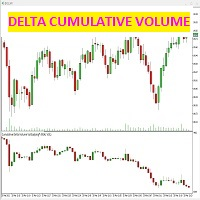
this indicator detects the difference between the contracts struck in bid and in ask (aggression) for each single candle. the indicator shows in the dedicated window below the price chart, candles given precisely by the difference between the contracts sold and purchased, which generate the volumetric strength of the market. it is possible (see from the screenshots) how to select only the cumulative candlestick delta chart, or even with a trendline of the candles themselves: by selecting th
this indicator shows the strength of the real volume against the price. if the price chart and the volume trend have the same trend, it means that everything is regular. if the indicator diverges from the price chart, it means that reversal is close. when the price goes up and the "volume convergence" chart goes down, it means that money is exiting the market, sellers are selling on the rise and the price should soon start to plummet. conversely, if the "volume convergence" graph goes up while
this indicator detects the difference between the contracts struck in bid and in ask (aggression) for each single candle. the indicator shows in the dedicated window below the price chart, candles given precisely by the difference between the contracts sold and purchased, which generate the volumetric strength of the market. it is possible (see from the screenshots) how to select only the cumulative candlestick delta chart, or even with a trendline of the candles themselves: by selecting th
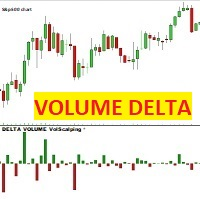
VOLUME DELTA Volscalping This indicator, for each price candle, draws a Delta candle, which is the difference between the contracts bought and sold. The candle will be red and negative if the contracts traded in the bid (sold) exceed those in the ask, on the contrary, the candle will be green and positive if the contracts traded in ASK (bought) exceed those in the bid. ATTENTION: The indicator only works with brokers that provide real market data flow, and that divide the contracts struck in
DELTA   VOLUME Volscalping This indicator, for each price candle, draws a Delta candle, which is the difference between the contracts bought and sold. The candle will be red and negative if the contracts traded in the bid (sold) exceed those in the ask, on the contrary, the candle will be green and positive if the contracts traded in ASK (bought) exceed those in the bid. ATTENTION: The indicator only works with brokers that provide real market data flow, and that divide the contracts struck
this indicator shows the strength of the real volume against the price. if the price chart and the volume trend have the same trend, it means that everything is regular. if the indicator diverges from the price chart, it means that reversal is close. when the price goes up and the "volume convergence" chart goes down, it means that money is exiting the market, sellers are selling on the rise and the price should soon start to plummet. conversely, if the "volume convergence" graph goes up while