• Overview
  • Reviews
  • Comments

Break of Structure

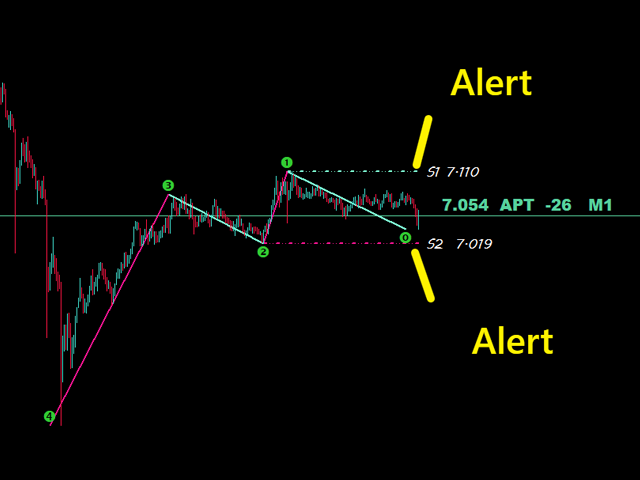
Market structures are the one which when breakout in higher timeframe may help clears a trend to a trader.

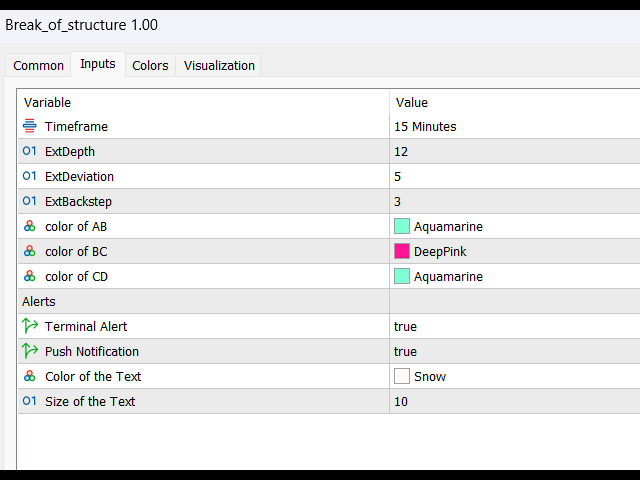
1. This indicator will draw ZigZag to only last 2 structures (previous high and low of ZigZag ) and a new bar of ZigZag will be only formed when break of structure happens

2. It gives Terminal and Push notificationon break of structure

3. Increase and Decrease Extdepth of ZigZag from "[" and "]" keys to adjust swing

4. Change colors of Line AB BC and CD

5. Add to many charts and get alerts on multiple symbols

6. Use left and right arrow keys to change chart from the symbols which are selected in marketwatch.

IF you are looking for Break of Structure Multi ExtDepth Breakout Multi Symbol Scanner you can use this product : Multi Symbol Multi ExtDepth ZigZag Breakout Scanner


Recommended products
DM IND Exclusive
Sergio Vidal Prado
Indicador Para Opções Binarias. Indicator for Binary Options Usa dois gales. Instalar em mt5 Esse indicador é para ser usado no tempo de vela de 5 minutos e em M5. Este também funciona em M1, porém é mais eficiente em M5. Só descompactar e copiar os arquivos na pasta de dados do seu MT5. Arquivos indicator na pasta MQL5 - Indicator. Baixe também a Media Movel totalmente gratis: https://www.mql5.com/pt/market/product/50400 Esse Indicador é para a próxima vela. Apareceu a seta, só aguardar a pr
Signal Eskiya, in addition to channel lines, reflects entry signals in the form of arrows. Trading strategies using the channel indicator belong to the classic methods of technical analysis, are easy to execute, and therefore available even to beginners. Price ranges work equally well on any trading assets and timeframes, they can be used both independently and with additional confirmation from oscillators and market volumes. American traders say: “Trend is your friend”, which means “Trend is
SMA Fibonacci EA
Christoph Kreher
Simple EA with 1 SMA and Fibonacci. The Expertadvisor opens positions in the direction of the trend when price levels have exceeded or fallen below the Fibonacci levels. It depends on the market in question and which parameters to use. The EA is programmed in such a way that optimization runs consume little time. A news filter and filter by day of the week are built in.
HenGann
Ehsan Kariminasab
Hengann Sq, using artificial intelligence, mathematical algorithms, Fibonacci, 9 Gann and Fibonacci square strategy, which enables us to have win rate of 200% profit per month. Initial investment for minimum capital of $100 to $1000, you be able to adjust the volume, date, hour, day and profit limit. adjustable profit limit in both buy and sell positions. Able to place orders in all time frames from 5 minutes to a week. further adjustment enables you to open the position according your de
Best swing
Winsou Cedric Anicet Kpanou
-- BEST SWING  -- L'indicateur BEST SWING est un indicateur technique personnalisé, un excellent outil pour négocier les cassures en fonction des niveaux de support et de résistance horizontaux. L'indicateur BEST SWING utilise une formule complexe en analysant des données de prix autrement incongrues sur les cours de clôture de chaque période, ainsi que les hauts et les bas du prix, afin de donner un aperçu de la force ou de la faiblesse de la tendance du marché et de sa probabilité
Automatically plots the 'Golden Fibonacci Ratio’ between the High and Low of the previous day... ...Highs and Lows are great Support and Resistance zones. Breakouts of Fibonacci levels are key points for entry and exit of trades. Pink lines indicate that the previous day's Candle closed lower. Blue colored lines indicate that the previous day's Candle closed higher.
SupportResistence
Eduardo Borges Mariani
SupportResistance is a dynamic support and resistance indicator based on the high and low of the previous candles. The calculation parameters are configurable. You can use the maximum and minimum values of the previous candle as a reference, or you can use the maximum and minimum of a group of previous candles. The indicator uses a red line to indicate resistance and a green line to indicate support. When a support or resistance is broken, its line is dotted, being restored only when it b
This indicator allows you to show fibonacci levels labels with big font size . It supports up to 25 fibonacci levels - As soon as you draw fibonacci it shows the levels you added as input parameter with big font size with the color and font you choose. Customizable options : 1. Fibo Text Font 2. Fibo Text Size 3. Fibo Text Color 3. Add description to each level 4. Other options such as Anchors and Degrees
mql4 version:  https://www.mql5.com/en/market/product/44606   Simple indicator to calculate profit on fibonacci retracement levels with fixed lot size, or calculate lot size on fibonacci levels with fixed profit. Add to chart and move trend line to set the fibonacci retracement levels. Works similar as default fibonacci retracement line study in Metatrader. Inputs Fixed  - select what value will be fix, lot or profit Fixed value  - value that will be fix on all levels Levels  - levels for which
Santo Oscilator
Gustavo Goncalves
5 (1)
Oscilador bem próximo que o indicador SANTO mostrado pelo Bo Williams em sua metodologia PhiCube, para mim este indicador ainda é melhor que o próprio SANTO original. Ótimo para entender a força e tendência de movimentos e possíveis divergências. Preço fazendo topo e o SANTO não renovando máxima, tudo indica que teremos uma reversão ou no mínimo um drawback.
FibExtender
Syed Oarasul Islam
This Indicator draws Fibonacci Extension levels in two different ways. You can select whether to draw Fibonacci Extension levels based on your favourite ZigZag settings or you can let the indicator to draw Fibonacci Extension  level based on given number of Bars or Candles.  You can also set Mobile and Email notification for your favourite Extension  levels individually. With this indicator you will not have to feel lonely as the it can generate Voice alerts, which will keep you focused on your
Read Elliott wave principle automatically. With the Swing Reader, you can easily read the Elliott Wave Principle through an automatic system. With swing, we mean a ZigZag market that is created by a breakout of its standard deviation. You can set the deviation manually, or you can let the indicator do it automatically (setting the deviation to zero). Advantages you get Never repaints. Points showing a horizontal line, in which statistically a long wave ends. Candles showing a vertical line in
ArcTracer
Syed Oarasul Islam
This Indicator draws Fibonacci Arc levels in two different ways. You can select whether to draw Fibonacci Arc levels based on your favourite ZigZag settings or you can let the indicator to draw Arc levels based on given number of bars or candles.  You can also set Mobile and Email notification for your favourite Arc levels individually. With this indicator you will not have to feel lonely as the it can generate Voice alerts, which will keep you focused on your trading and remove boredom.  Produc
FIBO Trend PRO mt5
Evgenii Aksenov
5 (4)
The indicator allows you to instantly determine the current trend by color and FIBO levels. Higher Timeframe the panel shows the current trend of higher periods, helping to determine the strength of the trend. Trade according to the trend when changing the color of candles or trade against the trend when the price hit the extreme levels of the FIBO Trend PRO  indicator   Advantages of the FIBO Trend PRO Indicator never repaint and does not change their values Very easy to use and intuitive App
Fibonacci decorator is a unique product that decorates Fibonacci objects. This indicator can change the specific level line of a Fibonacci object. This tool caters to both beginners and advanced traders using Fibonacci objects. Advantages Supports three Fibonacci objects: Fibonacci Retracement Fibonacci expansion Fibonacci time zones Just add the mark of your choice to the description of a Fibonacci object's level Easy setting This indicator does not work well with Strategy Tester. Please down
Santa Trend
Marco Aurelio Cestari
4.22 (9)
Santa Trend Indicator  is an efficient way to forecast and detect the trend in any market. Advantages Generates instant buy and sell signals. Provides an alternate exit strategy to your existing trading system. Never repaints, never backpaints, never recalculates. Works in all symbols and all timeframes. Perfect trend filter for any strategy or expert advisor. Fully compatible with Expert Advisor (EA) development. Does not lag.
FREE
VWAP Cloud
Flavio Javier Jarabeck
4.38 (13)
Do you love VWAP? So you will love the VWAP Cloud . What is it? Is your very well known VWAP indicator plus 3-levels of Standard Deviation plotted on your chart and totally configurable by you. This way you can have real Price Support and Resistance levels. To read more about this just search the web for "VWAP Bands" "VWAP and Standard Deviation". SETTINGS VWAP Timeframe: Hourly, Daily, Weekly or Monthly. VWAP calculation Type. The classical calculation is Typical: (H+L+C)/3 Averaging Period
FREE
I recommend you to read the  product's blog  (manual) from start to end so that it is clear from the beginning what the indicator offers. This multi time frame and multi symbol supply and demand zone dashboard indicator sends alerts when the price has reached a supply/demand zone. It is also possible to use it to be alerted about regular double tops/bottoms instead of zones. It can be used with all time frames from M1 to MN. Maximum 9 time frames can be shown in the dashboard at the same time. 
High frequency arbitrage brushing orders! Attention! Attention! Attention!: Low cost and low point platforms are necessary for brushing orders. Please review first and then simulate trading. Do not directly conduct actual trading and test suitable trading varieties A set of arbitrage brushing strategies developed after years of research and development Suggested variety of gold
MT4 version :  https://www.mql5.com/en/market/product/90395 Introducing the No Marti No Party Expert Advisor : A Revolutionary Complex Logic Trading System The No Marti No Party Expert Advisor (EA) represents the pinnacle of trading technology, incorporating a highly intricate and interdependent web of logic to provide unparalleled trading insights and generate profitable trades. Developed by a team of expert mathematicians, statisticians, and seasoned traders, this EA harnesses the power of a
Simple indicator to calculate fibonacci retracement levels on time. Add to chart and move trend line to set the fibonacci retracement levels. Inputs Levels  - levels for which to calculate values, separated by space, default are fibonacci levels Show time  - if true, time will be shown on levels Show date  - if true, date will be shown on levels Show fibonacci level  - if true, value of levels will be shown Fibonacci lines color  - color of levels Trend line color  - color of trend line which de
FREE
A useful feature may be to determine the normal frequency of round-sized trades, and monitor deviations from that expected value. The ML algorithm could, for example, determine if a larger-than-usual proportion of round-sized trades is associated with trends, as human traders tend to bet with a fundamental view, belief, or conviction. Conversely, a lower-than-usual proportion of round-sized trades may increase the likelihood that prices will move sideways, as silicon traders do not typically hol
The indicator ‘Probability Range Bands’ gives a prediction of the amount, how much the asset is moving from its current price. The range bands give probabilities, that the candle close will not exceed this certain price level. It is also called the expected move for the current candle close.   This Indicator is based on statistical methods, probabilities and volatility. Asset price is assumed to follow a log-normal distribution. Therefore, log returns are used in this indicator to determine the
Candle EA MT5
Mansour Babasafary
4.38 (40)
This expert is based on patterns The main patterns of this specialist are candlestick patterns Detects trends with candlestick patterns It has a profit limit and a loss limit, so it has a low risk The best time frame to use this expert is M30 time frame The best currency pairs to use with this expert is the EURUSD, GBPUSD, AUDUSD, USDCAD currency pairs The price will increase by 100$ after every 10 purchases! Final price 2450$ Get a 50% bonus by buying (or even renting) any of our product
Bar Sequential
Maximiliano Frisione Figueroa
This indicator can help you clearly identify trend changes in both bullish and bearish markets. The indicator compares the closing price of the last candle with the closing price of the candle "X" periods ago (input parameter). In an uptrend, an initial number '1' is plotted if a candle closes higher than the closing of a candle "X" periods ago. In a downtrend, an initial number '1' is plotted if a candle closes below the closing of a candle "X" periods ago. Subsequent numbers are plotted when e
Zigzag X Fibo
Ian David Emmanuel Bello
The ZigZag indicator's main objective is to highlight significant price movements by filtering out minor price fluctuations. It enables the visualization of trends by eliminating market "noise," which can assist traders in making more informed decisions. Adding the Fibonacci indicator, which is a powerful tool for identifying potential support and resistance levels in financial markets.
Descriptions A point point is a technical analysis indicator, or calculations, used to determine the overall trend of market over different time frames. This indicator calculate the highest or lowest pivots among left x and right y bars and show the high/low level during that period.   From that, you could clearly see the top resistance & bottom support level and how market goes break out. Instructions pivotLeft - pivot left bar count pivotRight - pivot right bar count pivotHighColor - c
Utilities
Douglas Lucio De Araujo
Indicator with 3 features - Clock : Clock independent of the chart, counting continues even when the market is closed. - Template : After setting up a configuration in any graphic, be it color patterns, indicators, zoom ... The configuration will be copied to all active graphics. - TimeFrame : Set the TimeFrame on a chart, and with just one click all the active charts will be changed to the same TimeFrame.
Analyze potential   Covered Call   structures in the Brazilian market. Define where you want the break-even of your structure and see what structure to use. It works for any asset that has authorized series of options on B3 (Brazilian Stock Exchange). Associate the indicator to the asset you want to set up the Covered Call. *** ATENTION *** For the robot to work, the service that consults the authorized series of B3 options must be running on your terminal. Download the utility for free from
FREE
This Automatic support/resistance indicator calculates various peaks and troughs of the price action, identifies relevant levels and draws support and resistance automatically. It uses the built-in "ZigZag" indicator in Metatrader as a data source hence, very much accurate indicator.  The support and resistance lines are contineusely updated as new levels and formed. The indicator has only 5 parameters to set, and mostly it can be used with the default values:  The description of the settings is
Buyers of this product also purchase
First of all Its worth emphasizing here that this Trading System is Non-Repainting , Non-Redrawing and Non-Lagging Indicator , Which makes it ideal from both manual and robot trading .  The Smart Trend Trading System MT5 is a comprehensive trading solution tailored for new and experienced traders . It combines over 10 premium indicators and features more than 7 robust trading strategies , making it a versatile choice for diverse market conditions . Trend Following Strategy : Provides precise ent
Atomic Analyst MT5
Issam Kassas
4.27 (11)
First of all Its worth emphasizing here that this Trading Indicator is   Non-Repainting ,   Non-Redrawing   and   Non-Lagging   Indicator, Which makes it ideal from both manual and robot trading.  The Atomic Analyst  is a PA Price Action Indicator that uses Strength and Momentum of the price to find a better edge in the market. Equipped with an AI filter which help remove noises and false signals, and Increase Trading Potential. Using Multiple layers of complex Indicators, the Atomic Analyst
FX Volume MT5
Daniel Stein
4.94 (17)
Visit our all-new   Stein Investments Welcome Page   to get the latest information, updates and trading strategies. FX Volume is the FIRST and ONLY volume indicator that provides a REAL insight into the market sentiment from a broker's point of view. It provides awesome insights into how institutional market participants, like brokers, are positioned in the Forex market, much faster than COT reports. Seeing this information directly on your chart is the real game-changer and breakthrough solut
Quantum Trend Sniper
Bogdan Ion Puscasu
5 (37)
Introducing   Quantum Trend Sniper Indicator , the groundbreaking MQL5 Indicator that's transforming the way you identify and trade trend reversals! Developed by a team of experienced traders with trading experience of over 13 years,   Quantum Trend Sniper Indicator   is designed to propel your trading journey to new heights with its innovative way of identifying trend reversals with extremely high accuracy. ***Buy Quantum Trend Sniper Indicator and you could get Quantum Breakout Indicator fo
Gold Stuff mt5
Vasiliy Strukov
4.89 (166)
Gold Stuff mt5 is a trend indicator designed specifically for gold and can also be used on any financial instrument. The indicator does not redraw and does not lag. Recommended time frame H1. Contact me immediately after the purchase to get   personal bonus! Settings  and manual   here   SETTINGS Draw Arrow - on off. drawing arrows on the chart. Alerts -   on off audible alerts. E-mail notification - on off. email notifications. Puch-notification - on off. Push notifications. Next, adjust the co
Trend Screener Pro MT5
STE S.S.COMPANY
4.89 (61)
Unlock the Power of  Trends trading with Trend Screener Indicator: Your Ultimate Trend Trading Solution powered by fuzzy logic and Multi-currencies System ! Elevate your trend trading with Trend Screener, the revolutionary trend indicator powered by   fuzzy logic.  It is a powerful trend-following indicator that combines over  13 premium tools and features and 3 trading strategies  , making it a versatile choice to   make your Metatrader a Trend Analyzer. LIMITED TIME OFFER : Trend Screener Indi
RelicusRoad Pro MT5
Relicus LLC
4.82 (22)
How many times have you bought a trading indicator with great back-tests, live account performance proof with fantastic numbers and stats all over the place but after using it, you end up blowing your account? You shouldn't trust a signal by itself, you need to know why it appeared in the first place, and that's what RelicusRoad Pro does best! NOW $147 (increasing to $499 after a few updates) - UNLIMITED ACCOUNTS (PCs or MACs) **  User Manual + Strategies + Training Videos + Private Group with
First of all Its worth emphasizing here that this Trading Tool is Non Repainting , Non Redrawing and Non Lagging Indicator , Which makes it ideal for professional trading . The Smart Price Action Concepts Indicator is a very powerful tool for both new and experienced traders . It packs more than 20 useful indicators into one , combining advanced trading ideas like Inner Circle Trader Analysis and Smart Money Concepts Trading Strategies . This indicator focuses on Smart Money Concepts , prov
Top indicator for MT5   providing accurate signals to enter a trade without repainting! It can be applied to any financial assets:   forex, cryptocurrencies, metals, stocks, indices .  Watch  the video  (6:22) with an example of processing only one signal that paid off the indicator! MT4 version is here It will provide pretty accurate trading signals and tell you when it's best to open a trade and close it. Most traders improve their trading results during the first trading week with the help of
FX Power MT5 NG
Daniel Stein
5 (4)
Trading GOLD, and currencies, with the dog walk strategy  - super smart Trading GOLD, and currencies, with the breakout strategy  - super easy Visit our all-new   Stein Investments Welcome Page   to get the latest information, updates and trading strategies. FX Power MT5 NG  is the next generation of our long-time very popular currency strength meter, FX Power.  And what does this next-generation strength meter offer? Everything you have loved about the original FX Power  PLUS GOLD/XAU st
Advanced Supply Demand MT5
Bernhard Schweigert
4.53 (15)
Best Solution for any Newbie or Expert Trader! This indicator is a unique, high quality and affordable trading tool because we have incorporated a number of proprietary features and a new formula. With this update, you will be able to show double timeframe zones. You will not only be able to show a higher TF but to show both, the chart TF, PLUS the higher TF: SHOWING NESTED ZONES. All Supply Demand traders will love it. :) Important Information Revealed Maximize the potential of Advanced Suppl
Auto Order Block with break of structure based on ICT and Smart Money Concepts Futures Break of Structure ( BoS )             Order block ( OB )            Higher time frame Order block / Point of Interest ( POI )    shown on current chart           Fair value Gap ( FVG ) / Imbalance   ,  MTF      ( Multi Time Frame )    Volume Imbalance     ,  MTF          vIMB Gap’s Equal High / Low’s     ,  MTF             EQH / EQL Liquidity               Current Day High / Low           HOD /
XQ Indicator MetaTrader 5
Marzena Maria Szmit
5 (1)
Step into the realm of Forex trading with confidence and precision using XQ, a cutting-edge Forex indicator designed to elevate your trading game to unprecedented heights. Whether you're a seasoned trader or just stepping into the world of currency exchange, XQ Forex Indicator empowers you with the insights and signals needed to make informed trading decisions. The signal conditions are a combination of three indicators, and XQ Forex Indicator only display  medium and long-term trends . The ind
ICT, SMC, SMART MONEY CONCEPTS, SMART MONEY, Smart Money Concept, Support and Resistance, Trend Analysis, Price Action, Market Structure, Order Blocks, BOS/CHoCH,   Breaker Blocks ,  Momentum Shift,   Supply&Demand Zone/Order Blocks , Strong Imbalance,   HH/LL/HL/LH,    Fair Value Gap, FVG, Inversion FVG, IFVG,  Premium  &   Discount   Zones, Fibonacci Retracement, OTE, Buy Side Liquidity, Sell Side Liquidity, BSL/SSL Taken, Equal Highs & Lows, MTF Dashboard, Multiple Time Frame, BigBar, HTF OB
Blahtech Supply Demand MT5
Blahtech Limited
4.57 (14)
Was: $299  Now: $99   Supply Demand uses previous price action to identify potential imbalances between buyers and sellers. The key is to identify the better odds zones, not just the untouched ones. Blahtech Supply Demand indicator delivers functionality previously unavailable on any trading platform. This 4-in-1 indicator not only highlights the higher probability zones using a multi-criteria strength engine, but also combines it with multi-timeframe trend analysis, previously confirmed swings
Profit from market structure changes as price reverses and pulls back. The market structure reversal alert indicator identifies when a trend or price move is approaching exhaustion and ready to reverse. It alerts you to changes in market structure which typically occur when a reversal or major pullback are about to happen. The indicator identifies breakouts and price momentum initially, every time a new high or low is formed near a possible exhaustion point. The indicator draws in a rectangle on
Gann Squares Indicator: Analyzing Markets with Geometric Patterns The Gann Squares indicator is a powerful tool for market analysis that draws upon the mathematical concepts introduced by W.D. Gann in his article on "Mathematical Formula for Market Predictions." This indicator incorporates Gann's techniques involving square numbers such as 144, 90, and 52, as well as the Square of 9. Additionally, it incorporates  method for utilizing the Square of 9 in conjunction with channels and the star pa
AW Trend Predictor MT5
AW Trading Software Limited
4.76 (54)
The combination of trend and breakdown levels in one system. An advanced indicator algorithm filters market noise, determines the trend, entry points, as well as possible exit levels. Indicator signals are recorded in a statistical module, which allows you to select the most suitable tools, showing the effectiveness of the signal history. The indicator calculates Take Profit and Stop Loss marks. Manual and instruction ->  HERE  / MT4 version ->  HERE How to trade with the indicator:  Trading wit
Volume by Price MT5
Brian Collard
5 (3)
The Volume by Price Indicator for MetaTrader 5 features Volume Profile and Market Profile TPO (Time Price Opportunity). Get valuable insights out of currencies, equities and commodities data. Gain an edge trading financial markets. Volume and TPO histogram bar and line charts. Volume Footprint charts. TPO letter and block marker charts including split structures. Versatile segmentation and compositing methods. Static, dynamic and flexible ranges with relative and/or absolute visualizations. Lay
TrendLine PRO MT5
Evgenii Aksenov
4.78 (49)
The Trend Line PRO indicator is an independent trading strategy. It shows the trend change, the entry point to the transaction, as well as automatically calculates three levels of Take Profit and Stop Loss protection Trend Line PRO is perfect for all Meta Trader symbols: currencies, metals, cryptocurrencies, stocks and indices Advantages of Trend Line PRO Never redraws its signals The possibility of using it as an independent strategy It has three automatic levels Take Profit and Stop Loss lev
MetaBands M5
Vahidreza Heidar Gholami
4.67 (3)
MetaBands uses powerful and unique algorithms to draw channels and detect trends so that it can provide traders with potential points for entering and exiting trades. It’s a channel indicator plus a powerful trend indicator. It includes different types of channels which can be merged to create new channels simply by using the input parameters. MetaBands uses all types of alerts to notify users about market events. Features Supports most of the channel algorithms Powerful trend detection algorith
Introducing   Quantum Breakout PRO , the groundbreaking MQL5 Indicator that's transforming the way you trade Breakout Zones! Developed by a team of experienced traders with trading experience of over 13 years,   Quantum Breakout PRO   is designed to propel your trading journey to new heights with its innovative and dynamic breakout zone strategy. Quantum Breakout Indicator will give you signal arrows on breakout zones with 5 profit target zones and stop loss suggestion based on the breako
Owl Smart Levels MT5
Sergey Ermolov
4.47 (36)
MT4 version  |   FAQ The Owl Smart Levels Indicator is a complete trading system within the one indicator that includes such popular market analysis tools as Bill Williams' advanced fractals , Valable ZigZag which builds the correct wave structure of the market, and Fibonacci levels which mark the exact levels of entry into the market and places to take profits. Detailed description of the strategy Instructions for working with the indicator Advisor-assistant in trading Owl Helper Private User
Gartley Hunter Multi
Siarhei Vashchylka
5 (5)
Gartley Hunter Multi - An indicator for searching for harmonic patterns simultaneously on dozens of trading instruments and on all classic timeframes: (m1, m5, m15, m30, H1, H4, D1, Wk, Mn). Manual (Be sure to read before purchasing) | Version for MT4 Advantages 1. Patterns: Gartley, Butterfly, Shark, Crab. Bat, Alternate Bat, Deep Crab, Cypher 2. Simultaneous search for patterns on dozens of trading instruments and on all classic timeframes 3. Search for patterns of all possible sizes. Fr
Trend Line Map Pro MT5
STE S.S.COMPANY
4.67 (9)
Trend Line Map indicator is an addons for   Trend Screener Indicator . It's working as a scanner for all signals generated by Trend screener ( Trend Line Signals ) . It's a Trend Line Scanner based on Trend Screener Indicator.  If you don't have Trend Screener Pro Indicator,   the Trend Line Map Pro will not work.     LIMITED TIME OFFER : Trend Line Map Indicator is available for only 50 $ and lifetime. ( Original price 125$ ) By accessing to our MQL5 Blog,  you can find all our premium indica
TrendDecoder Premium MT5
Christophe, Pa Trouillas
5 (1)
Identify ranges  | Get earliest signals of Trends  | Get clear exits before reversal  | Spot the Fibo levels the price will test   |  Non-repainting, non-delayed indicator - ideal for manual and automated trading - for all assets and all time units $69   for launch - then back to >>   $149 After purchase,   please contact me on this channel   for recommended and personalised settings MT4   version:  Click here Get our full method with  BladeSCALPER  and   PowerZONES What is it about? TrendDE
TPSproTREND PrO MT5
Roman Podpora
5 (5)
TPSpro TRENDPRO  - is a trend indicator that automatically analyzes the market and provides information about the trend and each of its changes, as well as giving signals for entering trades without redrawing! The indicator uses each candle, analyzing them separately. referring to different impulses - up or down impulse. Exact entry points into transactions for currencies, crypto, metals, stocks, indices!  -  Version MT4                  DETAILED DESCRIPTION        /       TRADING SETUPS       
Was: $249  Now: $99   Market Profile defines a number of day types that can help the trader to determine market behaviour. A key feature is the Value Area, representing the range of price action where 70% of trading took place. Understanding the Value Area can give traders valuable insight into market direction and establish the higher odds trade. It is an excellent addition to any system you may be using. Inspired by Jim Dalton’s book “Mind Over Markets”, this indicator is designed to suit the
Golden Spikes Detector
Batsirayi L Marango
5 (1)
Golden Spikes Detector This indicator is based on an advanced strategy primarily for trading spikes on Boom and Crash Indices. Complex algorithms were implemented to detect high probability entries only. It alerts on potential Buy and Sell entries. To trade spikes on the Deriv or Binary broker, only take Buy Boom and Sell Cash alerts. It was optimised to be loaded on 5-minute timeframe although multiple timeframe analysis is done in the background. Features ·             Desktop pop up and sound
Matrix Arrow Indicator MT5
Juvenille Emperor Limited
5 (14)
Matrix Arrow Indicator MT5  is a unique 10 in 1 trend following   100% non-repainting  multi-timeframe indicator that can be used on all symbols/instruments:   forex,   commodities,   cryptocurrencies,   indices,   stocks .  Matrix Arrow Indicator MT5  will determine the current trend at its early stages, gathering information and data from up to 10 standard indicators, which are: Average Directional Movement Index (ADX) Commodity Channel Index (CCI) Classic Heiken Ashi candles Moving Aver
More from author
This library will allow you to manage trades using any of your EA and its very easy to integrate on any EA which you can do yourself with the script code which is mentioned in description and also demo examples on video which shows the complete process. This product allows trading operations via API For chart : Renting Crypto Charting for OHLC data or Crypto Ticks with Order Book Depth is optional If your EA is HFT and operations on seconds chart, You may be interested in converting charts to se
Crypto Charting
Rajesh Kumar Nait
5 (3)
Cryptocurrency Charts for MT5. Features : 1. Live OHLC Chart via Websocket (wss) 2. Update History of Bars from API 3. Auto Update history on charts when MT5 is restarted to make sure there is no missing data in Bars and is always kept up to dated like native chart 4. Scheduled History update from API : In case of there is internet disconnection for a millisecond, bar ohlc value may be incorrect as websocket is streaming protocol. To reduce this 1-2% chances of error, we added a feature Schedule
Multi Currency Previous Candle or Previous Bar Scanner helps you scan multi symbol charts with any custom timeframe which you select from indicator settings. Based on product : https://www.mql5.com/en/market/product/110229 It can be used to scan multi symbols for Previous Day high low, Previous week high low, Previous month High low or any custom timeframe e.g. Previous 4 hour chart high low It filters noise and gives directional alerts when price touches High or low line  The strategy is sim
Perfect Seconds chart indicator allows you to convert minute candles of live data into seconds 1. Choose any number of seconds to close a bar 100% with accurate time. 2. This is Live OHLC rates based data, It works even if ticks are not available. 3. No external DLL required, it works smoothly on VPS 4. Fast and optimized code 5. Supports Crypto Pairs such as BInance, Kucoin and all other exchanges where Futures live chart can be converted into seconds easily. 6. Support all type of symbols such
This library will allow you to manage trades using any of your EA and its very easy to integrate on any EA which you can do yourself with the script code which is mentioned in description and also demo examples on video which shows the complete process. This product allows trading operations via API and does not include charts. Users may use charts from brokers who provides Crypto and send orders to binance e.g. ByBit Demo server available on MT4 provides symbols for crypto. - Supports One way a
This indicator finds Double Top and Double bottom Example : What is Double Top When price establishes a new high and then falls, then reverse to the same candle area of High then its considered a valid double top and vice versa for double bottom. 1. It plots and high and low on visible chart if ChartChange is set to true else it searches on new bar opening 2. If there is double top and double bottom found in visible chart window then it plots a line 3. It has options to customize text color, te
FREE
Real Spinning Top Indicator  It detects accurate spinning top on chart with balanced body and wick height ratio which is the true meaning of spinning top which differs it from Hammers and Doji or Null Candlestick. This indicator plots an wingdings icon at number of spinning tops found on the chart. Settings include Number of Bars : To adjust search on number of bars Color of Icon :change color of icon Icon code : change code of wingdings for icon
FREE
Add this indicator to chart and set the ExtDepth Setting of ZigZag  It gives instant alert when Price touches trendline Upper, Lower or Middle channel Features : -Enable / Disable alerts on upper, lower or middle line - Add pause after a alert in seconds - Pause or Unpause Trend channel with button on chart - Add early alerts by adding points in input field, for example ETH price is 2900.25 here the digits 25 is "point", so if you add 25 in input field in points and if the value of lower l
Crypto Ticks and Depth
Rajesh Kumar Nait
5 (1)
Cryptocurrency Live Tick Data Bid and Ask and Book Depth for EA Available Exchange : 1. Binance Spot (Supports Order Book Depth on active chart window) realtime Tick Data and Futures (Supports multiple Order Book Depth ) realtime Tick Data 2. Kucoin Spot and Futures, Supports Order Book depth on active chart window 3. Bybit Futures and Inverse Futures Tick Data Bid Ask Last Upcoming Exchange : OKX, MEXC and more.. Features : 1. Live Tick Data with Bid and Ask info 2.  Best Bid ask and quantit
Multi Symbol Double Click anywhere on chart to set price alert for MT4 and get notified from Terminal Alert or Push Notification 1. Add the EA Utility on chart 2. Browse chart by <- left or -> right arrow keys 3. Double click anywhere on chart and it will add a line, drag this line to set your desired price and voila, alert is set! When price will reach to the line it will notify you with either terminal or push notification as per utility's settings.  This alert will keep working even if you r
Binance Trading Tool for MT5 1. This product include live chart from websocket, historical chart, automatic updates on restart of mt5 terminal to make it run smooth with zero manual intervention that makes you experience to trade Binance smoothly. Trading, Live chart & Historical Data available for Spot and Futures How to use : 1. You need to add your API key and secret in Input field of this utility. When you create your API, make sure you enable Futures to trade Futures 3.  You
Cobra Levels
Rajesh Kumar Nait
Introducing Cobra Levels Watch the Tutorial video of backtest and accuracy : here These are 6 sets of levels with two frequency modes which works on universal market including forex, crypto, commodity, nifty and banknifty and other markets. They are published after best research on financial instruments. The purpose of these levels are to trade reversal crash and boom, use them to watch for overbought and oversold market condition and understand the market cycle of any symbol The upp
This indicator plots upto 6 levels which can be enable / disable to make chart cleaner as per trader's requirement You can get alerts on Previous Week Previous Day, Previous Month or high low of any period previous candle available in MT4 These 6 levels are in 2 sets : High and Low For each sets, different time frame can be selected It is based on strategy of Previous High Low reversal, as its considered that price usually show rejection in smaller timeframe like 5min when price reach Daily, W
Crypto to MT5
Rajesh Kumar Nait
Crypto.com to MT5 Live Candlestick Stream to Metatrader 5 from Crypto.com websocket Its a OHCLV (Open High Low Close Real Volume ) Live Rates Data you can check my other crypto product on my profile  https://www.mql5.com/en/users/rajeshnait/seller 1. OHLCV Data 2. Supports and Creates Multiple Symbols 3. You need to add Crypto.com websocket and api URL as mentioned at Tools > Options > Allow Webrequest from URL tab and also tick Allow Webrequest checkbox - Websocket URL : stream.crypto.com - API
Cobra Pivot Points is an indicator for plotting best optimized pivot points support and resistance levels which you can backtest yourself by downloading the DEMO. 1. Select 7 type of Pivot Mode : Cobra, Camarilla 1, Camarilla 2, Floor, Woodie, Demark and Fibonacci pivots 2. You can use any time frame to find pivot points support and resistance 3. You can play with Previous day High Low Close value with Shift parameter. 1 = Previous Bar, 2 = Bar before Previous bar and so on.. These parameter w
Pivot Points Multi Symbol Scanner scans all symbols available in marketwatch for Floor, Woodie, Camarilla, Demark or Fibonacci Pivot Points. You can select any timeframe to calculate pivot points and get alerts when price touch these levels of support and resistance. For visual Pivot Points You may be interested in this product : https://www.mql5.com/en/market/product/110231 It has options for choosing various alerts type You can choose and set frequency to scan in milliseconds 1000 me
Patterns Explorer for Triangle pattern such as symmetrical triangle, asymmetrical triangle or right angle triangle , Wedge pattern such as Rising wedge or Falling wedge, Expansion pattern and Trend Channel This indicator explores historical pattern as well as current patterns, It is the best indicator for those who are trying to save time from manually drawing trendline or triangle and want to use this for automated analysis of plotting best patterns on chart Features : - Panel for changing ZigZ
This indicator plots upto 6 levels which can be enable / disable to make chart cleaner as per trader's requirement These 6 levels are in 2 sets : High and Low For each sets, different timeframe can be selected It is based on strategy of Previous High Low reversal, as its considered that price usually show rejection in smaller timeframe like 5min when price reach Daily, Weekly or Monthly High Low Features : - Track upto 6 Timeframe High Lows in single chart - Set alerts on these levels, Mail, Pus
Kraken Crypto Exchange Futures History Update Panel Features : 1.  It will create symbol based on setting and update history fully which is available from Kraken API for the symbol. This panel updates history on Kraken Futures symbols with Open High Low Close data, It also Prints message when History Update is complete. Please note this is not LIVE Data.   3.  You need to add Kraken API URL as mentioned at Tools > Options > Allow Webrequest from URL tab and also tick Allow Webrequest checkbox
5 EMA Scalping Strategy Multi Symbol Scanner This EA utility will scan all symbols which are selected in marketwatch and alert when such condition is formed in chart when Candle low is above EMA 5 for Sell alert and Candle high is lower from EMA5 so you can be ready before selling or buying for scalping purpose on 5min chart For more details watch attached video Logic : When a candle closes above 5 EMA in 5 mins chart, Wait for its low to break and Sell when low is broken by wick, Your SL sh
Multi Symbol ZigZag Breakout Scanner scans all symbols selected in marketwatch. It will help finding double top, double bottom or any fibonacci extension level easily when price is about to reach those levels. You can select Timeframe, and multiple Extdepths (up to 3) of Zigzag. Recommended ZigZag are 21,34 and 55 which covers all types of Zigzag and filter noise You can set to receive either terminal alert or push notification or both Use cases : 1. To find Break of structure of order blocks
Fibo Musang FMBCR CB1 breakout multi symbol scanner for MT5 scans all symbols selected in marketwatch for dominan break Fibo Musang CB1 or Candle Break 1 is a strategy that works very well on Gold XAUUSD and other forex symbols. This scanner will help you scan mulltisymbol currencies very fast and get alerts on FMCBR CB1 breakout Please see video for more details as its completely customizable as per trader's preference: 1. You can select timeframe and History of Bars 2. You can modify your
Multi Symbol Double Click anywhere on chart to set price alert and get notified from Terminal Alert or Push Notification 1. Add the EA Utility on chart 2. Browse chart by <- left or -> right arrow keys 3. Double click anywhere on chart and it will add a line, drag this line to set your desired price and voila, alert is set! When price will reach to the line it will notify you with either terminal or push notification as per utility's settings.  This alert will keep working even if you restart te
Control Candle is the candlestick which holds multiple inside bars and are in control until its high low range is broken by close of any candlestick. When control candle is broken, price may act on these control candle as support and resistance. This indicator create rectangles on chart which will help you find control candles fast. Control candle indicator box is customizable by color, style, width and other options in indicator settings.
This indicator allows you to show fibonacci levels labels with big font size . It supports up to 25 fibonacci levels - As soon as you draw fibonacci it shows the levels you added as input parameter with big font size with the color and font you choose. Customizable options : 1. Fibo Text Font 2. Fibo Text Size 3. Fibo Text Color 3. Add description to each level 4. Other options such as Anchors and Degrees
This indicator efficiently tracks any other timeframe candlesticks which you want to track on same chart 1. Select any higher time frame to load bars on same chart 2. Customize colors and style of candlesticks 3. Choose number of bars to draw candlesticks 4. Track higher timeframe complete candles along with wick and body 5. Easy and convenient for those who dont want to switch chart.
Cobra Pivot Points is an indicator for plotting best optimized pivot points support and resistance levels which you can backtest yourself by downloading the DEMO. 1. Select 7 type of Pivot Mode : Cobra, Camarilla 1, Camarilla 2, Floor, Woodie, Demark and Fibonacci pivots 2. You can use any time frame to find pivot points support and resistance 3. You can play with Previous day High Low Close value with Shift parameter. 1 = Previous Bar, 2 = Bar before Previous bar and so on.. These parameter w
Multi Currency Previous Candle or Previous Bar Scanner helps you scan multi symbol charts with any custom timeframe which you select from indicator settings. Based on product : https://www.mql5.com/en/market/product/78657 It can be used to scan multi symbols for Previous Day high low, Previous week high low, Previous month High low or any custom timeframe e.g. Previous 4 hour chart high low It filters noise and gives directional alerts when price touches High or low line  The strategy is simp
Pivot Points Multi Symbol Scanner scans all symbols available in marketwatch for Floor, Woodie, Camarilla, Demark or Fibonacci Pivot Points. You can select any timeframe to calculate pivot points and get alerts when price touch these levels of support and resistance. For visual Pivot Points You may be interested in this product : https://www.mql5.com/en/market/product/110072 It has options for choosing various alerts type You can choose and set frequency to scan in milliseconds 1000 me
Filter:
No reviews
Reply to review