All pivots MTF dashboard MT5
- Indicators
- Sergey Efimenko
- Version: 1.5
- Updated: 7 September 2022
- Activations: 10
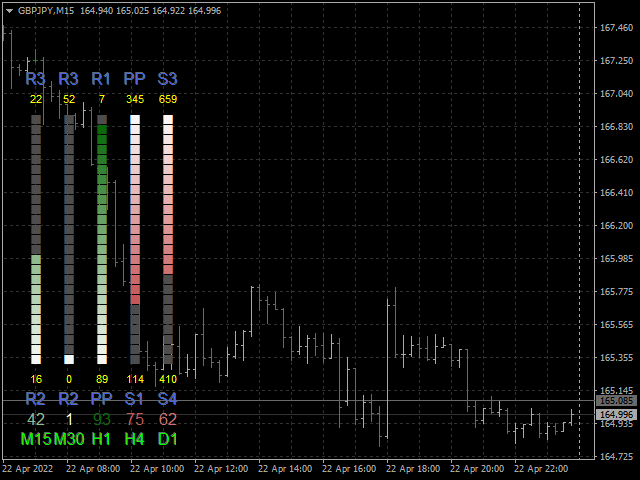
If you trade by levels, then this indicator is for you.
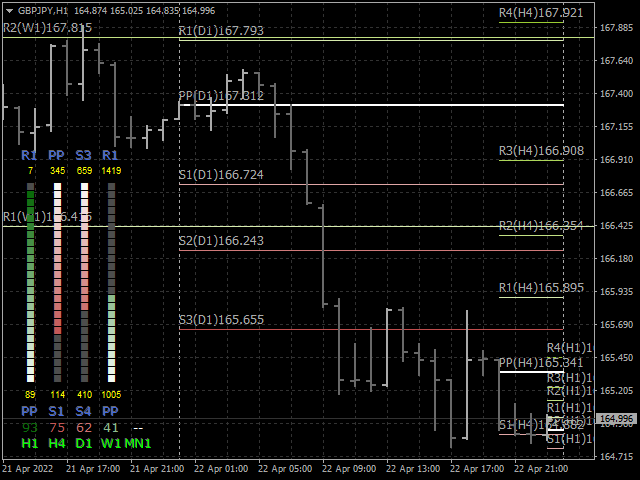
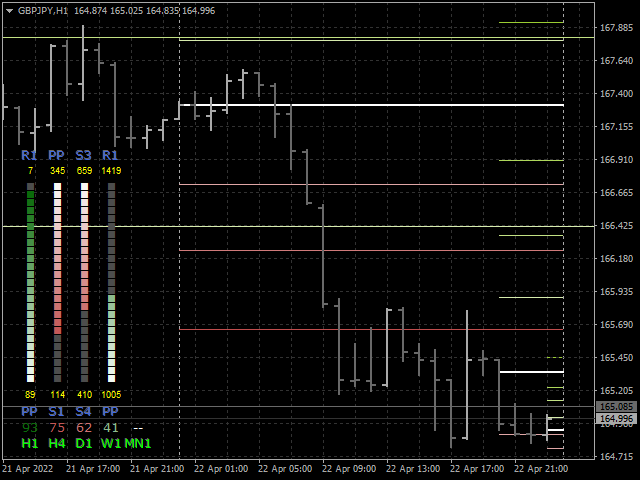
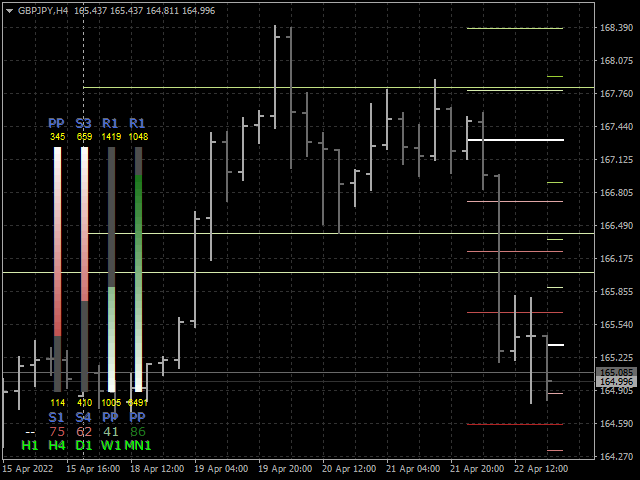
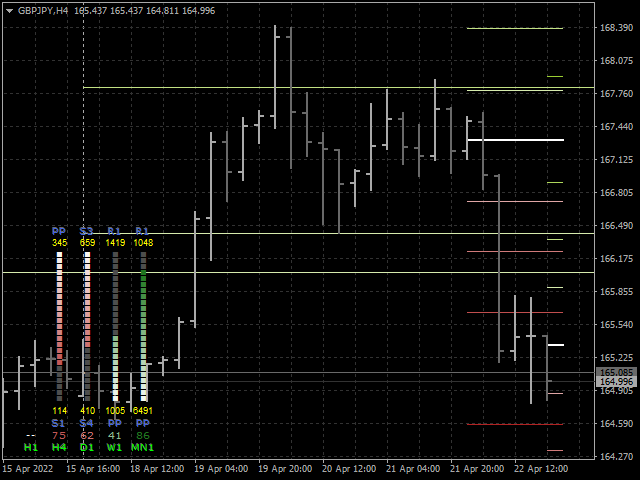
The indicator displays support and resistance levels for the selected timeframes, additionally showing how many points to the nearest levels, as well as between which levels the current price is in the form of a color scale and percentages.
Location anywhere on the chart, the ability to scale, the calculation offset taking into account the hourly difference of your broker, the choice of colors and other parameters will allow you to customize the indicator at your discretion.
Choice:
- 8 types of levels, including pivots, Fibonacci levels, DeMark lines, Camarilla and others.
- 10 base price options.
- 3 range calculation options.