MACD Intraday Trend
- Indicators
- JETINVEST
- Version: 3.0
- Updated: 5 June 2021
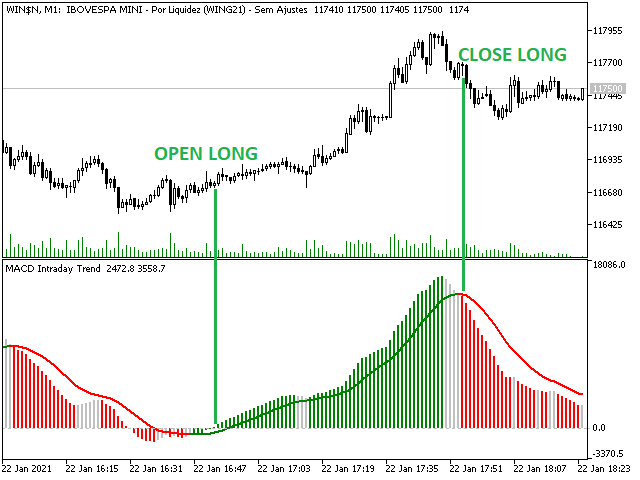
MACD Intraday Trend is an Indicator developed through an adaptation made of the original MACD created by Gerald Appel in the 1960s.
Through years of trading it was observed that by changing the parameters of the MACD with Fibonacci proportions we achieve a better presentation of the continuity of the trend movements, making that it is possible to more efficiently detect the beginning and end of a price trend.
Due to its efficiency in detecting price trends, it is also possible to identify very clearly the divergences of tops and bottoms, thus taking better advantage of trading opportunities.
Be sure to try our professional version with configurable features and alerts: MACD Intraday Trend PRO
Features
- Works with any currency pair
- Works at any timeframes
- Works with Renko charts
If you still have questions, please contact me by direct message: https://www.mql5.com/en/users/robsjunqueira/


感觉很不错