• Overview
  • Reviews (10)
  • Comments (39)
  • What's new

CPM Extended MT5

4.43

The algorithm is based on the idea of the Currency Power Meter indicator. In this version, the number of displayed values is unlimited, its code is more compact and fast, values of the current bar can be obtained through indicator buffers.

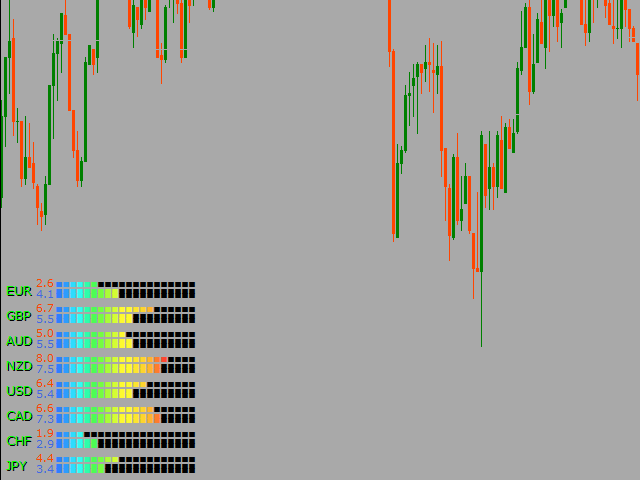
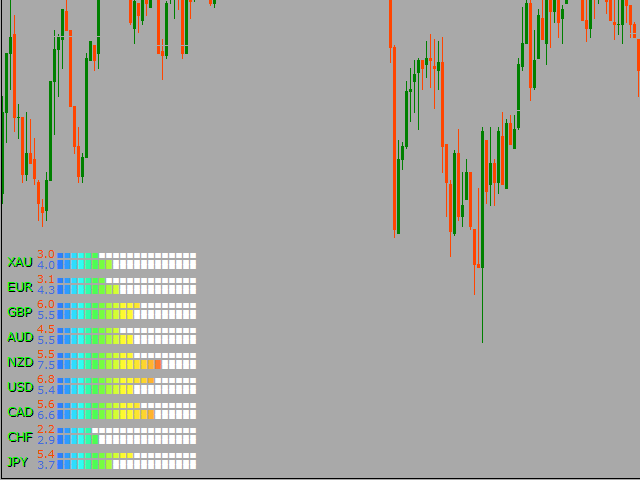
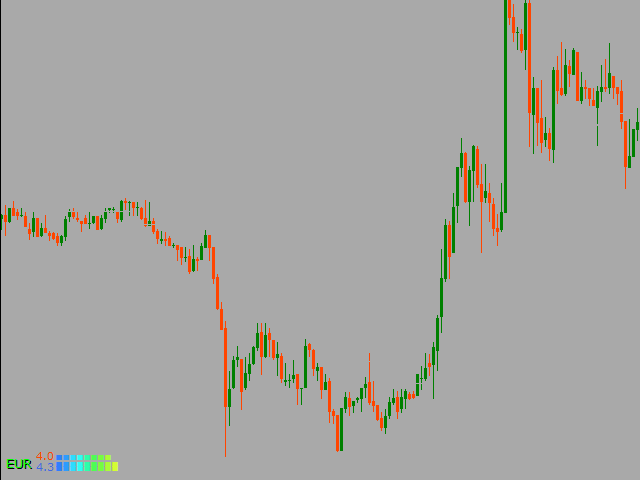
What the indicator shows: a thin band and the upper number in front of the currency shows the relative strength index for the last N hours (N is set in the parameters in the variable 'Hours'), a wider band shows the daily index. The more currency pairs using this currency you specify in the input parameters (assuming that your broker provides quotes for the pairs), the more weighted the index will be (but be careful with pairs of "non-major" or exotic currencies, they can distort the overall picture). For example, if you specify only EURUSD, the relative index for Euro will be calculated only based on this pair, if you add EURGBP, then the Euro index will be calculated based on two pairs and a more weighted value will be obtained.

How to use the data: the lower/higher the index value, the more likely a technical correction or trend continuation is, in the absence of important news.

Reviews 10
Sutatong
209
Sutatong 2023.04.14 15:28 
 

Thank you so much.

oaskari
14
oaskari 2023.04.09 11:19 
 

This is what I was looking for. Thank you for sharing.

apcruz01
178
apcruz01 2022.05.06 16:40 
 

Interesante hay pocos indicadores de fuerza para Mt5 solo que debería poder colocar temporalidades menos a una hora. gracias por el aporte

Recommended products
This indicator is a zero-lag indicator and displays  strength of trend change . True Trend  Oscillator Pro works best in combination with True Trend Moving Average Pro that displays exact trend as is. Oscillator value is exact price change in given direction of the trend. True Trend Moving Average Pro: https://www.mql5.com/en/market/product/103586 If you set PERIOD input parameter to 1 this indicator becomes a sharpshooter for binary options. Developers can use True Trend Oscillator in E
FREE
What is this indicator? This indicator is the MACD (Moving Average Convergence/Divergence) supporting Virtual Trading mode of  Knots Compositor . When the mode is turned on, the indicator will be recalculated based on the displayed candlesticks. When the mode is turned off, the indicator will be recalculated based on the original chart candlesticks. Types of the applied price - Close - Open - High - Low - Median Price (HL/2) - Typical Price (HLC/3) - Weighted Price (HLCC/4) KC-Indicators
FREE
What is this indicator? This indicator is the RSI (Relative Strength Index) supporting Virtual Trading mode of  Knots Compositor . When the mode is turned on, the indicator will be recalculated based on the displayed candlesticks. When the mode is turned off, the indicator will be recalculated based on the original chart candlesticks. Types of the applied price - Close - Open - High - Low - Median Price (HL/2) - Typical Price (HLC/3) - Weighted Price (HLCC/4) KC-Indicators -   KC-MA   (M
FREE
Follow The Line MT5
Oliver Gideon Amofa Appiah
4.42 (31)
This indicator obeys the popular maxim that: "THE TREND IS YOUR FRIEND" It paints a GREEN line for BUY and also paints a RED line for SELL. (you can change the colors). It gives alarms and alerts of all kinds. IT DOES NOT REPAINT and can be used for all currency pairs and timeframes. Yes, as easy and simple as that. Even a newbie can use it to make great and reliable trades. NB: For best results, get my other premium indicators for more powerful and reliable signals. Get them here: https://www.m
FREE
Important Lines
Terence Gronowski
4.88 (26)
This indicator displays Pivot-Lines, preday high and low, preday close and the minimum and maximum of the previous hour. You just have to put this single indicator to the chart to have all these important lines, no need to setup many single indicators. Why certain lines are important Preday high and low : These are watched by traders who trade in a daily chart. Very often, if price climbs over or falls under a preday low/high there is an acceleration in buying/selling. It is a breakout out of
FREE
Free automatic Fibonacci is an indicator that automatically plots a Fibonacci retracement based on the number of bars you select on the BarsToScan setting in the indicator. The Fibonacci is automatically updated in real time as new highest and lowest values appears amongst the selected bars. You can select which level values to be displayed in the indicator settings. You can also select the color of the levels thus enabling the trader to be able to attach the indicator several times with differe
FREE
The Trend Catcher: The Trend Catcher Strategy with Alert Indicator is a versatile technical analysis tool that aids traders in identifying market trends and potential entry and exit points. It features a dynamic Trend Catcher Strategy , adapting to market conditions for a clear visual representation of trend direction. Traders can customize parameters to align with their preferences and risk tolerance. The indicator assists in trend identification, signals potential reversals, serves as a trail
FREE
Mitimom
Danil Poletavkin
The indicator is based on Robert Miner's methodology described in his book "High probability trading strategies" and displays signals along with momentum of 2 timeframes. A Stochastic oscillator is used as a momentum indicator. The settings speak for themselves period_1 is the current timeframe, 'current' period_2 is indicated - the senior timeframe is 4 or 5 times larger than the current one. For example, if the current one is 5 minutes, then the older one will be 20 minutes The rest of the
FREE
Indicator measures strength of each currency in your list. Main idea: It simply iterates through all combinations of pairs and adds difference between open and close in percent. Parameters: List of currencies - what currencies will be calculated (maximum is 8) Calculation type - from which data will be strength calculated Calculation data input - used as input related to calculation type Symbol suffix - used in case of suffix on symbols, e.g: when your symbols look like EURUSDm, EURUSDmicro et
FREE
TradeQL
Abdiel Aviles Jimenez
The TradeQL Indicator is a customizable tool that highlights specific trading patterns on candlestick charts. Users can define patterns through TradeQL queries, which the indicator then applies to the chart, visually representing matches and captured groups. Ideal for identifying complex trade setups in real-time. TradeQL queries are specified using the TradeQL Language. See https://github.com/abdielou/tradeql for more details. This language is expressed as a regular expression. The language a
FREE
The indicator identifies when a divergence occurs between price and an indicator or oscillator. It identifies both regular and hidden divergences. Combined with your own rules and techniques, this indicator will allow you to create (or enhance) your own powerful system. Features Can detect divergences for the following oscillators/indicators:   MACD, OsMA, Stochastics, RSI, CCI, RVI, Awesome, ADX, ATR, OBV, Composite index, MFI and Momentum. Only one oscillator/indicator can be selected. Draws
FREE
Reversal Candles MT5
Nguyen Thanh Cong
5 (2)
Introduction Reversal Candles is a cutting-edge non-repainting   forex indicator designed to predict price reversals with remarkable accuracy through a sophisticated combination of signals. Signal Buy when the last closed candle has a darker color (customizable) and an up arrow is painted below it Sell when the last closed candle has a darker color (customizable) and a down arrow is painted above it
FREE
Dual RSI
Paul Conrad Carlson
Indicator alerts for Dual Relative strength index rsi. Large rsi preset at 14 is below 30 small rsi preset at 4 is below 10 for buy bullish signals . Large rsi preset are 14 is above 70 small rsi preset at 4 is above 90 for sell bearish signals . Includes mobile and terminal alerts. draws lines when alerts. This indicator can help identify extremes and then the tops or bottoms of those extremes .
FREE
High Low Open Close
Alexandre Borela
4.97 (36)
If you like this project, leave a 5 star review. Follow on instagram: borelatech This indicator draws the open, high, low and closing prices for the specified period and it can be adjusted for a specific timezone. These are important levels looked by many institutional and professional traders and can be useful for you to know the places where they might be more active. The available periods are: Previous Day. Previous Week. Previous Month. Previous Quarter. Previous year. Or: Current Day. Cu
FREE
RSI Currencies MT5
Fabio Cavalloni
5 (1)
RSI Currencies is an indicator that is based on the RSI concept but with a totally different approach. It calculates its values calculating all RSI values of all pairs related to the same currency and making an average between them: the goal is to obtain a more solid and trustable information about what each currency are doing lowering the impact of market noise and extreme euphory on a particular pair to analyze the whole basket. It works on 28 forex majors and minor pairs related to these curr
FREE
This indicator is especially for the binary trading. Time frame is 1 minutes and exp time 5 or 3 minutes only. You must be use martingale 3 step. So you must put lots size is 10 % at most. You should use Mt2 trading platform to connect with my indicator to get more signal without human working. This indicator wining rate is over 80% but you may get 100% of profit by using martingale 3 step. You should use MT2 Trading Platform to connect meta trader platform and binary platform . You can get mt2
FREE
PZ Pivot Points MT5
PZ TRADING SLU
4.95 (22)
This indicator displays pivot points in the chart, including historical vales, and supports many calculation modes for Pivot Points and S/R levels. [ Installation Guide | Update Guide | Troubleshooting | FAQ | All Products ] It plots historical levels for backtesting purposes It allows you to select the reference timeframe It implements different Pivot Point calculation modes It implements different SR calculation modes It implements customizable colors and sizes Calculation Modes The indi
FREE
Show Pips for MT5
Roman Podpora
4.61 (18)
This information indicator will be useful for those who always want to be aware of the current situation on the account. - More useful indicators The indicator displays data such as profit in points, percentage and currency, as well as the spread for the current pair and the time until the bar closes on the current timeframe. There are several options for placing the information line on the chart: - To the right of the price (runs behind the price); - As a comment (in the upper left corner
FREE
This indicator is based on the original “ Time Segmented Volume (TSV) ” developed by Worden Brothers, Inc . However, I added an extra few features to this one. One can choose the price to be applied, instead of only having the default close price used by the original. One can also choose which volume weighting to use, including a pseudo-volume based on true range, or no volume weighting at all.
FREE
Multi-timeframe trend indicator based on the ADX / ADXWilder indicator with Fibonacci levels The indicator shows trend areas using ADX or ADXWilder indicator data from multiple timeframes. The impulse mode of the indicator allows you to catch the beginning of a trend, and several "Screens" with different timeframes allow you to filter out market noise. Fibonacci levels are added to the price chart, which have flexible settings. How the indicator works: if PDI is greater than NDI, then   it`
FREE
A professional tool for trading - the divergence indicator between the  RVI and the price, which allows you to receive a signal about a trend reversal in a timely manner or catch price pullback movements (depending on the settings). The indicator settings allow you to adjust the strength of the divergence due to the angle of the  RVI peaks and the percentage change in price, which makes it possible to fine-tune the signal strength. The indicator code is optimized and is tested very quickly as p
FREE
DALA Forecast
Grigorii Matsnev
About the indicator: DALA Forecast is a universal tool for predicting the dynamics of time series of any nature. For prediction, modified methods of nonlinear dynamics analysis are used, on the basis of which a predictive model is built using machine learning methods.  To get the trial version of the indicator, you can contact me in private messages. How to use the indicator: Apply the indicator to your chosen financial instrument or indicator with the settings you need. The prediction will b
FREE
Are you tired of drawing trendlines every time you're analyzing charts? Or perhaps you would like more consistency in your technical analysis. Then this is for you. This indicator will draw trend lines automatically when dropped on a chart. How it works Works similar to standard deviation channel found on mt4 and mt5. It has 2 parameters: 1. Starting Bar 2. Number of bars for calculation The   starting bar   is the bar which drawing of the trend lines will begin, while the   number of bars for c
FREE
LT Donchian Channel
Thiago Duarte
4.75 (4)
Donchian Channel is an indicator created by Richard Donchian. It is formed by taking the highest high and the lowest low of the last specified period in candles. The area between high and low is the channel for the chosen period. Its configuration is simple. It is possible to have the average between the upper and lower lines, plus you have alerts when price hits one side. If you have any questions or find any bugs, please contact me. Enjoy!
FREE
ATR Exit MT5
BLAKE STEVEN RODGER
4.75 (4)
The ATR Exit indicator uses the candle close + ATR value to draw trailing stop lines (orange under buys, magenta over sells) that advance with the trend until the trend changes direction. It uses a multiple of the Average True Range (ATR), subtracting it’s value from the close on buy, adding its value to the close on sell. Moreover, the trailing stop lines are generated to support the order’s trend direction (long or short):  In an upward trend, the long trailing stop line (orange line under bu
FREE
Donchian Pro
Paulo Henrique Faquineli Garcia
5 (2)
The Donchian Channel Channels are among the most popular tools of technical analysis, as they visually convey to the analyst the limits within which most price movement tends to occur. Channel users know that valuable information can be obtained at any time, whether prices are in the central region of a band or close to one of the border lines. One of the best known techniques to explore these concepts is Bollinger Bands. However, John Bollinger was not the only one to research the applicatio
FREE
The   OHLC indicator   shows the current and historical values of High, Low, Open, Close and Mid for a specific time period. It can plot the current values or the values from the previous session. The indicator's range can be calculated from a daily, weekly, monthly, or user-specified session. Levels High  of the current or previous session. Low  of the current or previous session. Open  of current or previous session. Close  of the current or previous session. Midpoint  of the current or pre
FREE
RenkoExpert
Andrey Goida
3.67 (3)
Renko Expert Advisor based on Renko bar simulation.    The EA has two options for building Renko bars. Classic and ATR. In the classic version, renko bars are marked with areas on the main chart; in the ATR version, renko bars are modeled and drawn in the indicator window. Modeling renko bars inside the EA allows you to optimize the robot better than drawing renko bars offline.      Telegramm channel   Set file Our second robot RENKOTREND Does not use martingale!  Trades opened by the robot co
FREE
Donchian Channel DC is the indicator of Donchian Channels, that plots maximum and minimum values of a specific period, besides mean value line. It´s possible to configure simple period for analysis and the indicator will plot all three values. You can trade with this indicator as trend or reversal, according to each strategy. Do not let to test others indicators as soon as others expert advisors.
PZ Penta O MT5
PZ TRADING SLU
4 (6)
The Penta-O is a 6-point retracement harmonacci pattern which usually precedes big market movements. Penta-O patterns can expand and repaint quite a bit. To make things easier this indicator implements a twist: it waits for a donchian breakout in the right direction before signaling the trade. The end result is an otherwise repainting indicator with a very reliable trading signal. The donchian breakout period is entered as an input. [ Installation Guide | Update Guide | Troubleshooting | FAQ | A
FREE
Buyers of this product also purchase
First of all Its worth emphasizing here that this Trading System is Non-Repainting , Non-Redrawing and Non-Lagging Indicator , Which makes it ideal from both manual and robot trading .  The Smart Trend Trading System MT5 is a comprehensive trading solution tailored for new and experienced traders . It combines over 10 premium indicators and features more than 7 robust trading strategies , making it a versatile choice for diverse market conditions . Trend Following Strategy : Provides precise ent
Atomic Analyst MT5
Issam Kassas
3.64 (11)
First of all Its worth emphasizing here that this Trading Indicator is   Non-Repainting ,   Non-Redrawing   and   Non-Lagging   Indicator, Which makes it ideal from both manual and robot trading.  The Atomic Analyst  is a PA Price Action Indicator that uses Strength and Momentum of the price to find a better edge in the market. Equipped with an AI filter which help remove noises and false signals, and Increase Trading Potential. Using Multiple layers of complex Indicators, the Atomic Analyst
Quantum Trend Sniper
Bogdan Ion Puscasu
5 (37)
Introducing   Quantum Trend Sniper Indicator , the groundbreaking MQL5 Indicator that's transforming the way you identify and trade trend reversals! Developed by a team of experienced traders with trading experience of over 13 years,   Quantum Trend Sniper Indicator   is designed to propel your trading journey to new heights with its innovative way of identifying trend reversals with extremely high accuracy. ***Buy Quantum Trend Sniper Indicator and you could get Quantum Breakout Indicator fo
FX Volume MT5
Daniel Stein
4.94 (17)
Visit our all-new   Stein Investments Welcome Page   to get the latest information, updates and trading strategies. FX Volume is the FIRST and ONLY volume indicator that provides a REAL insight into the market sentiment from a broker's point of view. It provides awesome insights into how institutional market participants, like brokers, are positioned in the Forex market, much faster than COT reports. Seeing this information directly on your chart is the real game-changer and breakthrough solut
Trend Screener Pro MT5
STE S.S.COMPANY
4.89 (61)
Unlock the Power of  Trends trading with Trend Screener Indicator: Your Ultimate Trend Trading Solution powered by fuzzy logic and Multi-currencies System ! Elevate your trend trading with Trend Screener, the revolutionary trend indicator powered by   fuzzy logic.  It is a powerful trend-following indicator that combines over  13 premium tools and features and 3 trading strategies  , making it a versatile choice to   make your Metatrader a Trend Analyzer. LIMITED TIME OFFER : Trend Screener Indi
Gold Stuff mt5
Vasiliy Strukov
4.89 (166)
Gold Stuff mt5 is a trend indicator designed specifically for gold and can also be used on any financial instrument. The indicator does not redraw and does not lag. Recommended time frame H1. Contact me immediately after the purchase to get   personal bonus! Settings  and manual   here   SETTINGS Draw Arrow - on off. drawing arrows on the chart. Alerts -   on off audible alerts. E-mail notification - on off. email notifications. Puch-notification - on off. Push notifications. Next, adjust the co
First of all Its worth emphasizing here that this Trading Tool is Non Repainting , Non Redrawing and Non Lagging Indicator , Which makes it ideal for professional trading . The Smart Price Action Concepts Indicator is a very powerful tool for both new and experienced traders . It packs more than 20 useful indicators into one , combining advanced trading ideas like Inner Circle Trader Analysis and Smart Money Concepts Trading Strategies . This indicator focuses on Smart Money Concepts , prov
FX Power MT5 NG
Daniel Stein
5 (4)
Trading GOLD, and currencies, with the dog walk strategy  - super smart Trading GOLD, and currencies, with the breakout strategy  - super easy Visit our all-new   Stein Investments Welcome Page   to get the latest information, updates and trading strategies. FX Power MT5 NG  is the next generation of our long-time very popular currency strength meter, FX Power.  And what does this next-generation strength meter offer? Everything you have loved about the original FX Power  PLUS GOLD/XAU st
Advanced Supply Demand MT5
Bernhard Schweigert
4.53 (15)
Best Solution for any Newbie or Expert Trader! This indicator is a unique, high quality and affordable trading tool because we have incorporated a number of proprietary features and a new formula. With this update, you will be able to show double timeframe zones. You will not only be able to show a higher TF but to show both, the chart TF, PLUS the higher TF: SHOWING NESTED ZONES. All Supply Demand traders will love it. :) Important Information Revealed Maximize the potential of Advanced Suppl
RelicusRoad Pro MT5
Relicus LLC
4.82 (22)
How many times have you bought a trading indicator with great back-tests, live account performance proof with fantastic numbers and stats all over the place but after using it, you end up blowing your account? You shouldn't trust a signal by itself, you need to know why it appeared in the first place, and that's what RelicusRoad Pro does best! NOW $147 (increasing to $499 after a few updates) - UNLIMITED ACCOUNTS (PCs or MACs) **  User Manual + Strategies + Training Videos + Private Group with
XQ Indicator MetaTrader 5
Marzena Maria Szmit
5 (1)
Step into the realm of Forex trading with confidence and precision using XQ, a cutting-edge Forex indicator designed to elevate your trading game to unprecedented heights. Whether you're a seasoned trader or just stepping into the world of currency exchange, XQ Forex Indicator empowers you with the insights and signals needed to make informed trading decisions. The signal conditions are a combination of three indicators, and XQ Forex Indicator only display  medium and long-term trends . The ind
Volume by Price MT5
Brian Collard
5 (3)
The Volume by Price Indicator for MetaTrader 5 features Volume Profile and Market Profile TPO (Time Price Opportunity). Get valuable insights out of currencies, equities and commodities data. Gain an edge trading financial markets. Volume and TPO histogram bar and line charts. Volume Footprint charts. TPO letter and block marker charts including split structures. Versatile segmentation and compositing methods. Static, dynamic and flexible ranges with relative and/or absolute visualizations. Lay
Auto Order Block with break of structure based on ICT and Smart Money Concepts Futures Break of Structure ( BoS )             Order block ( OB )            Higher time frame Order block / Point of Interest ( POI )    shown on current chart           Fair value Gap ( FVG ) / Imbalance   ,  MTF      ( Multi Time Frame )    Volume Imbalance     ,  MTF          vIMB Gap’s Equal High / Low’s     ,  MTF             EQH / EQL Liquidity               Current Day High / Low           HOD /
Top indicator for MT5   providing accurate signals to enter a trade without repainting! It can be applied to any financial assets:   forex, cryptocurrencies, metals, stocks, indices .  Watch  the video  (6:22) with an example of processing only one signal that paid off the indicator! MT4 version is here It will provide pretty accurate trading signals and tell you when it's best to open a trade and close it. Most traders improve their trading results during the first trading week with the help of
ICT, SMC, SMART MONEY CONCEPTS, SMART MONEY, Smart Money Concept, Support and Resistance, Trend Analysis, Price Action, Market Structure, Order Blocks, BOS/CHoCH,   Breaker Blocks ,  Momentum Shift,   Supply&Demand Zone/Order Blocks , Strong Imbalance,   HH/LL/HL/LH,    Fair Value Gap, FVG, Inversion FVG, IFVG,  Premium  &   Discount   Zones, Fibonacci Retracement, OTE, Buy Side Liquidity, Sell Side Liquidity, BSL/SSL Taken, Equal Highs & Lows, MTF Dashboard, Multiple Time Frame, BigBar, HTF OB
Profit from market structure changes as price reverses and pulls back. The market structure reversal alert indicator identifies when a trend or price move is approaching exhaustion and ready to reverse. It alerts you to changes in market structure which typically occur when a reversal or major pullback are about to happen. The indicator identifies breakouts and price momentum initially, every time a new high or low is formed near a possible exhaustion point. The indicator draws in a rectangle on
Blahtech Supply Demand MT5
Blahtech Limited
4.57 (14)
Was: $299  Now: $99   Supply Demand uses previous price action to identify potential imbalances between buyers and sellers. The key is to identify the better odds zones, not just the untouched ones. Blahtech Supply Demand indicator delivers functionality previously unavailable on any trading platform. This 4-in-1 indicator not only highlights the higher probability zones using a multi-criteria strength engine, but also combines it with multi-timeframe trend analysis, previously confirmed swings
Gann Squares Indicator: Analyzing Markets with Geometric Patterns The Gann Squares indicator is a powerful tool for market analysis that draws upon the mathematical concepts introduced by W.D. Gann in his article on "Mathematical Formula for Market Predictions." This indicator incorporates Gann's techniques involving square numbers such as 144, 90, and 52, as well as the Square of 9. Additionally, it incorporates  method for utilizing the Square of 9 in conjunction with channels and the star pa
Trend Line Map Pro MT5
STE S.S.COMPANY
4.67 (9)
Trend Line Map indicator is an addons for   Trend Screener Indicator . It's working as a scanner for all signals generated by Trend screener ( Trend Line Signals ) . It's a Trend Line Scanner based on Trend Screener Indicator.  If you don't have Trend Screener Pro Indicator,   the Trend Line Map Pro will not work.     LIMITED TIME OFFER : Trend Line Map Indicator is available for only 50 $ and lifetime. ( Original price 125$ ) By accessing to our MQL5 Blog,  you can find all our premium indica
TrendLine PRO MT5
Evgenii Aksenov
4.78 (49)
The Trend Line PRO indicator is an independent trading strategy. It shows the trend change, the entry point to the transaction, as well as automatically calculates three levels of Take Profit and Stop Loss protection Trend Line PRO is perfect for all Meta Trader symbols: currencies, metals, cryptocurrencies, stocks and indices Advantages of Trend Line PRO Never redraws its signals The possibility of using it as an independent strategy It has three automatic levels Take Profit and Stop Loss lev
Introducing   Quantum Breakout PRO , the groundbreaking MQL5 Indicator that's transforming the way you trade Breakout Zones! Developed by a team of experienced traders with trading experience of over 13 years,   Quantum Breakout PRO   is designed to propel your trading journey to new heights with its innovative and dynamic breakout zone strategy. Quantum Breakout Indicator will give you signal arrows on breakout zones with 5 profit target zones and stop loss suggestion based on the breako
Owl Smart Levels MT5
Sergey Ermolov
4.47 (36)
MT4 version  |   FAQ The Owl Smart Levels Indicator is a complete trading system within the one indicator that includes such popular market analysis tools as Bill Williams' advanced fractals , Valable ZigZag which builds the correct wave structure of the market, and Fibonacci levels which mark the exact levels of entry into the market and places to take profits. Detailed description of the strategy Instructions for working with the indicator Advisor-assistant in trading Owl Helper Private User
AW Trend Predictor MT5
AW Trading Software Limited
4.76 (54)
The combination of trend and breakdown levels in one system. An advanced indicator algorithm filters market noise, determines the trend, entry points, as well as possible exit levels. Indicator signals are recorded in a statistical module, which allows you to select the most suitable tools, showing the effectiveness of the signal history. The indicator calculates Take Profit and Stop Loss marks. Manual and instruction ->  HERE  / MT4 version ->  HERE How to trade with the indicator:  Trading wit
Gartley Hunter Multi
Siarhei Vashchylka
5 (5)
Gartley Hunter Multi - An indicator for searching for harmonic patterns simultaneously on dozens of trading instruments and on all classic timeframes: (m1, m5, m15, m30, H1, H4, D1, Wk, Mn). Manual (Be sure to read before purchasing) | Version for MT4 Advantages 1. Patterns: Gartley, Butterfly, Shark, Crab. Bat, Alternate Bat, Deep Crab, Cypher 2. Simultaneous search for patterns on dozens of trading instruments and on all classic timeframes 3. Search for patterns of all possible sizes. Fr
Was: $249  Now: $99   Market Profile defines a number of day types that can help the trader to determine market behaviour. A key feature is the Value Area, representing the range of price action where 70% of trading took place. Understanding the Value Area can give traders valuable insight into market direction and establish the higher odds trade. It is an excellent addition to any system you may be using. Inspired by Jim Dalton’s book “Mind Over Markets”, this indicator is designed to suit the
TPSproTREND PrO MT5
Roman Podpora
5 (5)
TPSpro TRENDPRO  - is a trend indicator that automatically analyzes the market and provides information about the trend and each of its changes, as well as giving signals for entering trades without redrawing! The indicator uses each candle, analyzing them separately. referring to different impulses - up or down impulse. Exact entry points into transactions for currencies, crypto, metals, stocks, indices!  -  Version MT4                  DETAILED DESCRIPTION        /       TRADING SETUPS       
Black Dragon indicator mt5
Ramil Minniakhmetov
4.82 (56)
The trend detection indicator will compliment any strategy and can also be used as an independent tool. IMPORTANT! Contact me immediately after the purchase to get instructions and a bonus!  Benefits  Easy to use; does not overload the graphic wih unnecessary information. The ability to use as filter for any strategy. Contains bult -in dynamic levels of cupport and resistange,  which can be used both, for profit taking, and for settings up stop-losses. The indicator does not change color after t
Golden Spikes Detector
Batsirayi L Marango
5 (1)
Golden Spikes Detector This indicator is based on an advanced strategy primarily for trading spikes on Boom and Crash Indices. Complex algorithms were implemented to detect high probability entries only. It alerts on potential Buy and Sell entries. To trade spikes on the Deriv or Binary broker, only take Buy Boom and Sell Cash alerts. It was optimised to be loaded on 5-minute timeframe although multiple timeframe analysis is done in the background. Features ·             Desktop pop up and sound
Matrix Arrow Indicator MT5
Juvenille Emperor Limited
5 (14)
Matrix Arrow Indicator MT5  is a unique 10 in 1 trend following   100% non-repainting  multi-timeframe indicator that can be used on all symbols/instruments:   forex,   commodities,   cryptocurrencies,   indices,   stocks .  Matrix Arrow Indicator MT5  will determine the current trend at its early stages, gathering information and data from up to 10 standard indicators, which are: Average Directional Movement Index (ADX) Commodity Channel Index (CCI) Classic Heiken Ashi candles Moving Aver
IX Power MT5
Daniel Stein
5 (2)
IX Power   finally brings the unbeatable precision of FX Power to non-Forex symbols. It accurately determines the intensity of short, medium and long-term trends in your favourite indices, stocks, commodities, ETFs, and even cryptocurrencies. You can   analyse everything   your terminal has to offer. Try it out and experience how   your timing improves significantly   when trading. Read about our latest strategic development -  Easy scalping with IX Power Visit our all-new   Stein Investments
More from author
The utility is designed to change the symbol of the current, all or selected charts, change the timeframe , as well as to synchronously move through the history of all charts (automatically or by clicking the button). The list of symbols is read from the "Market Watch" or is set manually. The color, size and position of the buttons are customizable. Synchronization of charts occurs according to the time of the first visible bar when you press the "SYNC" button or when moving the mouse/keyboard i
This is a linear indicator of a currency power having the ability to filter by smoothing values. It shows the current power of selected currencies (the maximum number is 8), as well as historical values. Calculation depends on the selected chart timeframe the indicator is launched at. The indicator displays data as lines for all currencies or as a histogram for the current currency pair. The intersection of the currency strength indices for the current currency pair is additionally displayed as
Mini Charts MT5
Sergey Efimenko
4.91 (23)
The indicator displays minimized charts of any symbol from any timeframe. The maximum number of displayed charts is 28. The charts can be located both in the main and bottom window. Two display modes: candles and bars. Amount of displayed data (bars and candles) and chart sizes are adjustable. To work with a mini chat, you must first put the desired indicator(s) on a regular chart, then save it as a template and apply a template for the mini chart via the appropriate parameter, for example, for
FREE
The utility is designed to   change the symbol   of the current, all or selected charts,   change the timeframe , as well as to   synchronously move through the history   of all charts (automatically or by clicking the button). The list of symbols is read from the "Market Watch" or is set manually. The color, size and position of the buttons are customizable. Synchronization of charts occurs according to the time of the first visible bar when you press the "SYNC" button or when moving the mouse/
Mini Charts
Sergey Efimenko
4.29 (14)
The indicator displays minimized charts of any symbol from any timeframe. The maximum number of displayed charts is 28. The charts can be located both in the main and bottom window. Two display modes: candles and bars. Amount of displayed data (bars and candles) and chart sizes are adjustable. Parameters: Corner - display start corner (selected from the list) CandleMode - display mode: true - candles, false - bars ShowLastBid - enable/disable the last price display LastBidShiftX - last price lin
FREE
CPM Extended
Sergey Efimenko
4.6 (20)
The algorithm is based on the idea of the Currency Power Meter indicator. In this version, the number of displayed values is unlimited, its code is more compact and fast, values of the current bar can be obtained through indicator buffers. What the indicator shows : a thin band and the upper number in front of the currency shows the relative strength index for the last N hours (N is set in the parameters in the variable 'Hours'), a wider band shows the daily index. The more currency pairs using
FREE
The indicator displays harmonic patterns on the chart based on Dynamic ZigZag ( https://www.mql5.com/en/market/product/5356 ) and is almost a complete analog of one of the versions of well-known korHarmonics. The indicator recognizes the following patterns and their varieties: ABCD, Gartley (Butterfly, Crab, Bat), 3Drives, 5-0, Batman, SHS, One2One, Camel, Triangles, WXY, Fibo and Vibrations. Only display of ABCD and Gartley patterns is enabled in the settings by default. The reverse line allows
This is a linear indicator of a currency power having the ability to filter by smoothing values. It shows the current power of selected currencies (the maximum number is 8), as well as historical values. Calculation depends on the selected chart timeframe the indicator is launched at. The indicator displays data as lines for all currencies or as a histogram for the current currency pair. The intersection of the currency strength indices for the current currency pair is additionally displayed as
The indicator allows you to determine the current price direction and market volatility. This version of the Traders Dynamic Index (TDI) has the redrawing of the historical data eliminated, the algorithm calculation speed optimized, more external parameters for a more precise adjustments, and its functionalities extended: added the selection of the initial oscillator and the smoothing methods of the averages. Parameters: Mode Osc - estimation oscillator selection; Period Osc - the calculation
Unique "scalping" trend indicator with the feature of multi-layered smoothing of the resulting lines and a wide selection of parameters. It helps determine a probable change in the trend or a correction virtually near the very beginning of the movement. The toggled intersection arrows are fixed and appear at the opening of a new bar, but, with enough experience, it is possible to look for entry opportunities as soon as the indicator lines intersect at the unfinished bar. The signal appearance l
This is an MTF indicator of support and resistance levels based on Advanced ZigZag Dynamic and/or Extended Fractals indicator extremums with price labels (can be disabled). More higher TFs can be selected for MTF mode. By default, the levels are generated based on ZigZag indicator dots. Fractals indicator dots can also be used together with ZigZag or instead of it. In order to simplify the use and save CPU time, calculation is performed once per each bar at its opening. Parameters: ForcedTF - ch
The indicator shows harmonic patterns on the chart without repainting with the minimum possible lag. The search for indicator tops is based on the wave principle of price analysis. Advanced settings allow you to choose parameters for your trading style. At the opening of a candle (bar), when a new pattern is formed, an arrow of the probable direction of the price movement is fixed, which remains unchanged. The indicator recognizes the following patterns and their varieties: ABCD, Gartley (Butter
If you trade by levels, then this indicator is for you. The indicator displays support and resistance levels for the selected timeframes, additionally showing how many points to the nearest levels, as well as between which levels the current price is in the form of a color scale and percentages. Location anywhere on the chart, the ability to scale, the calculation offset taking into account the hourly difference of your broker, the choice of colors and other parameters will allow you to cus
News on chart
Sergey Efimenko
5 (1)
The indicator shows the schedule of economic news releases on the chart. News is loaded using a free utility that you can download   here .   The calendar is loaded once at the beginning of the week. You can customize the list of required countries (currencies). The news is divided into 4 categories of importance: high, medium, low and others. By default, the indicator displays data for the current week. There are 4 offset buffers available in the indicator, which can be used as a news filter w
The utility is designed for automatic loading of data necessary for functioning of News on chart indicator which is a calendar from forexfactory. Parameters: Use common folder - download files to the public file folder for all terminals \Terminal\Common\Files\. If false , download data to the 'files' folder of the current terminal. First day - news download start date. Leave 0 (01.01.1970 00:00) to download the current data only. Calendar url - address of the source data website to be added to t
FREE
Extended Fractals
Sergey Efimenko
5 (1)
The indicator expands the capabilities of standard fractals, allows you to find, display and use them, calculating for any odd length, that is, 3 (DeMark points), 5, 7, 9 and so on bars. Fractals can be calculated not only by bar prices, but also by the values of moving averages of a given period. All types of alerts are implemented in the indicators separately for upper and lower fractals. To set the number of used bars, the Left fractal bars count variable is set in the settings (the default
Extended version of the "Keltner Channel" indicator. This is an analytical tool that allows you to determine the ratio of the price position relative to its volatility. You can use 26 types of moving average and 11 price options to calculate the middle line of the indicator. Configurable alerts will notify you when the price touches the upper or lower border of the channel. Available average types: Simple Moving Average, Exponential Moving Average, Wilder Exponential Moving Average, Linear Weig
Advanced ZigZag Dynamic
Sergey Efimenko
4.5 (4)
The difference from the standard ZigZag indicator is the following: instead of calculating new extremum points based on the number of bars, it uses the distance between the high and the low to calculate the extremum points. In addition, this distance is calculated dynamically on default and depends on price fluctuations for a selected period and the multiplier. The distance can be set as a fixed number. In addition, it displays the reversal line, reaching which the previous extreme point is fix
An extended version of the well-known Moving Average Convergence / Divergence (MACD) indicator, distributed in 4 colors: growth, fall above and below 0. 26 options for smoothing moving averages, 11 types of prices. Disabled Alerts on color change with selectable alert mode: only when crossing a zero value or at any color change (rising / falling change and 0 crossing). Smoothing options: Simple, Exponential, Wilder Exponential, Linear Weighted, Sine Weighted, Triangular, Least Square, Smoothed,
I offer Stochastic indicator (oscillator) with signal line filtration by means of the Adaptive Moving Average (АМА). I also added a function of multicolor signal line display of increase and decrease by means of lines or dots at the discretion. Moreover, you can highlight signal line values located below the specified minimum level or above the specified maximum level. Parameters: PeriodK - period K of Stochastic oscillator Slowing - period of Stochastic oscillator slowing PriceField - Stochasti
CCI with AMA filtering
Sergey Efimenko
5 (1)
I offer you Commodity Channel Index (CCI) indicator (oscillator) with additional filtration by means of the Adaptive Moving Average (АМА). This technical indicator determines the strength or weakness of Bullish and Bearish trends. Its principle is based on the analysis of the current change in the deviation of the price from its average value for a given period with the filtering of the obtained values using the Kaufman algorithm, built on the basis of an exponentially smoothed moving average an
The indicator automatically calculates and plots Fibonacci support and resistance levels - one of the most effective tools for market analysis. The calculation uses the averaged price data for the selected period and timeframe. The minimum and maximum for this period are taken as the beginning and end of the movement. Fibonacci levels allow you to see potential reference points, around which the price movement can slow down or reverse, that is, they are used to predict further movement, as well
The indicator allows you to determine the current price direction and market volatility. This version of the Traders Dynamic Index  (TDI) has the redrawing of the historical data eliminated, the algorithm calculation speed optimized, more external parameters for a more precise adjustments, and its functionalities extended: added the selection of the initial oscillator and the smoothing methods of the averages. Parameters: Mode Osc - estimation oscillator selection; Period Osc - the calculation p
Advanced Power Trend
Sergey Efimenko
5 (2)
Unique "scalping" trend indicator with the feature of multi-layered smoothing of the resulting lines and a wide selection of parameters. It helps determine a probable change in the trend or a correction virtually near the very beginning of the movement. The toggled intersection arrows are fixed and appear at the opening of a new bar, but, with enough experience, it is possible to look for entry opportunities as soon as the indicator lines intersect at the unfinished bar. The signal appearance li
The uniqueness of this indicator lies in the volume accounting algorithm: accumulation occurs directly for the selected period without reference to the beginning of the day. The last bars can be excluded from the calculation, then the current data will have less influence on the significant levels (volumes) formed earlier. For a more accurate calculation, data from the M1 graph is used by default. The step of distribution of price volumes is regulated. By default, the right border of the display
This is a linear indicator of a currency power (correlation) having the ability to filter by smoothing values. It shows the current power of 8 major currencies, as well as historical values without redrawing. It is based on a custom algorithm. A basic currency pair is used for the calculation basis; the currency pair can differ from the current chart symbol. The result depends on the selected chart timeframe the indicator is launched at and on the basic currency pair. The indicator works with an
True SSRC nrp
Sergey Efimenko
5 (2)
The indicator shows (optional): Spearman's rank correlation coefficient, Pearson's linear correlation coefficient, Kendall's rank correlation coefficient, and Fechner's sign correlation coefficient. This oscillator shows the points of possible market reversal when the price goes beyond the overbought and oversold levels. There are 4 methods for additional filtering of the obtained values: simple, exponential, smoothed, linearly weighted. After the bar is closed, the values are fixed and not rep
The indicator expands the capabilities of standard fractals, allows you to find, display and use them, calculating for any odd length, that is, 3 (DeMark points), 5, 7, 9 and so on bars. Fractals can be calculated not only by bar prices, but also by the values of moving averages of a given period. All types of alerts are implemented in the indicators separately for upper and lower fractals. To set the number of used bars, the Left fractal bars count variable is set in the settings (the default
This is an extended version of Keltner channel. You can use 21 types of Moving Average and 11 methods of calculating the indicator's center line. Moving Average types: Simple Moving Average, Exponential Moving Average, Wilder Exponential Moving Average, Linear Weighted Moving Average, Sine Weighted Moving Average, Triangular Moving Average, Least Square Moving Average (or EPMA, Linear Regression Line), Smoothed Moving Average, Hull Moving Average by Alan Hull, Zero-Lag Exponential Moving Average
Filter:
Sutatong
209
Sutatong 2023.04.14 15:28 
 

Thank you so much.

oaskari
14
oaskari 2023.04.09 11:19 
 

This is what I was looking for. Thank you for sharing.

Troy
56
Troy 2022.10.13 14:46 
 

Превосходный индикатор. Не хватает только алерта/пуша на телефон о смене тенденции, когда один индекс силы валюты по индикатору становится выше/ниже другой.

apcruz01
178
apcruz01 2022.05.06 16:40 
 

Interesante hay pocos indicadores de fuerza para Mt5 solo que debería poder colocar temporalidades menos a una hora. gracias por el aporte

[Deleted] 2019.01.14 07:13 
 

User didn't leave any comment to the rating

sunnychow
8753
sunnychow 2019.01.12 16:57 
 

Thanks for share

Gennadiy Voltornist
11909
Gennadiy Voltornist 2017.12.24 19:16 
 

User didn't leave any comment to the rating

Daniel Andrejczuk
5596
Daniel Andrejczuk 2017.11.09 14:10 
 

User didn't leave any comment to the rating

Nork
6194
Nork 2016.12.21 07:31 
 

User didn't leave any comment to the rating

Rodrigo da Silva Boa
7137
Rodrigo da Silva Boa 2016.01.09 13:27 
 

User didn't leave any comment to the rating

Reply to review
Version 1.8 2019.12.25
The function of removing objects during deinitialization has been replaced with the standard one.
Version 1.7 2019.12.22
Added two parameters:
Horizontal offset of values - horizontal offset of numeric values
Indent between values - vertical indent between numeric values
Version 1.6 2019.12.19
Added parameters:
Horizontal imul - a multiplier for the horizontal scale
Vertical imul - a multiplier for the vertical scale
Scale shift - the additional shift of the scale in pixels
Version 1.5 2019.12.15
Выполнена оптимизация кода
Version 1.4 2019.05.26
Выполнена оптимизация кода с учётом обновлений MQL5.
Version 1.3 2015.12.16
Added the ability to shift indicator data by coordinate axes to any convenient place on the screen:
ShiftX - shift left/right
ShiftY - shift up/down
Version 1.2 2015.04.01
Added PairPreffix currency prefix parameter. Leave it blank for symbols without additional characters. Example of using with EURUSD.e:
UsePairs="EURUSD"
PairPreffix=".е"
Version 1.1 2015.01.30
Added the second method for calculating the daily currency power.
UseDayRangeCalculation=false - accumulative
UseDayRangeCalculation=true - range