Advanced ZigZag Dynamic
- Indicators
- Sergey Efimenko
- Version: 2.4
- Updated: 25 September 2021
- Activations: 10
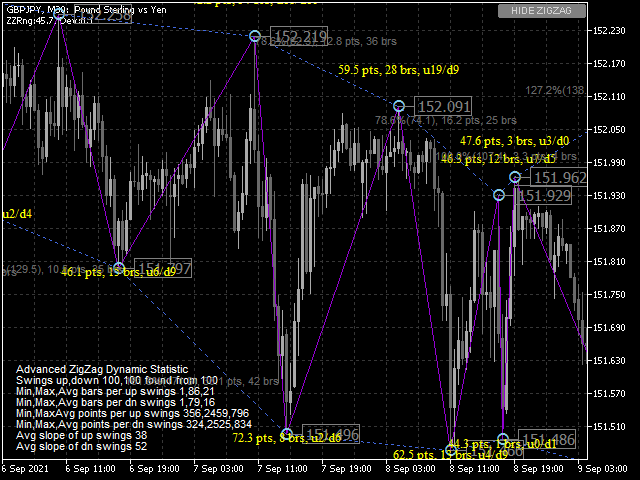
The difference from the standard ZigZag indicator is the following: instead of calculating new extremum points based on the number of bars, it uses the distance between the high and the low to calculate the extremum points. In addition, this distance is calculated dynamically on default and depends on price fluctuations for a selected period and the multiplier. The distance can be set as a fixed number.
In addition, it displays the reversal line, reaching which the previous extreme point is fixed and the zigzag changes the direction (blue line on the first screenshot). Like with all ZigZags, the last (i.e. the current extremum point) is not fixed and is not therefore drawn as a point (in case display of extremum points is enabled, which is on by default). Also adjacent extremum points are connected by a line, calculating the change relative to the three neighboring points in percent and the difference between them in bars. The length of the main zigzag line is displayed in points and bars. Any information can be disabled (all details are enabled by default).
The full list of parameters can be downloaded here: https://c.mql5.com/31/679/ParamZigZagEng.zip
Statistic settings:
- Calculate statistic - enable statistics calculation
- Statistic extremum count - number of vertices to analyze
- Statistic X shift - offset on the X axis
- Statistic Y shift - offset on the Y axis
- Statistic Y between imul - a ratio of the distance between the lines
- Statistic font name - font name
- Statistic font size - font size
- Statistic color - font color
- Statistic base corner - base corner
- Statistic anchor point - anchor point


Good Author and useful tools, 5 stars!