Market Profile Volume Relative Accumulation MT5
- Indicators
- Sergey Efimenko
- Version: 1.2
- Updated: 25 November 2021
- Activations: 10
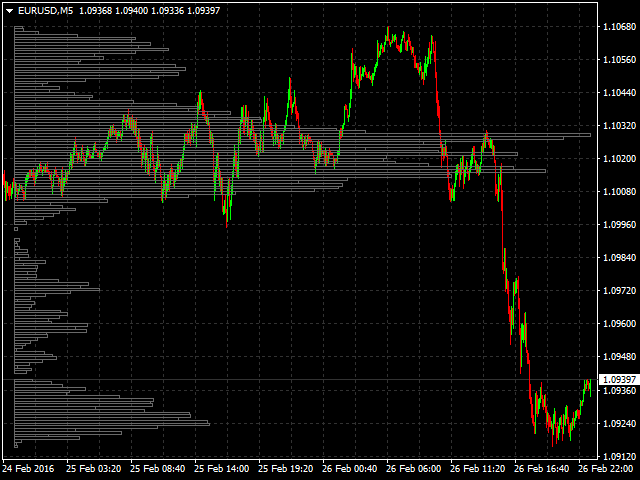
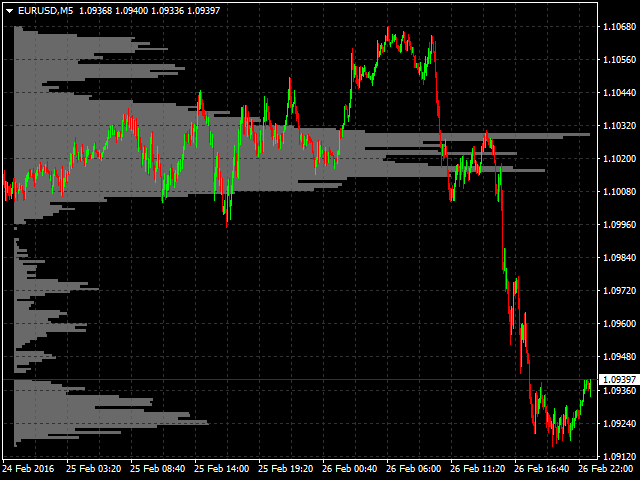
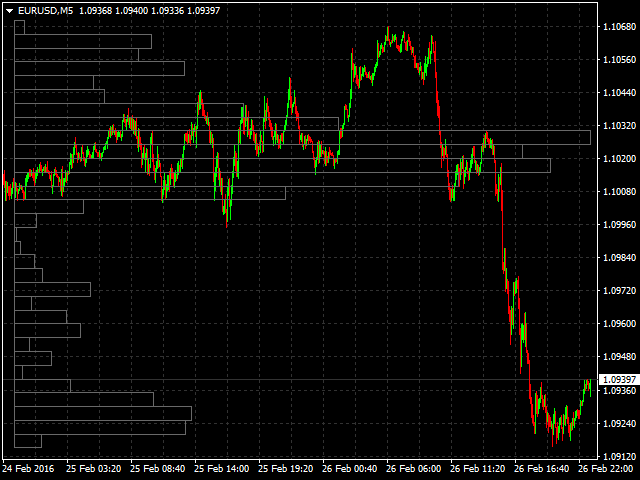
The uniqueness of this indicator lies in the volume accounting algorithm: accumulation occurs directly for the selected period without reference to the beginning of the day. The last bars can be excluded from the calculation, then the current data will have less influence on the significant levels (volumes) formed earlier.
For a more accurate calculation, data from the M1 graph is used by default. The step of distribution of price volumes is regulated. By default, the right border of the display is set to the bar corresponding to the beginning of the data used for analysis, but if necessary, it can be set to the bar you need. The length of the volume bands shown (the right border) is regulated by a coefficient, and it can also be shifted left or right to 0 (the current) bar or mirrored with reference to the current bar.
Parameters:
- Accumulation period - period of calculation of volume accumulation
- Number of excluded last bars - the number of the last bars excluded from the calculation
- Accumulation price step - step of volume summation by price parameters
- Graph length multiplier - length ratio of the displayed data
- Use data from timeframe - the chart (timeframe) used for the analysis
- Graph show shift - the shift to start the data display, if left as 0, then the data will be shown starting from the bar corresponding to the start time of the period of the analyzed data; "-1" - display on the left; "-2" - display on the left with an offset
- Graph color - color of the indicator bands
- Rectangle lines style - the border line style of the rectangles used for data display
- Rectangle fill - filling mode (also the sign of data being behind the chart)
- Add object description - add the data on the price levels and volume values to the "description" of the rectangles