VWAP and MVWAP
- Indicators
- Flavio Javier Jarabeck
- Version: 1.1
- Updated: 6 June 2020
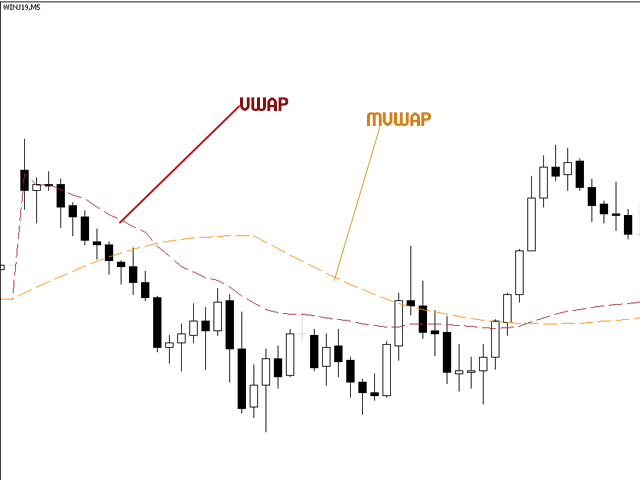
Volume Weighted Average Price (VWAP) is a trading benchmark commonly used by Big Players that gives the average price a Symbol has traded throughout the day. It is based on both Volume and price. Additionally we put in this indicator the MVWAP (Moving Volume Weighted Average Price).
For those who do not know the usage and the importance od this indicator I recommend a great article about this subject at Investopedia (https://www.investopedia.com/articles/trading/11/trading-with-vwap-mvwap.asp). We do not recommend to trade solely on this indicator. Use it as a one more tool in your toolbox to confirm Price and Market behaviour.
The VWAP indicator is designed to be used in Day Trades, since the calculation period for it is DAILY (1-day period).
The MVWAP can be used in highe Timeframes (i.e. daily)...
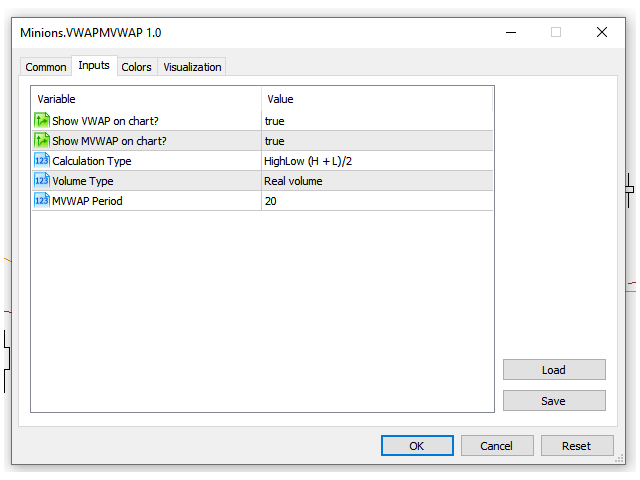
SETTINGS
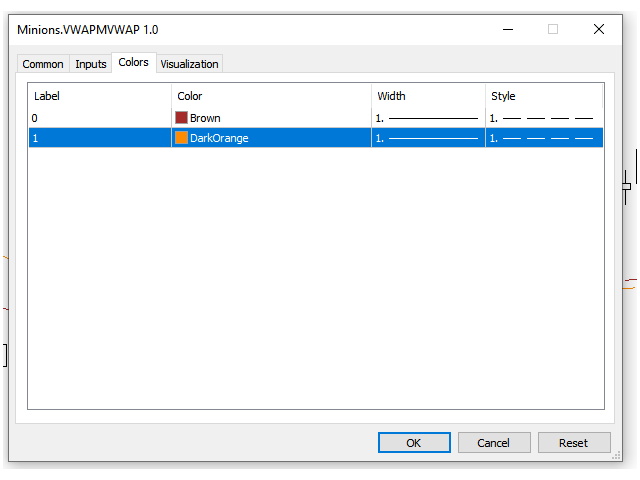
- Hability to Show/Hide the VWAP line on chart.
- Hability to Show/Hide the MVWAP line on chart.
- Choose the type of calculation of VWAP line.
- Volume Type used (Ticks or Real)
- Period of the MVWAP line.
Looking for more FREE VWAP-related indicators, here you go:
If you like this indicator, all I am asking is a little Review (not a Comment, but a REVIEW!)...
This will mean A LOT to me... And this way I can continue to give away Cool Stuff for Free...
With No Strings Attached! Ever!
Live Long and Prosper!
;)


One of the best I have seen in the market