Extended Fractals MT5
- Indicators
- Sergey Efimenko
- Version: 1.5
- Updated: 3 May 2022
- Activations: 10
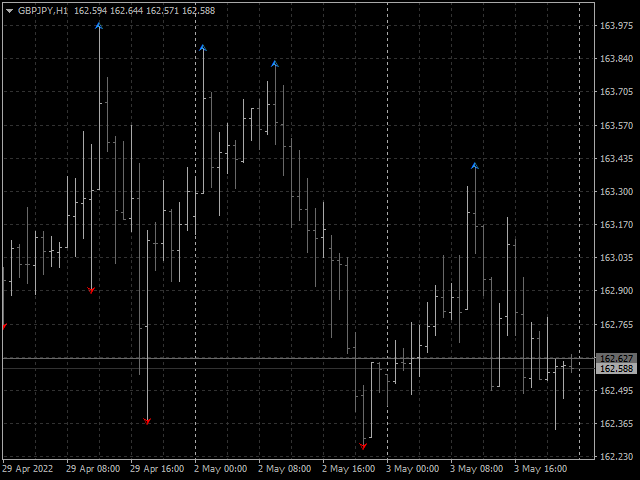
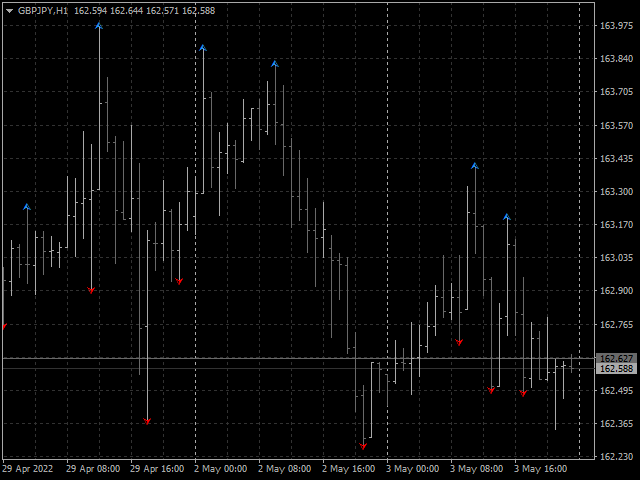
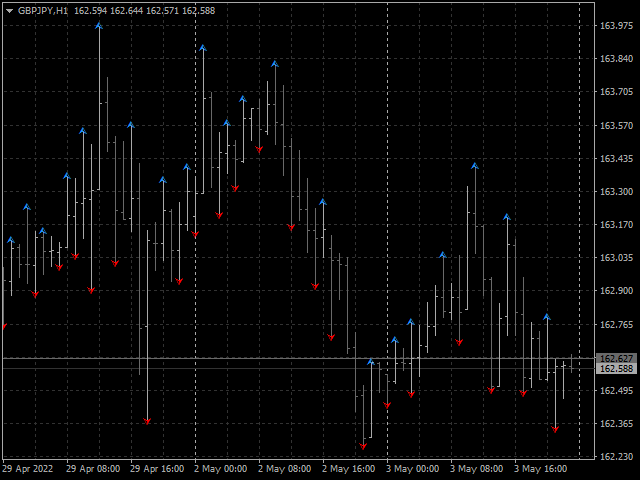
The indicator expands the capabilities of standard fractals, allows you to find, display and use them, calculating for any odd length, that is, 3 (DeMark points), 5, 7, 9 and so on bars. Fractals can be calculated not only by bar prices, but also by the values of moving averages of a given period.
All types of alerts are implemented in the indicators separately for upper and lower fractals.
To set the number of used bars, the Left fractal bars count variable is set in the settings (the default value is 2), the number in which sets the number of bars on one side excluding the central one, that is, it is equal to 2 for a standard fractal of 5 bars (2 bars * 2 sides + 1 central = 5 bars for finding and determining the fractal).
Parameters:- Period price MA - period of the moving average for calculating fractal prices (value 1 - corresponds to the usual calculation of fractals without averaging)
- Method price MA - moving average method for calculating fractal prices
- Price High - price to find highs
- Price Low - price to search for lows
- Left fractal bars count - the number of bars in the fractal on one side, excluding the top, that is, for a standard fractal of 5 bars, the value is 2
- Arrow shift from extremum - offset in points from the value of the extremum of the fractal to highlight the top
- Using high / low bars values to draw arrows - true value means that when displaying, the high / low of the candlestick should be taken into account
- Up arrow code - symbol for designating a fractal up
- Down arrow code - symbol for downward fractal
Alert settings:
- UpFractalAlert - enable / disable alerts when a new up fractal is formed
- DnFractalAlert - enable / disable alerts when a new down fractal is formed
- Enable Alert message on new Fractal - enable / disable text message
- Enable Notification on new Fractal - enable / disable sending notification
- Enable Sound on new Fractal - enable / disable sound notification
- SoundFileName - file name for sound notification