VolumeProfile
- Indicators
- Robert Hess
- Version: 1.37
- Updated: 20 October 2022
- Activations: 5
Descption:
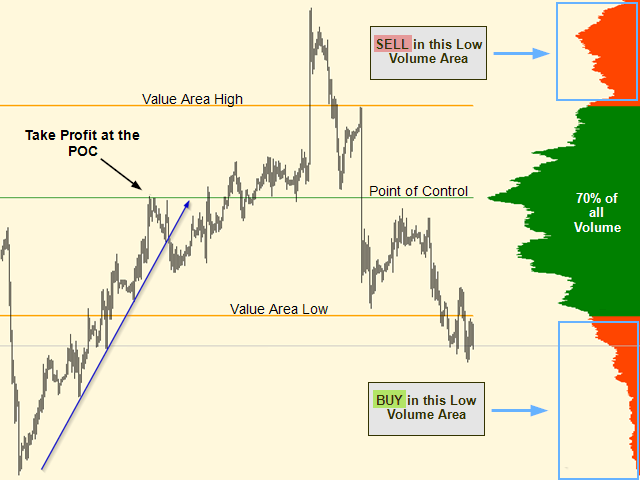
The Volume Profile displays detailed informations of historical trading activities at certain price levels (Market Profile).
So you can locate the areas with the best prices in the market and get an advantage about other market participants.
Features:
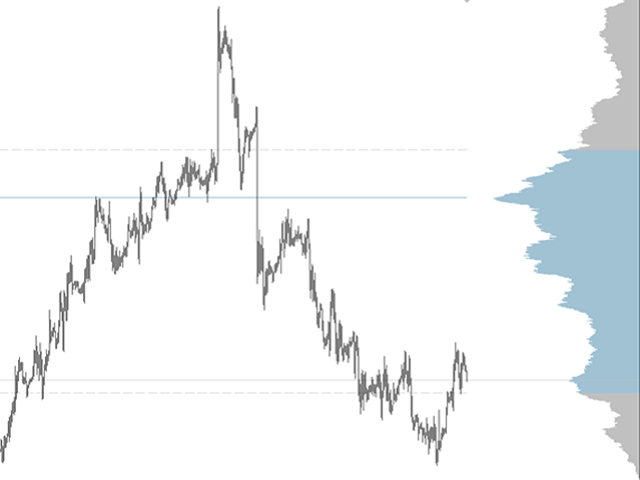
- Customizable Volume Profile / Market Profile
- Shows the "fair" Value Area with 70% of all Volume
- Shows critical low volume zones
- Shows VPOC, VAL and VAH Points
- Works on all timeframes
- Also available for MT5 (https://www.mql5.com/en/market/product/37391)
Settings:
| Variable | Standard Value | Description |
|---|---|---|
| Bar History | 1100 | Number of historical Bars to calculate from |
| Level of Detail | 1 | Set the resolution for the profile. For protection purposes the level of detail will be automaticaly recalculated if you open a high volume chart such as GOLD or BTC. |
| Auto set X-Position | true | - Set this value to "true" to let the volume profile automaticaly align to your screen. - Set this value to "false" to ajust the X-Position with the variable "X-Position" |
| X-Position | 0 | Set the X Position of the Indicator on the screen (recommended value is 30 to 60) |
| Scale | 10 | Adjust the size of the Indicator on the Chart (represents the % the Profile will cover of the Chart) |
| Profile_Color | Green | Color of the area with 70% of all volume (fair value area) |
| Profile_Color_VLow | OrangeRed | Color of the areas with low volume |
| Profile_Background | true | Set the profile to background |
| Value Area percentage | 70 | Set the percentage of the Value Area |
| Enable Point of Control | true | Enable/Disable POC Line |
| POC_Style | 0 | Set the Style of the Point of Control |
| POC_Color | Green | Set the Color of the POC |
| POC_Width | 1 | Set the Width of the POC |
| POC_Background | true | Set the POC to background |
| Enable Value Area Low Line | true | Enable/Disable VAL Line |
| VAL_Style | 0 | Set the Style of the Value Area Low Line |
| VAL_Color | Orange | Set the Color of the VAL |
| VAL_Width | 2 | Set the Width of the VAL |
| VAL_Background | true | Set the VAL to the Background |
| Enable Value Area High Line | true | Enable/Disable VAH Line |
| VAH_Style | 0 | Set the Style of the Volume Area High |
| VAH_Color | Orange | Set the Color of the VAH |
| VAH_Width | 2 | Set the Width of the VAH |
| VAH_Background | true | Set the VAH to the Background |


I was looking for something exactly like this when I stumbled across it a short while ago. I don't use many indicators on my charts, but this one is one of the few that I do use. It gives a very clear broader picture of price action, an I take consideration of its input before every trade I take. I can adjust the colors so it's quite subtle & doesnt take over the chart. Because it gives indications of every time frame, it's absolutely fundamental and underpins all my trading. Well done Robert...