RBR Indicator Check
- Utilities
- Version: 2.1
- Activations: 10

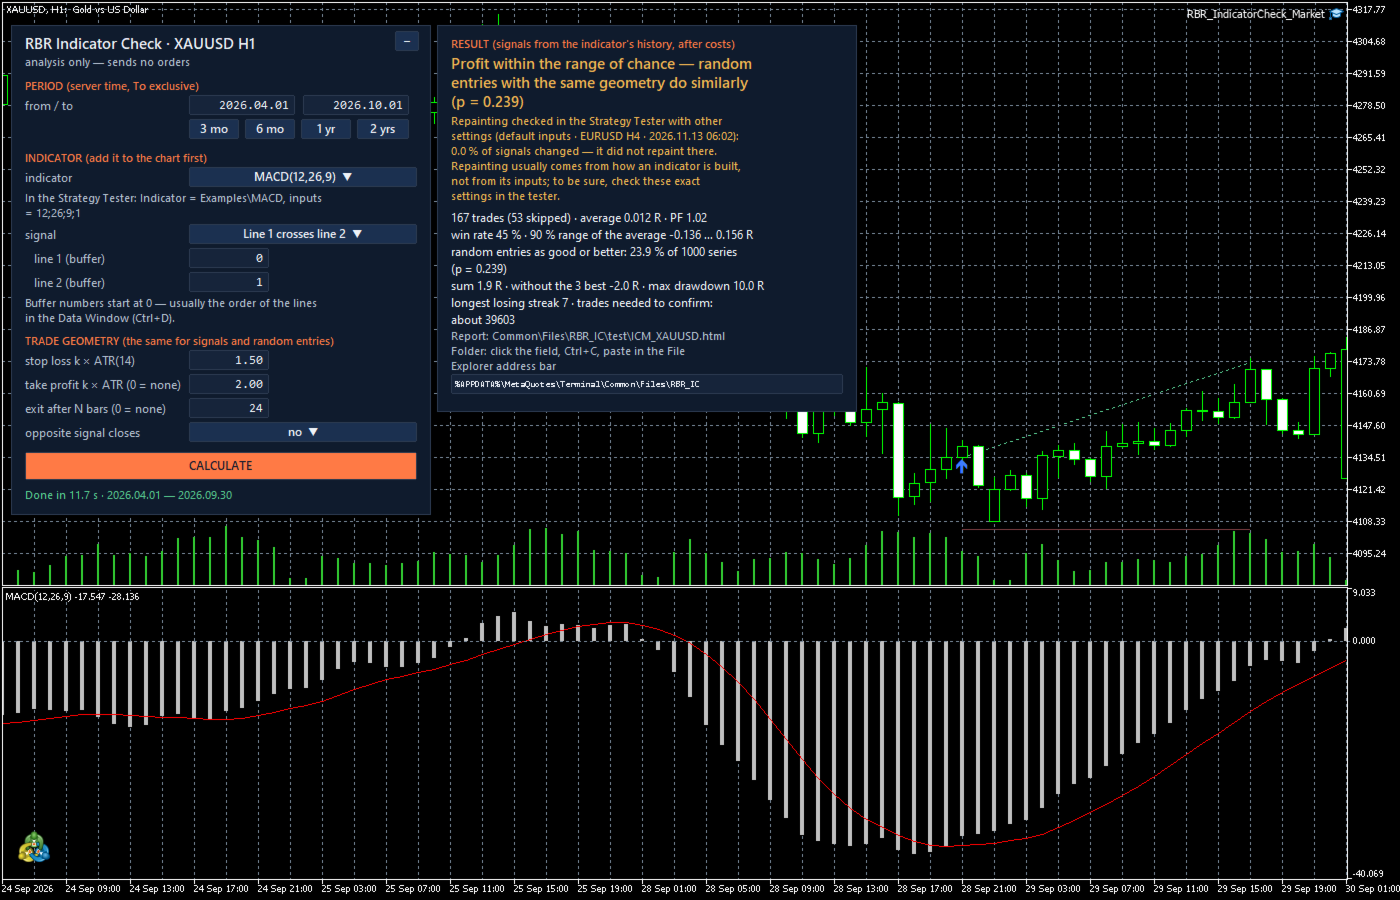
RBR Indicator Check answers one question: do the signals of your indicator know anything, or would random entries with the same stop and target do just as well? Pick an indicator you already have on the chart, press CALCULATE, and the panel shows the result of its signals after spread, commission and swap, the comparison with 1,000 series of random entries, and a verdict in one sentence. In the Strategy Tester it also checks whether the indicator changes its past signals (repainting). The EA sends no orders: all trades are simulated in code.
What it measures
- Signals as they appeared: the buffer is read on the first tick of a new candle and the entry is at that candle's open (BUY at the ask, SELL at the bid). No look into the future.
- Three signal types: A - arrows (a BUY buffer and a SELL buffer), B - sign of one buffer (above zero long, below zero short, e.g. a histogram), C - line X crosses line Y (e.g. MACD and its signal line, two moving averages).
- The same trade geometry for signals and random entries: stop loss k x ATR(14), take profit k x ATR(14) or none, exit after N candles, optional exit on the opposite signal; one position at a time.
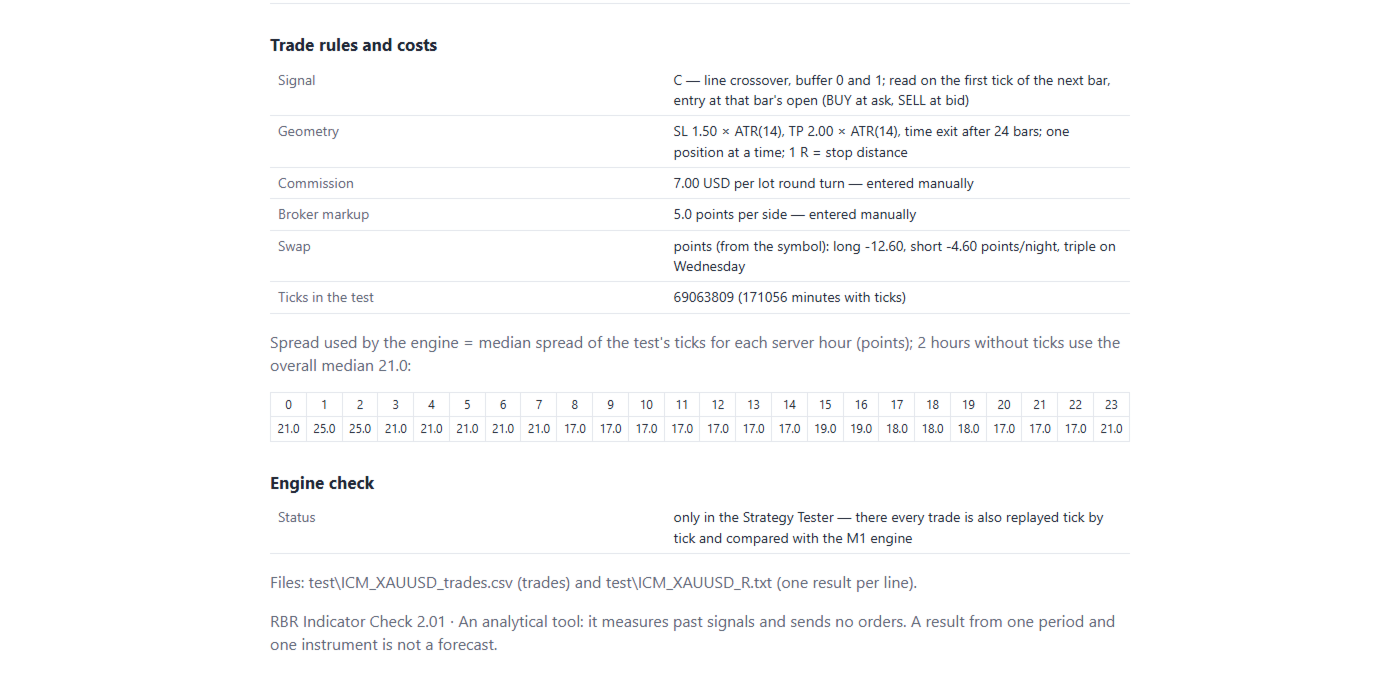
- Costs of your account: the spread is the median of the real ticks for each server hour; commission and broker markup are measured from your own trade history; swap comes from the symbol.
- Random entries: 1,000 series with the same geometry and the same costs. If random entries do about as well, the profit is within the range of chance.
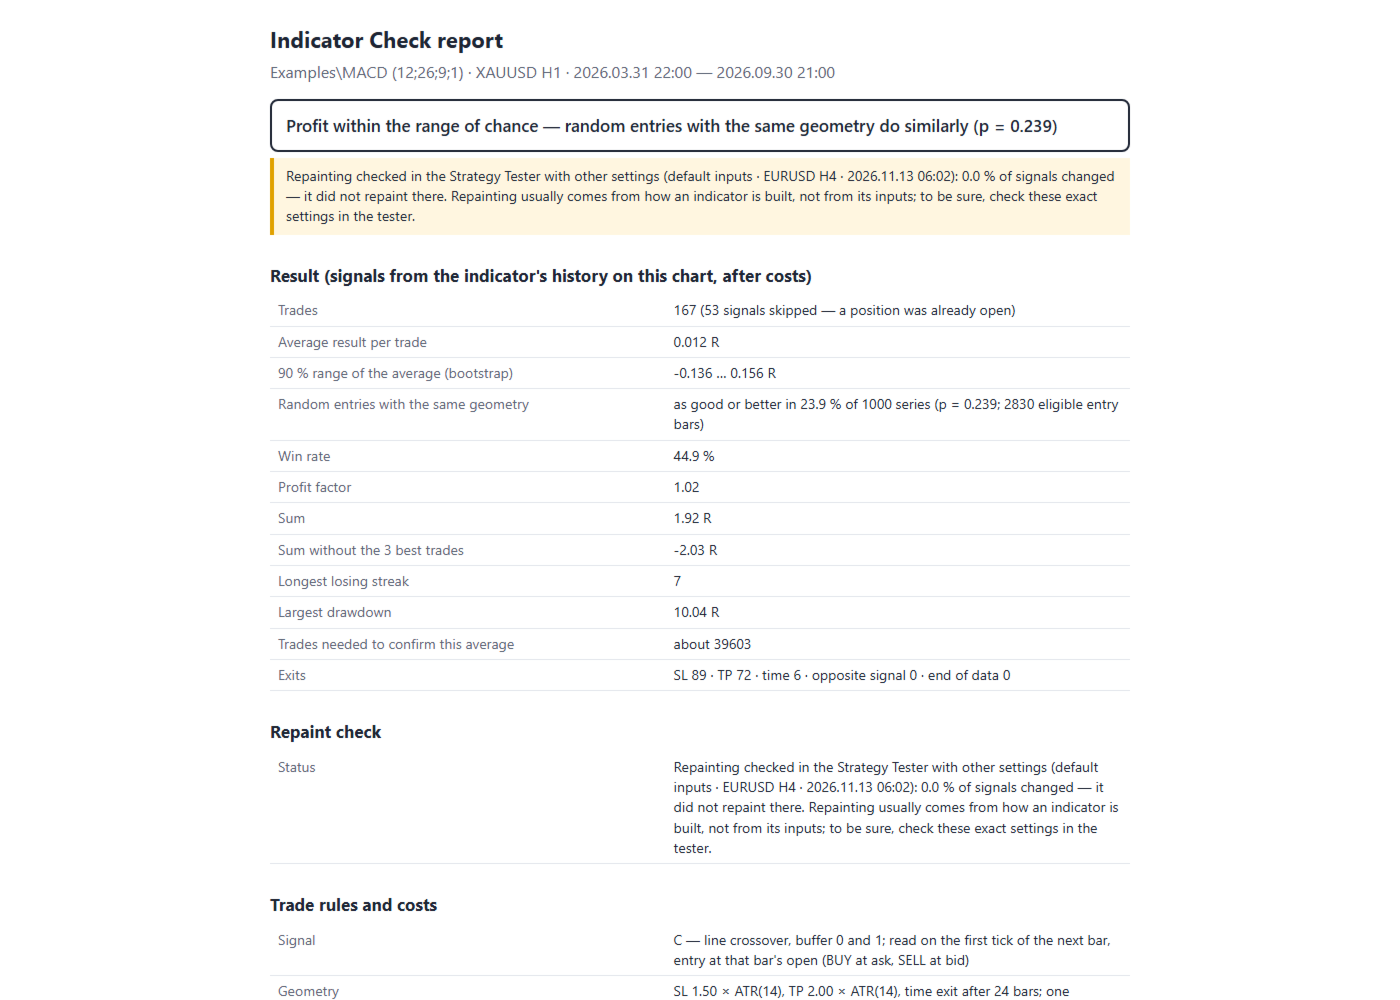
- Repainting (Strategy Tester): the indicator is read candle by candle as it appeared and compared with its history at the end. If more than 5 % of the signals vanished or were added later, the report says so. The panel on the chart then shows the result of that check for the indicator.
- Engine check (Strategy Tester): every trade is also replayed tick by tick and compared with the M1-candle engine.
The verdict
No edge, profit within the range of chance, better than random entries but not covering the costs, or edge visible in this period - always with the reminder to check another period and instrument. Next to it: average result per trade in R with a 90 % bootstrap range, win rate, profit factor, sum without the 3 best trades, longest losing streak, largest drawdown and how many trades would be needed to confirm the average.
How to use it
- Add your indicator to the chart (main window or a lower window) with the settings you use, then attach RBR Indicator Check to the same chart. It reads commission and broker markup from your account history and opens the panel. On an account without trades, enter the commission in the inputs.
- In the panel choose the period, the indicator, the signal type, the buffer numbers and the geometry, then press CALCULATE. Trades are drawn on the chart with the verdict and the numbers next to them.
- Run the same indicator once in the Strategy Tester (model "Every tick based on real ticks"): there the repainting is checked, and the panel shows that result from then on. The HTML report and the trades (CSV) are saved in Common\Files\RBR_IC.
Notes
- Works with indicators that store their signals in buffers. An indicator that draws only with objects cannot be read; the report says so.
- Some indicators bought on the Market may refuse to run inside another program or in the tester; that depends on their author.
- The engine uses M1 candles with the hourly median spread; around weekend gaps and data releases the real spread is often larger. The report shows the largest difference to the tick-by-tick run.
- The panel and the report follow the terminal language (English, Polish, German) or the language chosen in the inputs.
- A result describes one period and one instrument and is not a forecast.