Nested Candles
- Indicators
- Version: 1.0

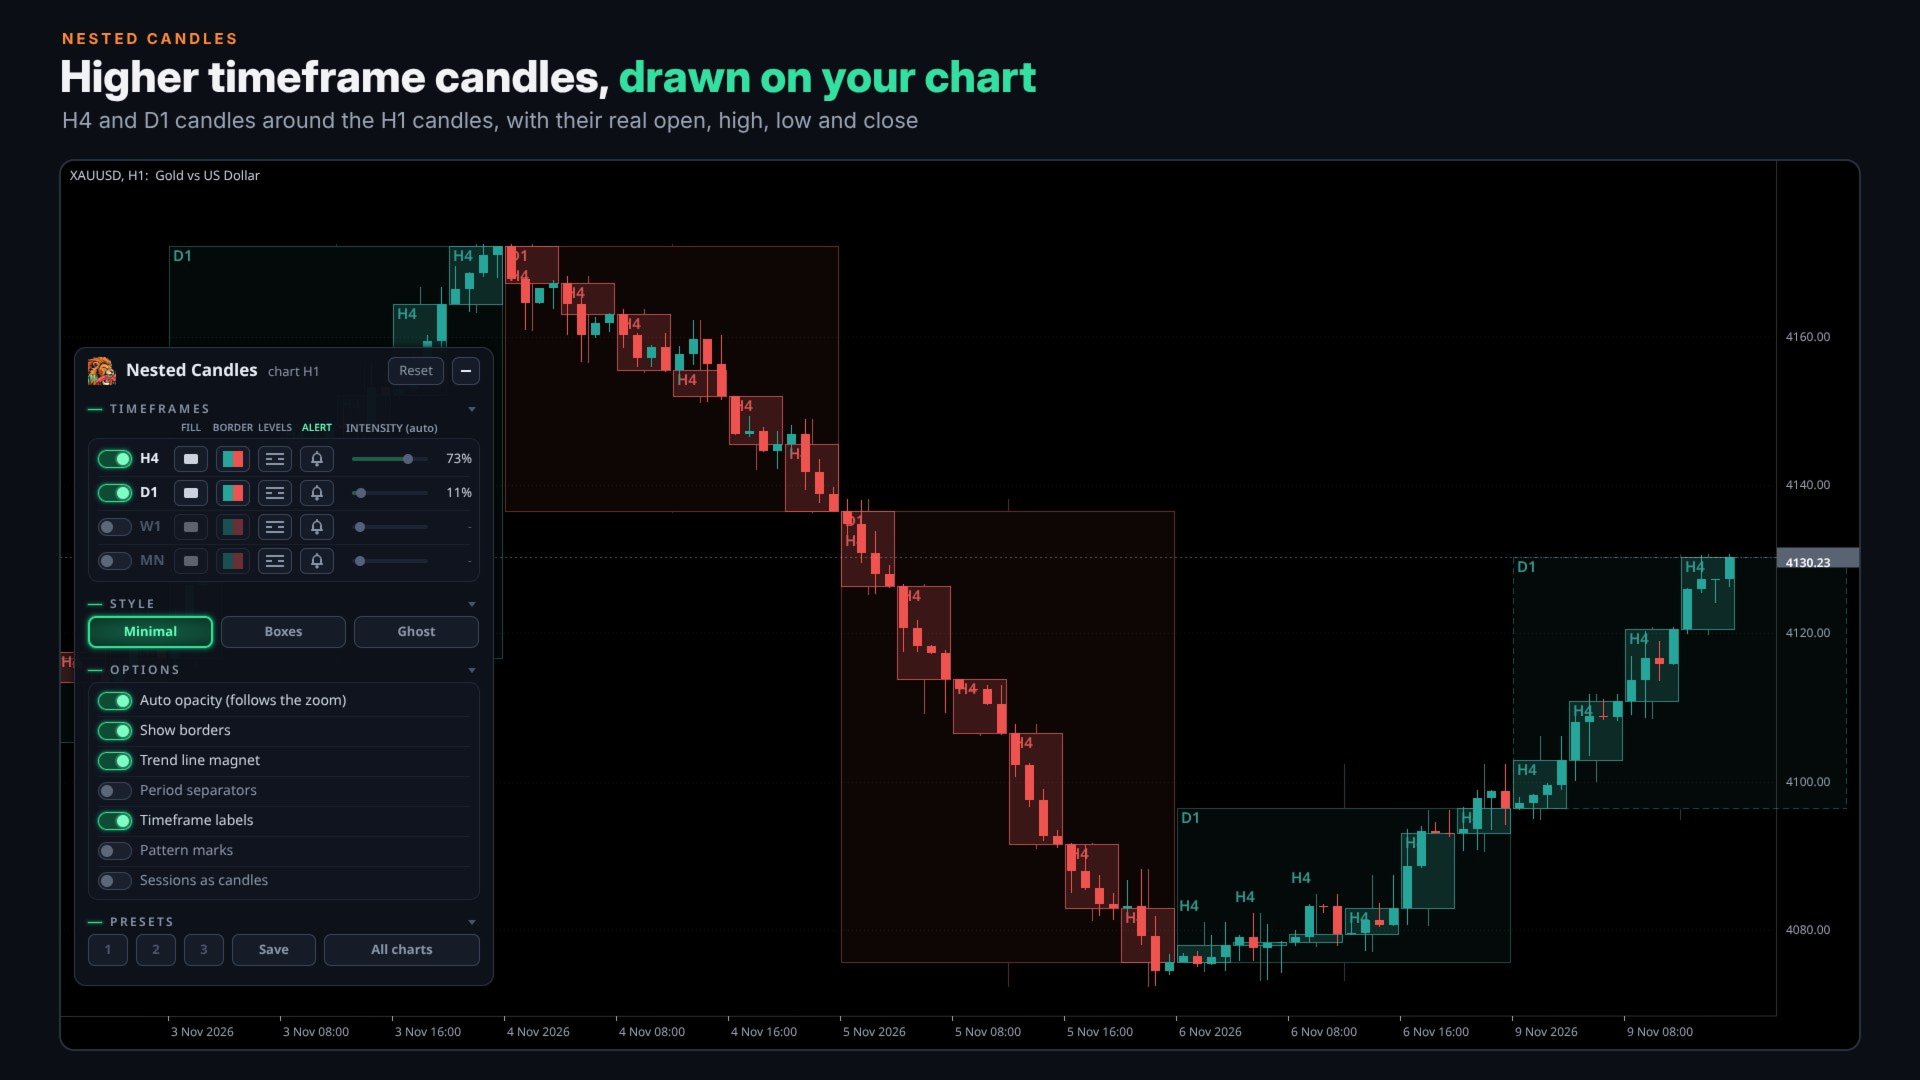
Nested Candles draws the candles of higher timeframes around the candles of your chart. Each H4, D1 or W1 candle is drawn with its real open, high, low and close, and frames exactly the smaller candles that formed it. You see the bigger picture and the detail on one chart, without switching timeframes. It works on any symbol: forex pairs, metals, indices and crypto.
If you find it useful, please leave a star rating and a short comment in the Reviews tab. It helps me keep improving this tool. Thank you.
How it works
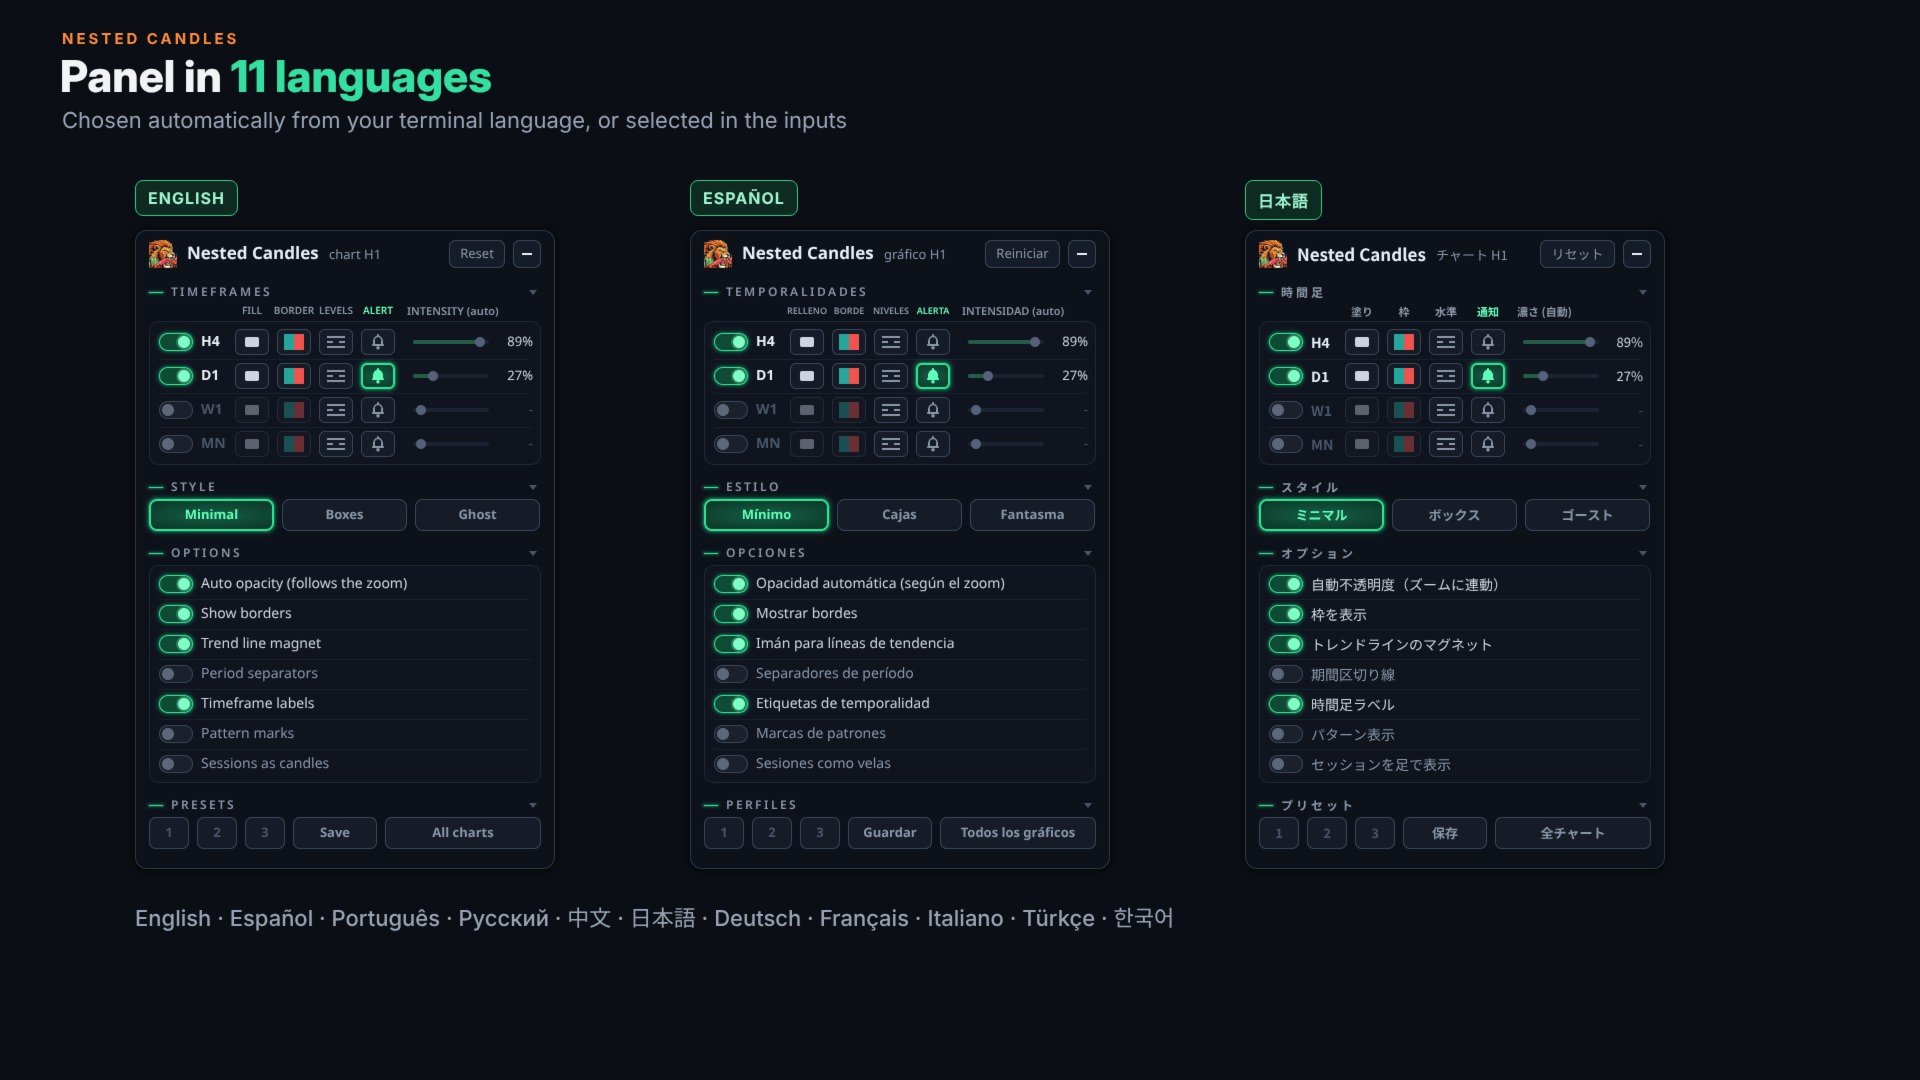
Add the indicator to any chart and a small panel lists the timeframes above the one of your chart (from M5, M15, H1, H4, D1, W1 and MN), plus any extra timeframe you add in the inputs. Switch each one on or off with one click. The candle that is still forming is drawn with a dashed outline and updates with every tick.
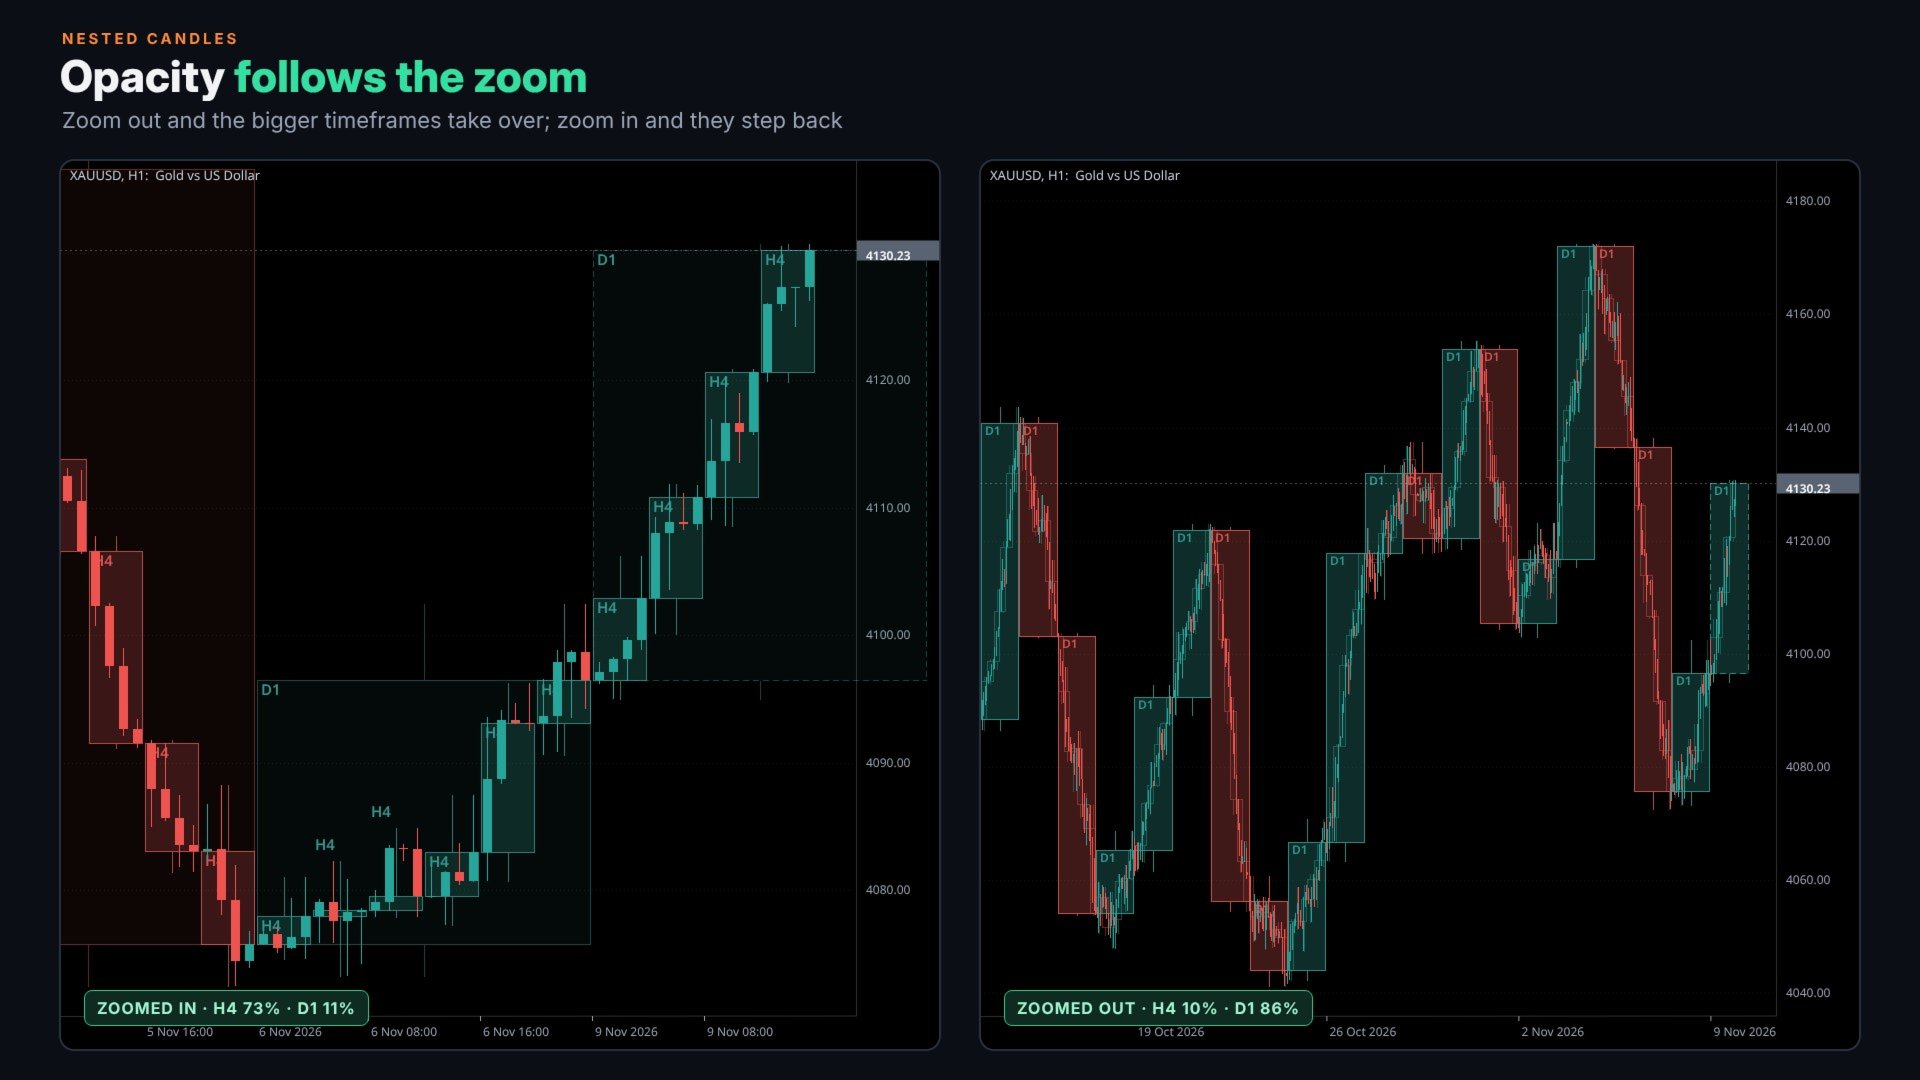
Opacity follows the zoom. When you zoom out, the bigger timeframes become more visible and take over; when you zoom in, they step back so the chart candles stay readable. If you prefer fixed values, turn off the automatic opacity and use the intensity slider of each timeframe.
Styles and tools
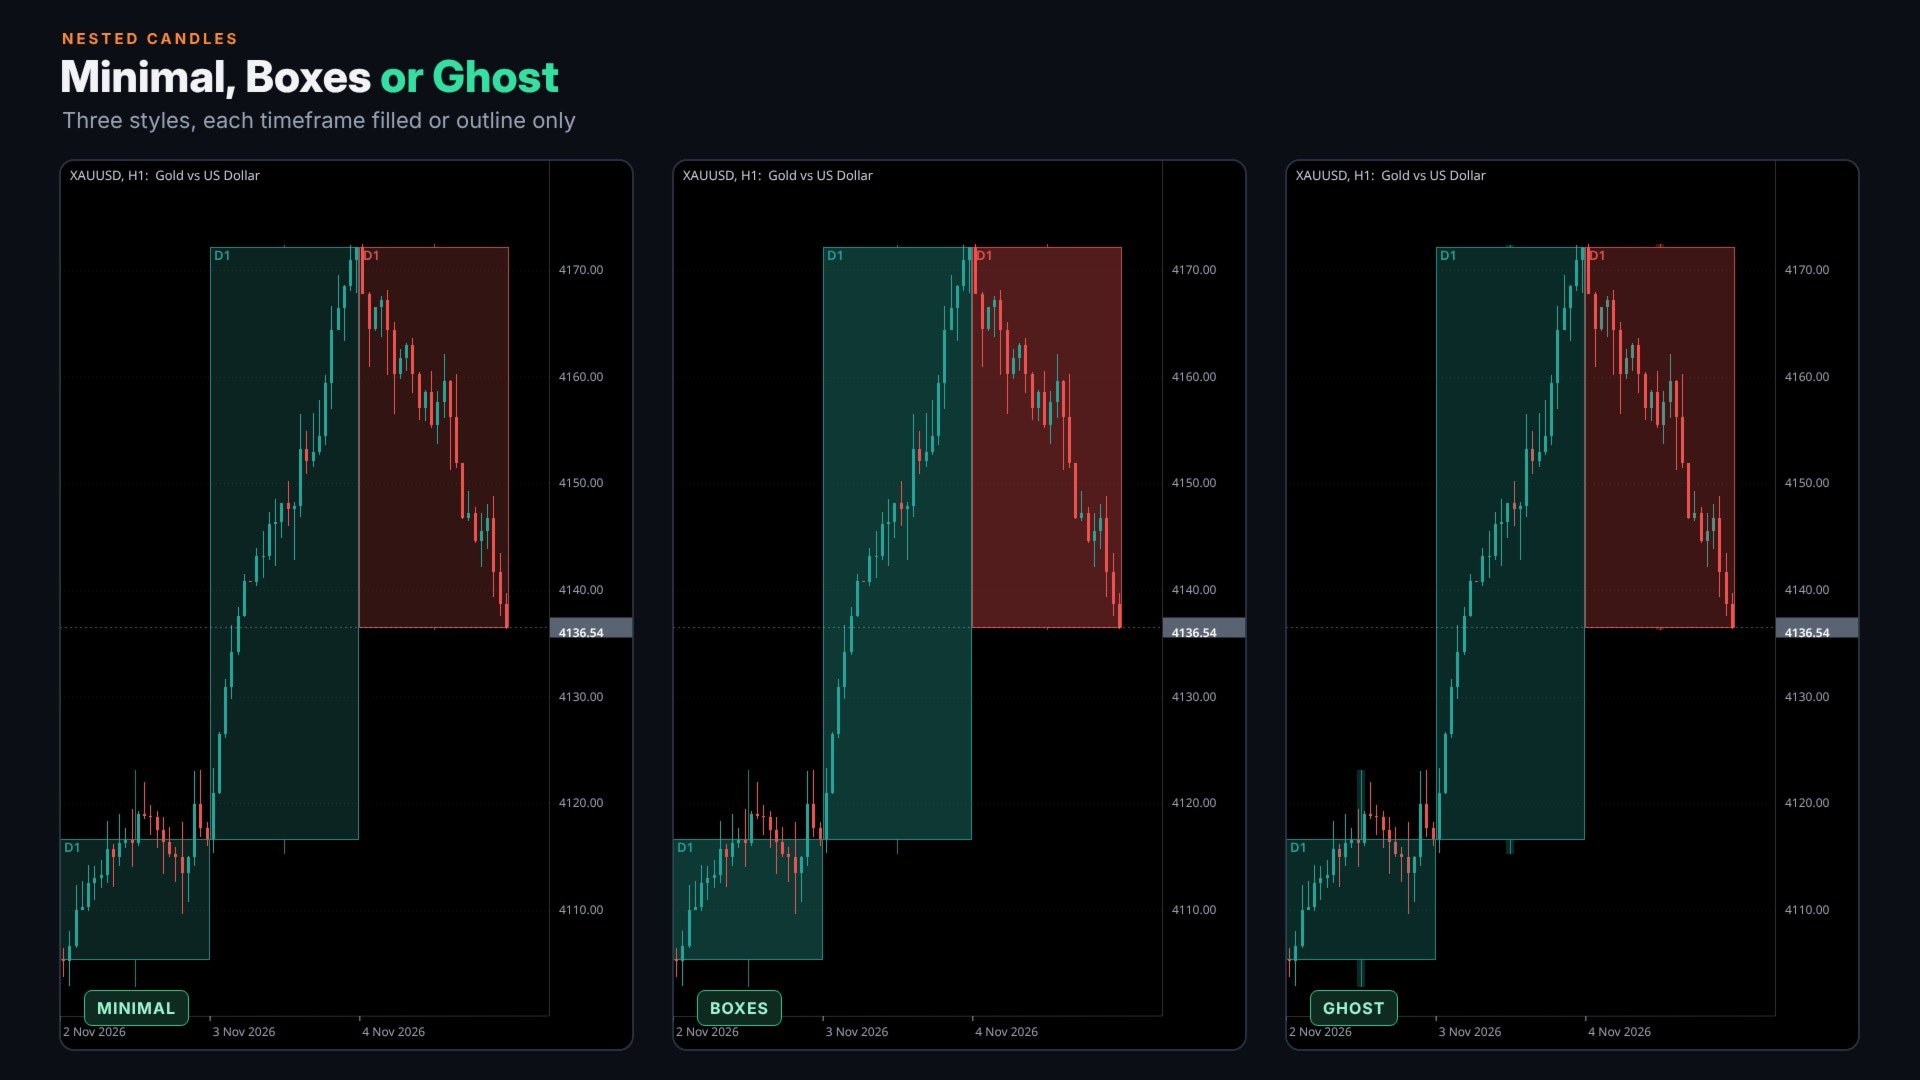
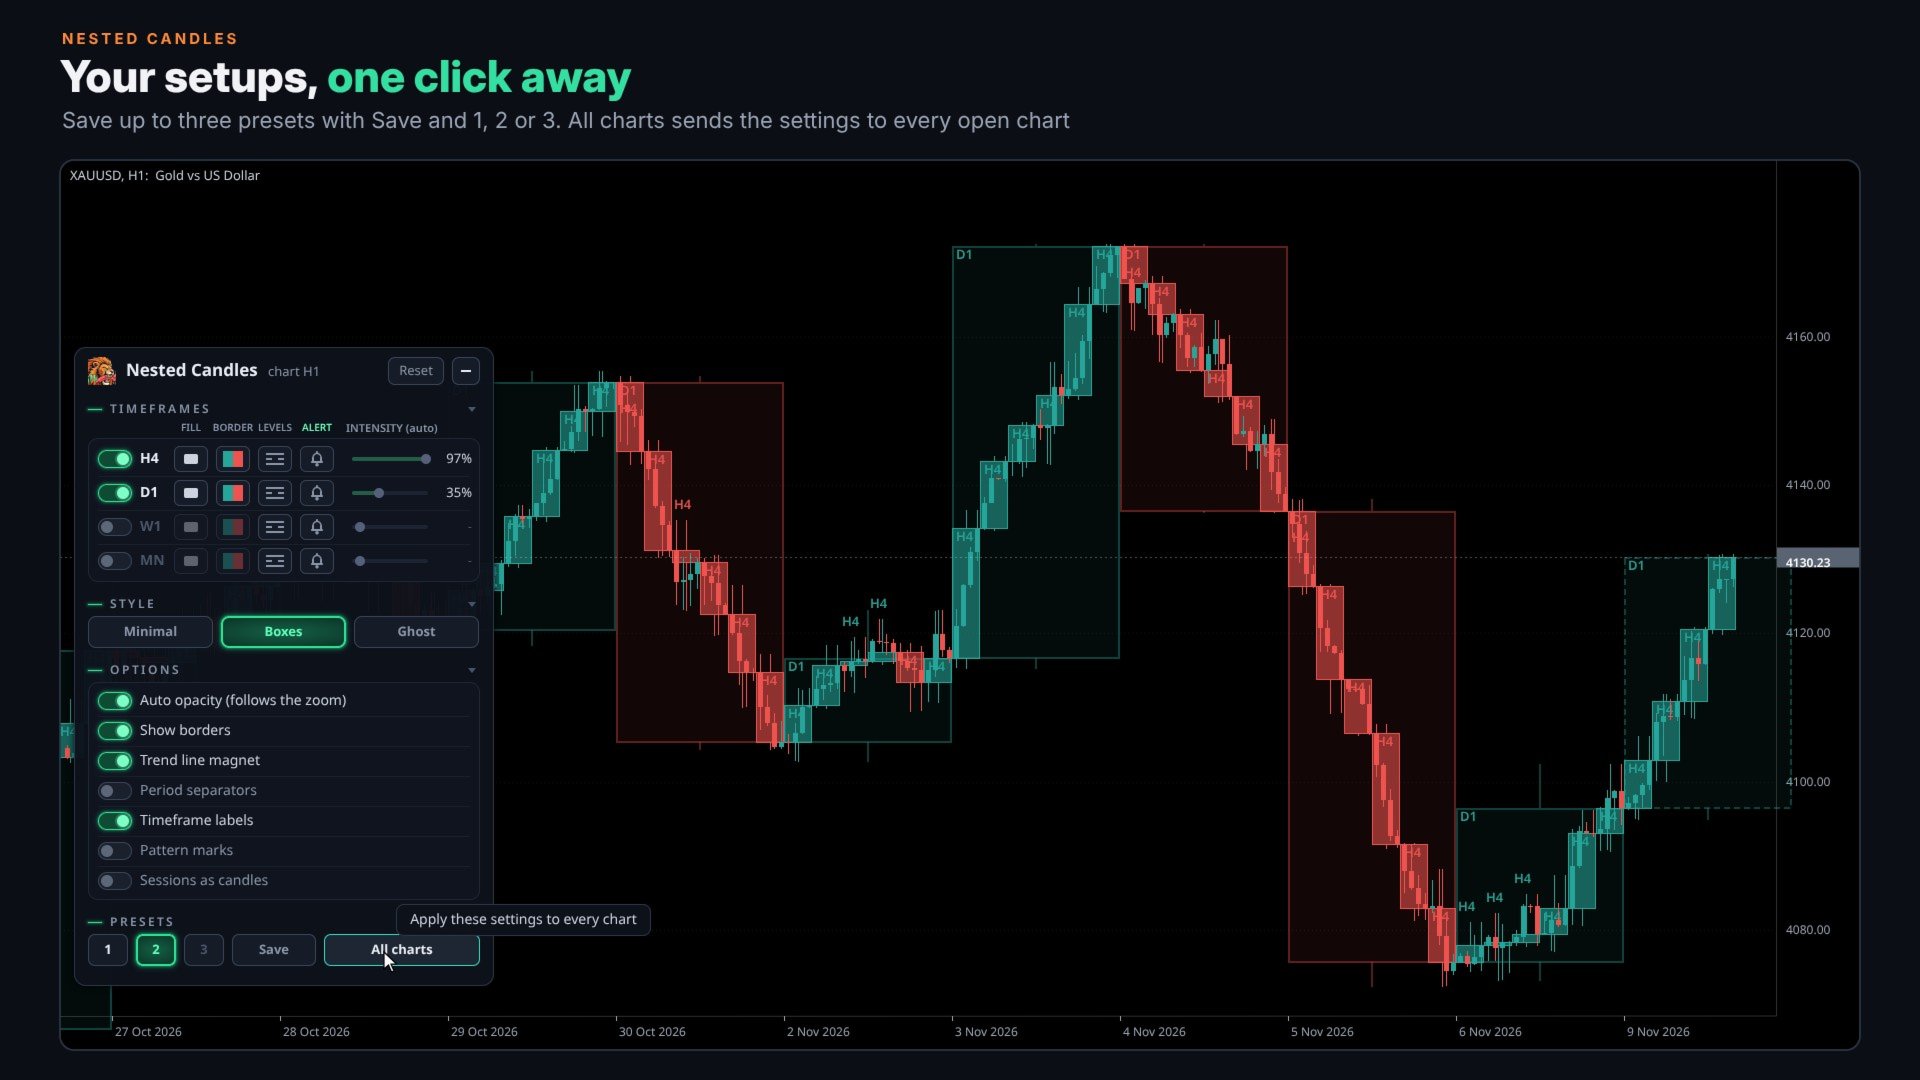
There are three styles: Minimal (thin outline and soft fill, the default), Boxes and Ghost. Each timeframe can be filled or outline only, with automatic, gray or custom border colors. The panel also gives you:
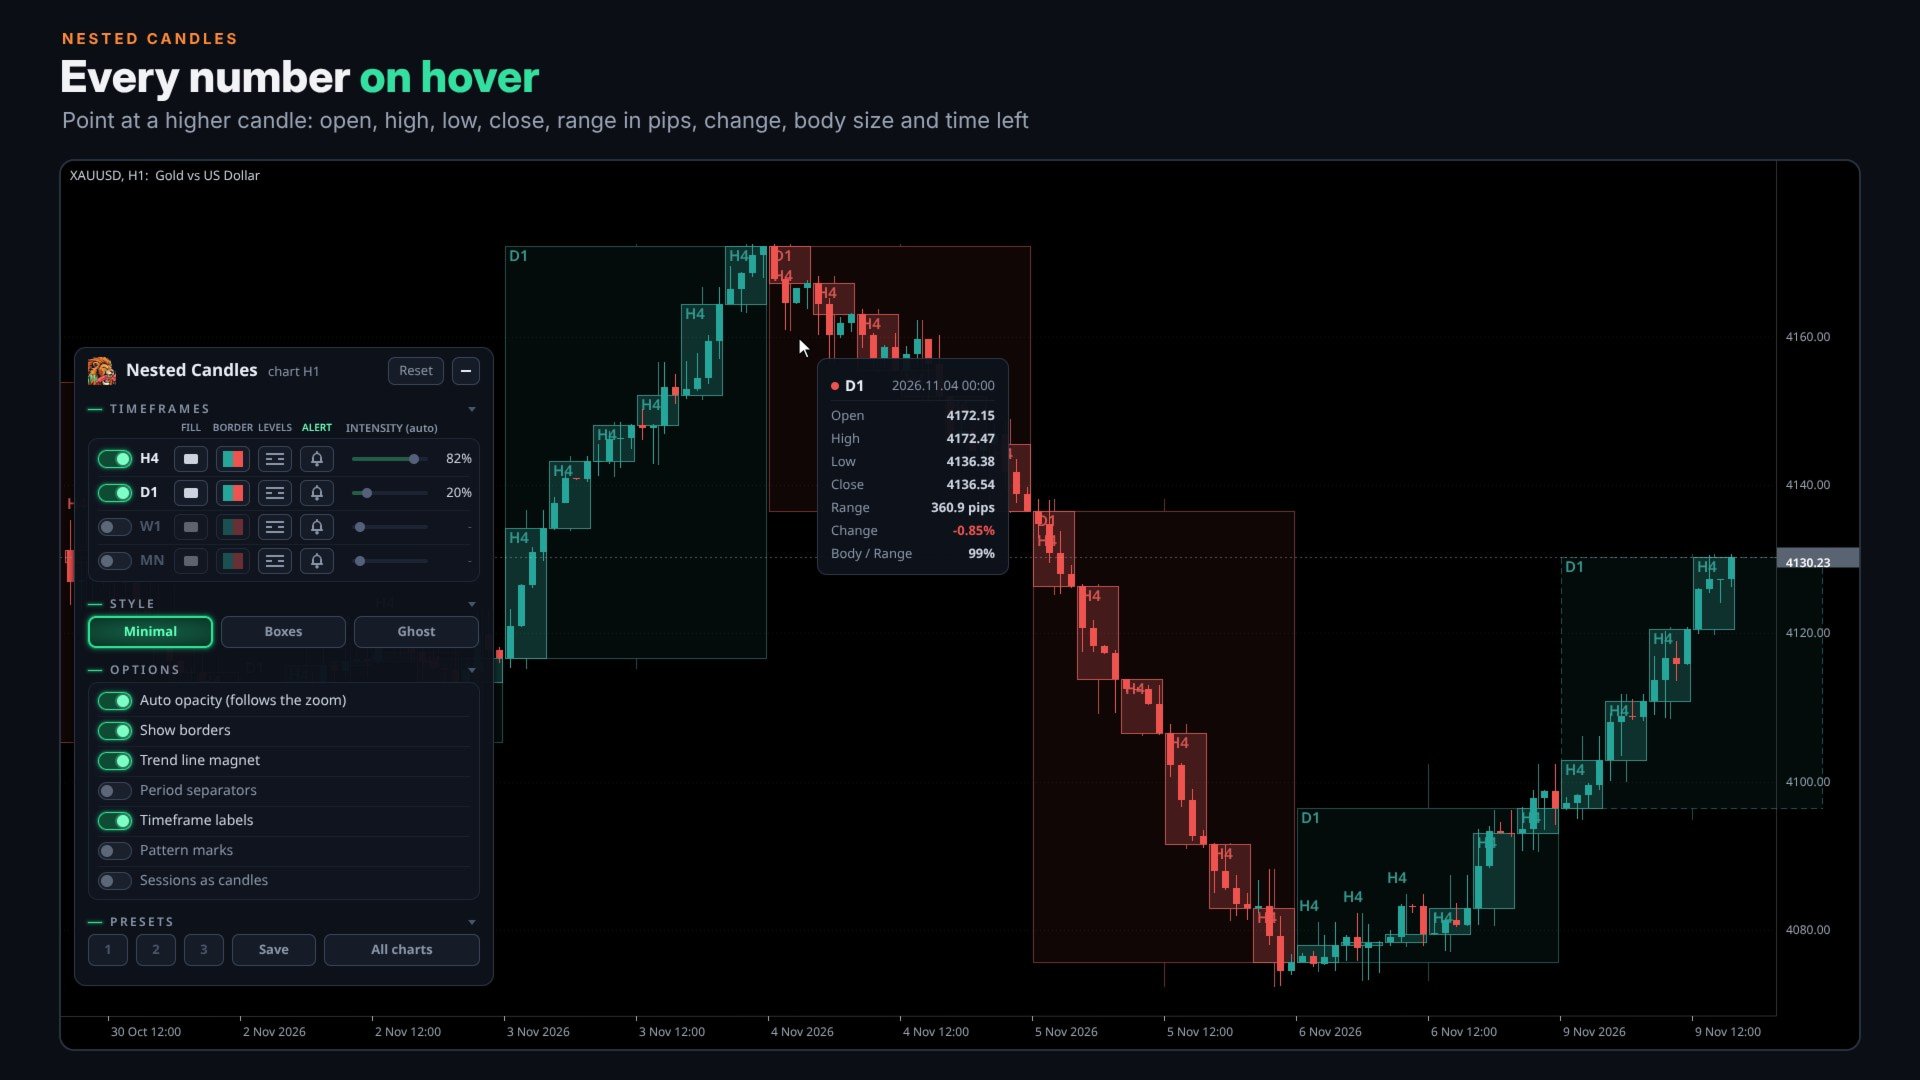
- Info card: point at a higher candle to see its open, high, low, close, range in pips, change, body size and the time left to close.
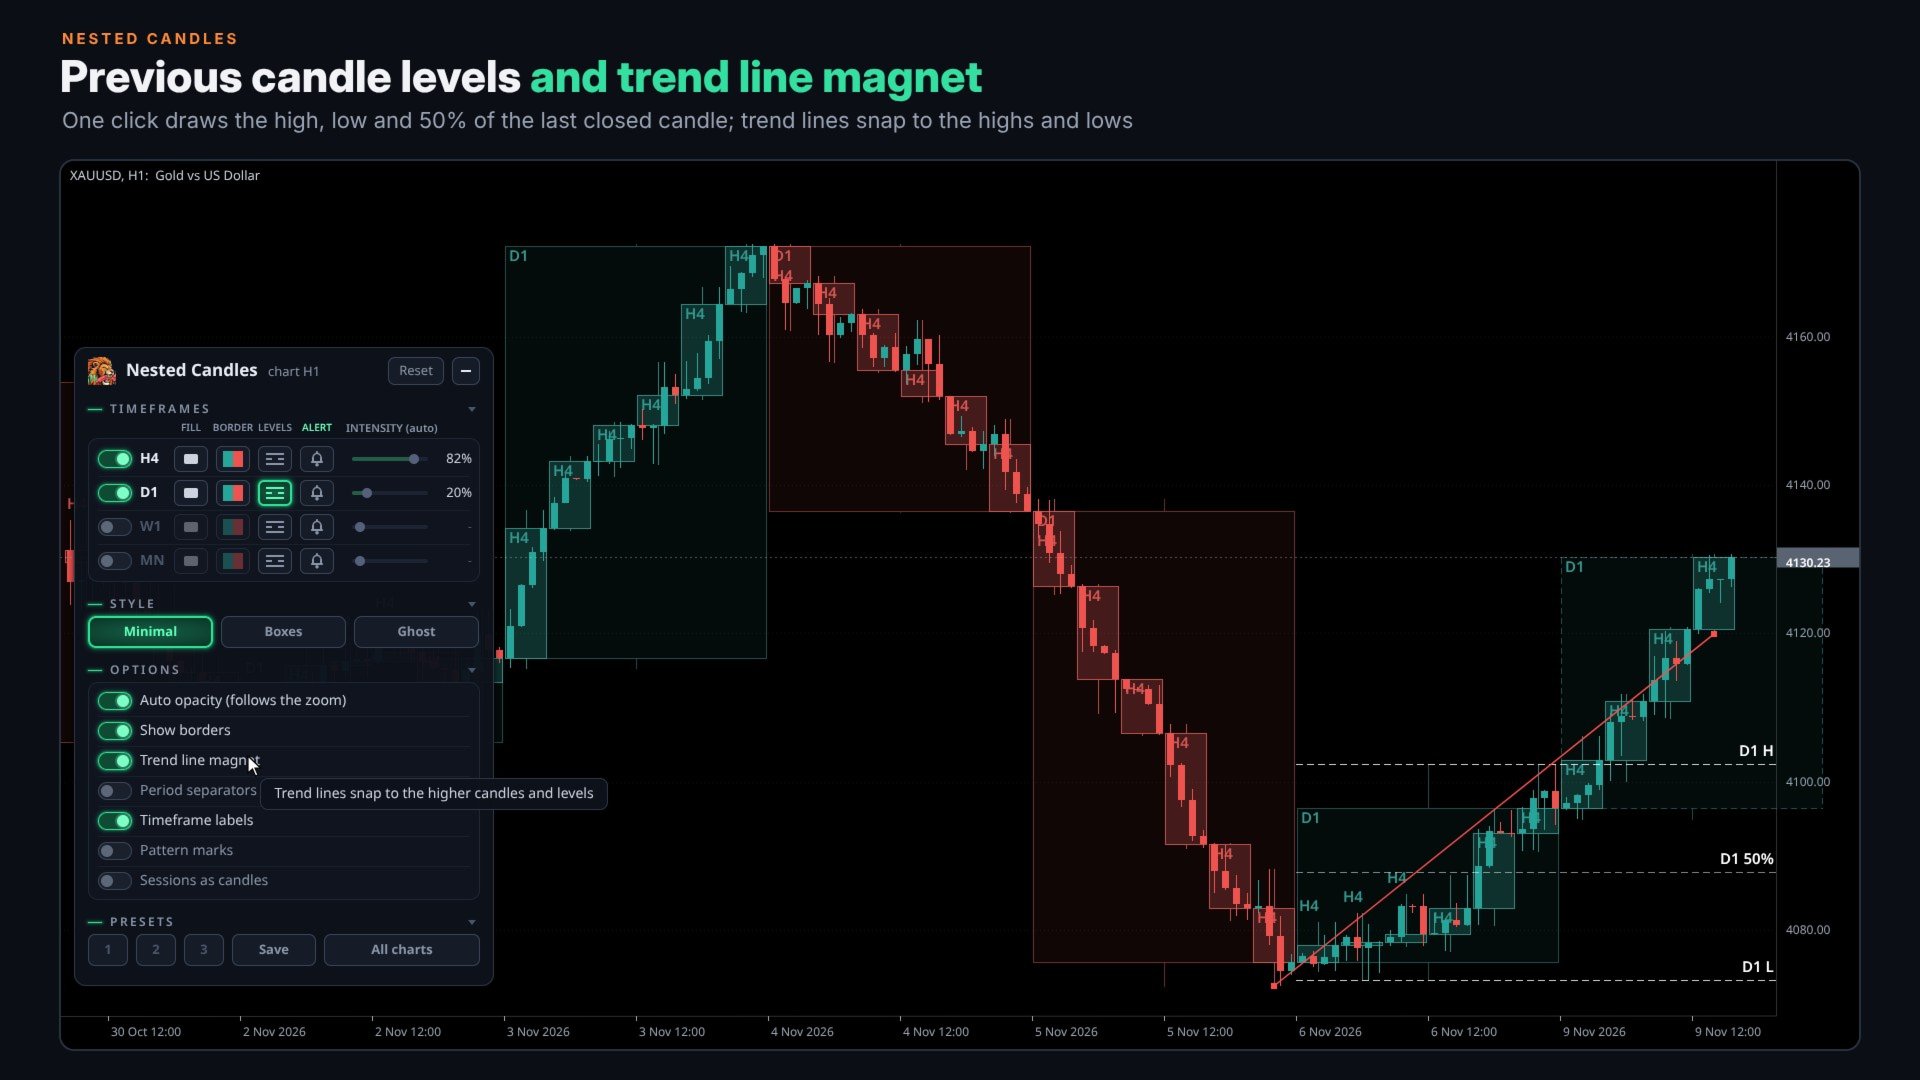
- Previous candle levels: one click draws the high, low and 50% of the last closed candle of that timeframe.
- Trend line magnet: trend lines snap to the highs and lows of the higher candles and to those levels.
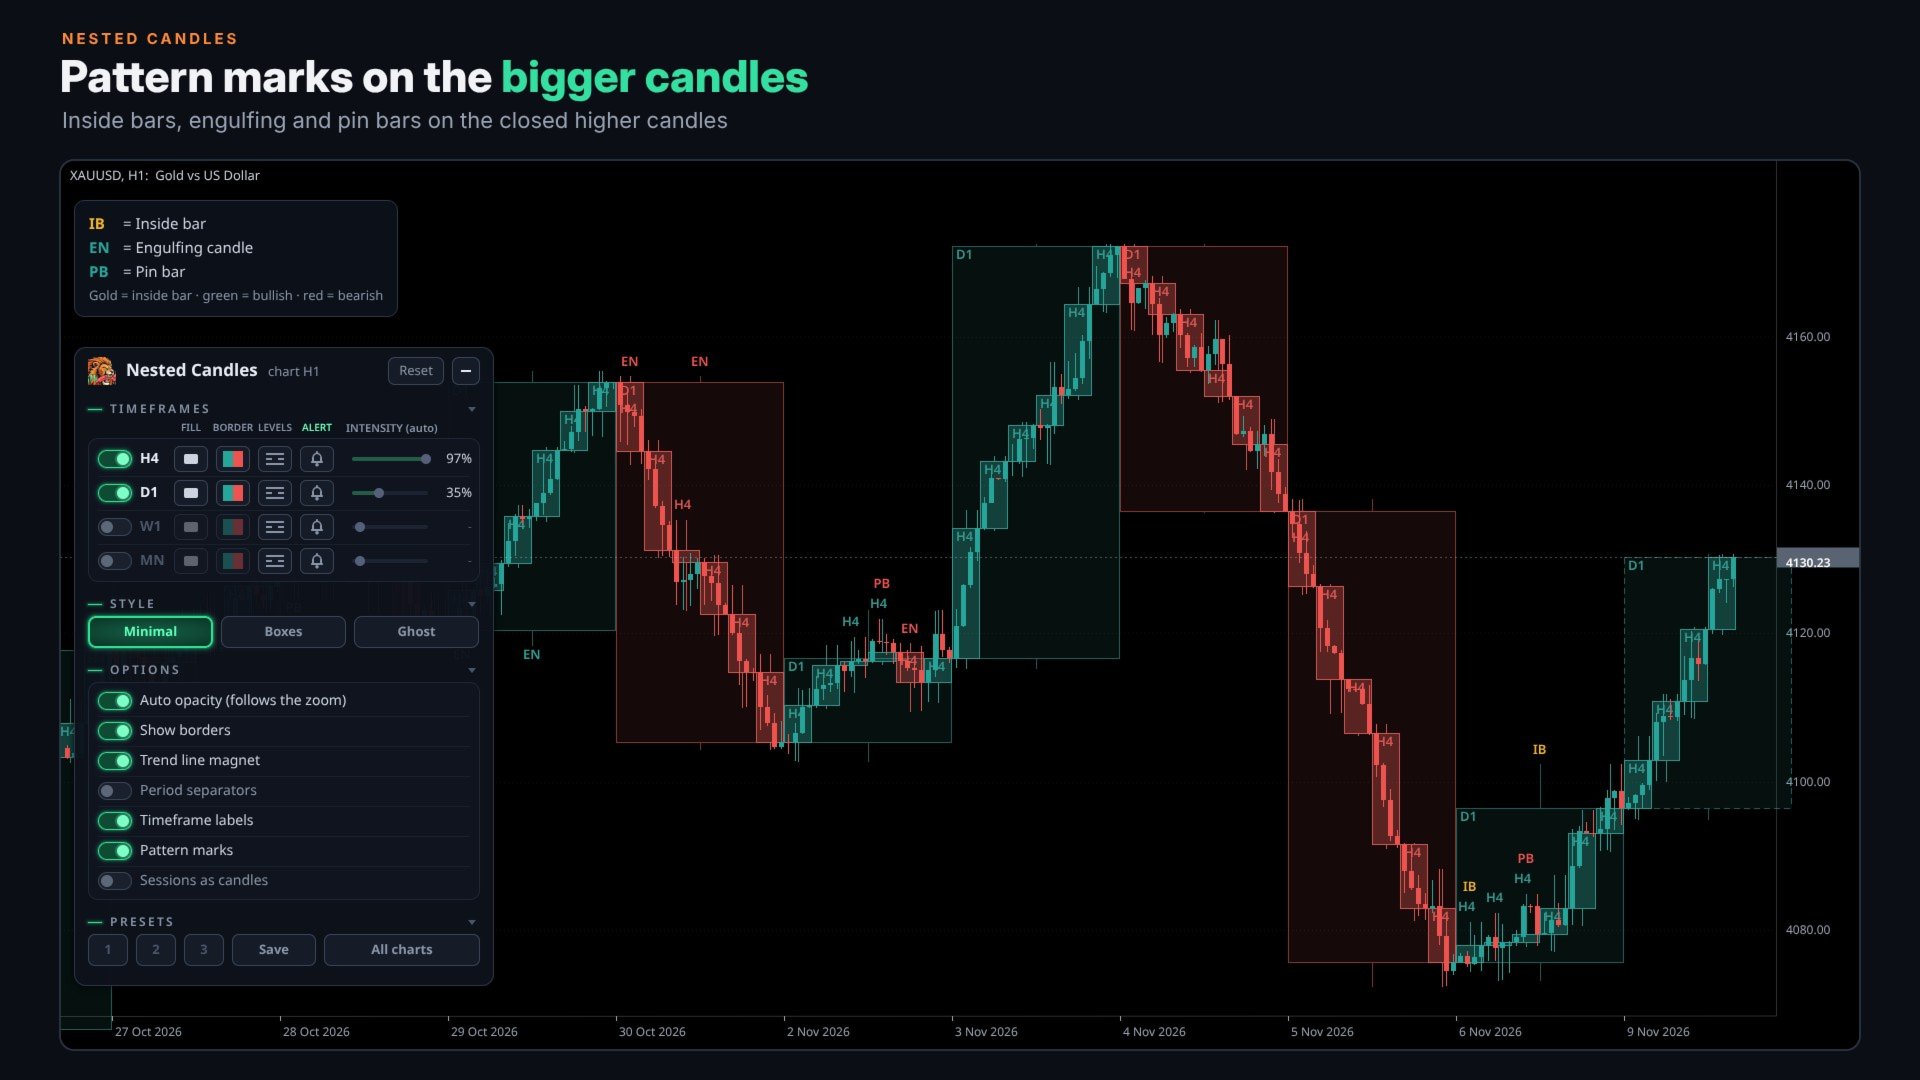
- Pattern marks: inside bars, engulfing and pin bars on the closed higher candles.
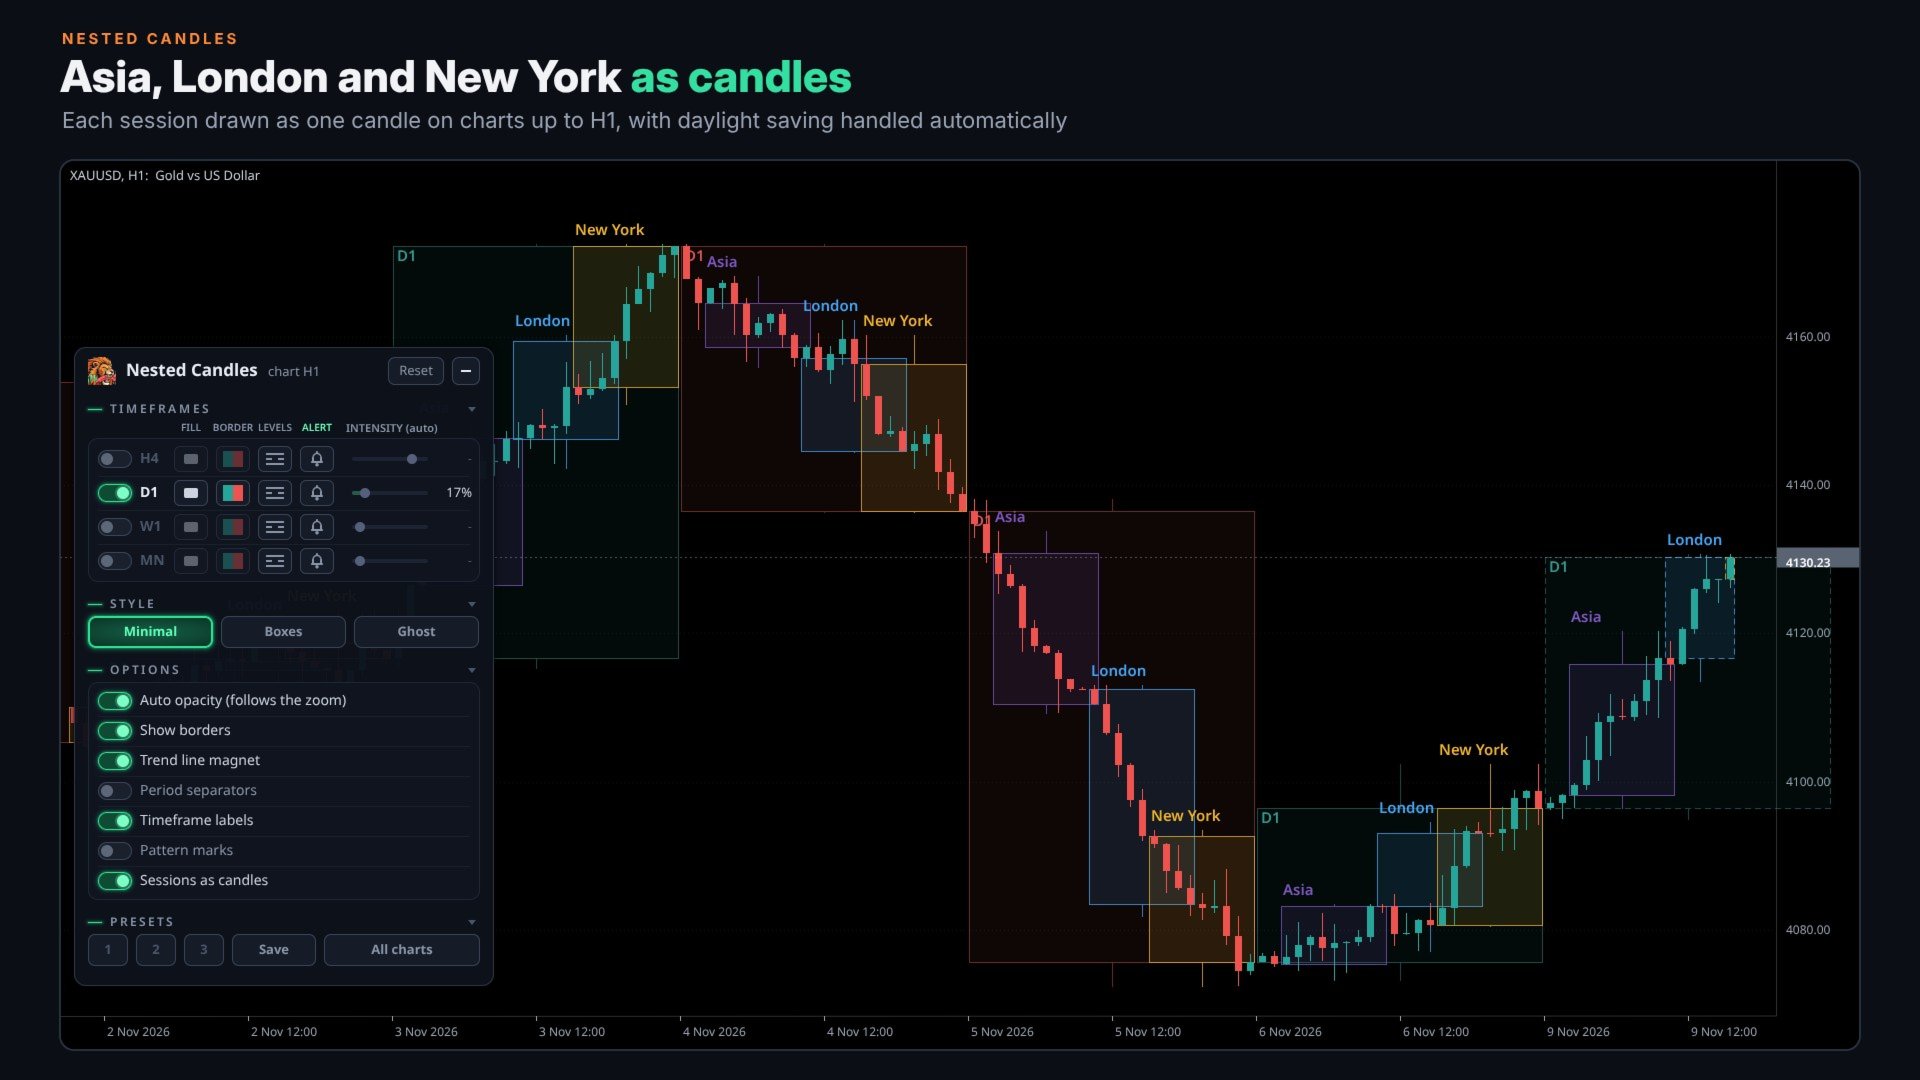
- Sessions as candles: Asia, London and New York on charts up to H1, with the broker time offset and daylight saving detected automatically.
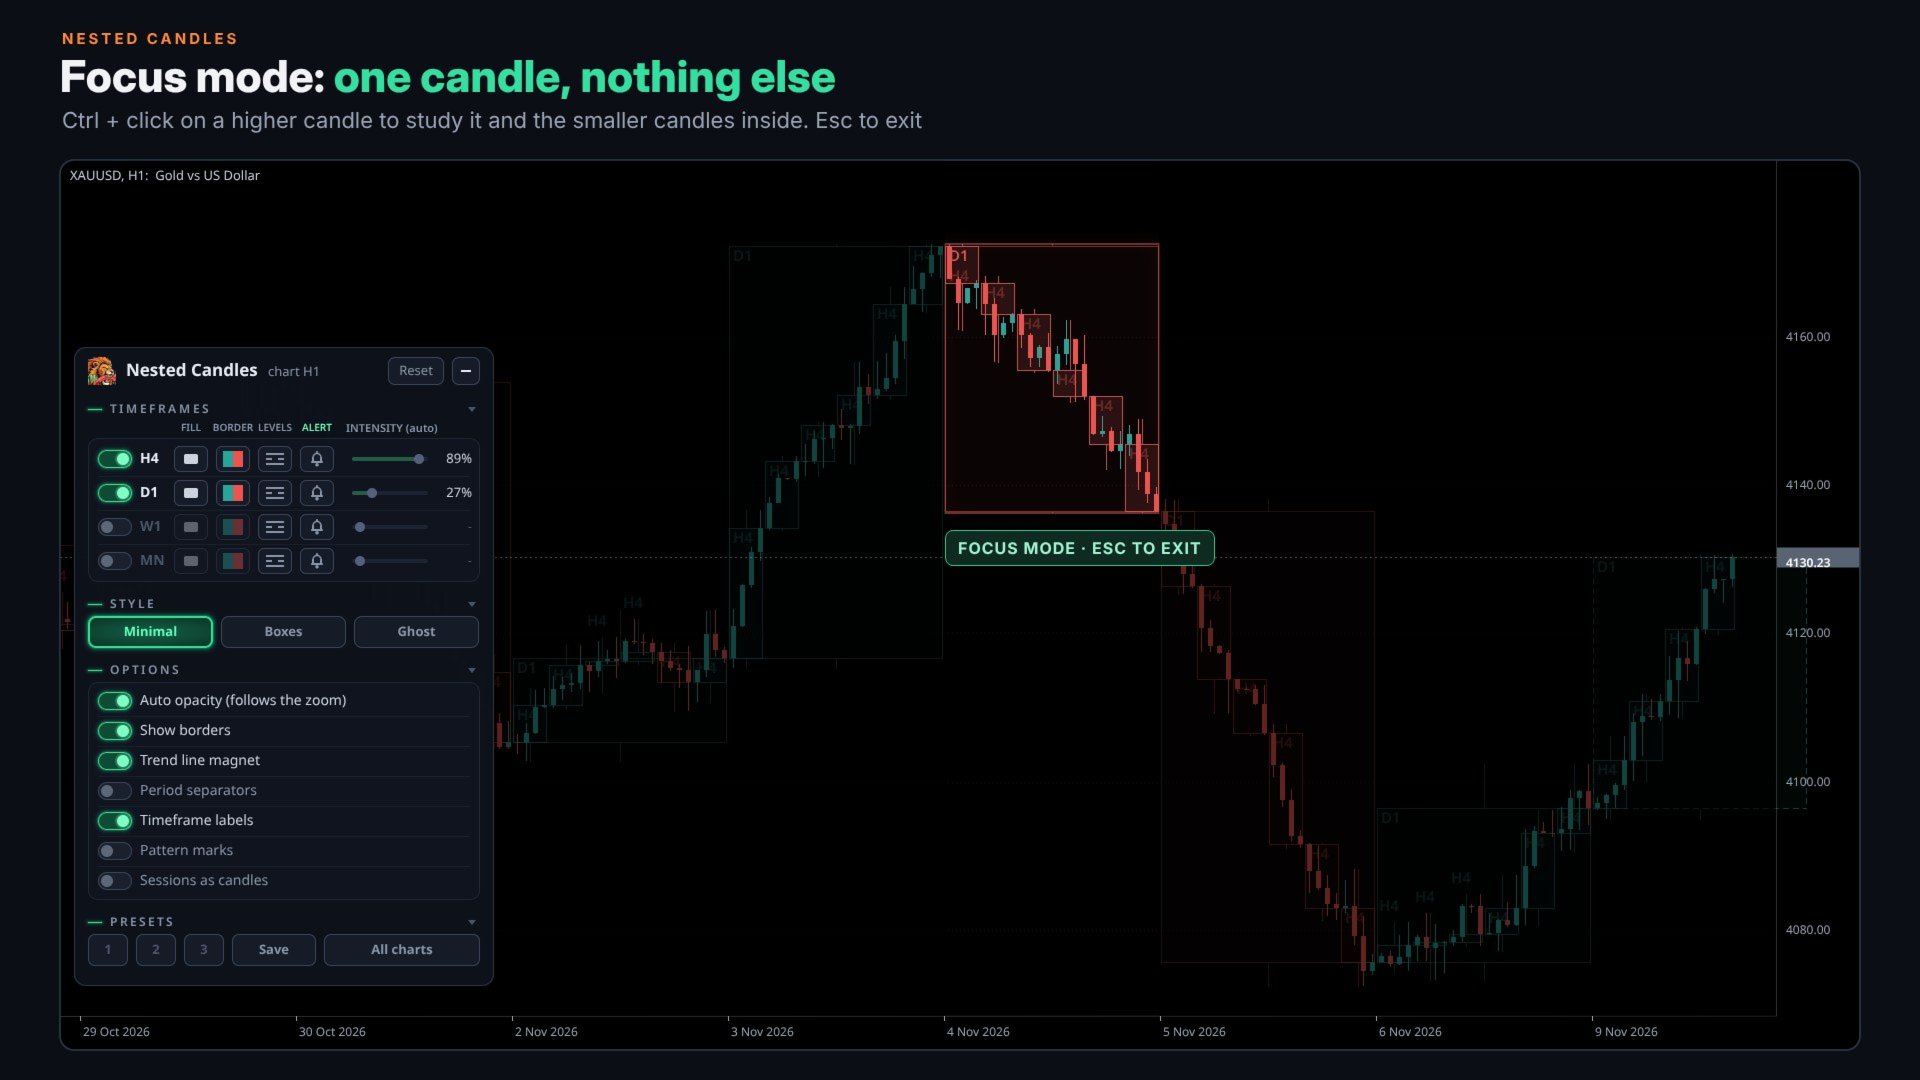
- Focus mode (Ctrl + click on a higher candle), own period separators placed exactly between the candles, and hotkeys (Shift + 1 to 9 for the timeframes, Shift + N to hide them all).
Alerts and languages
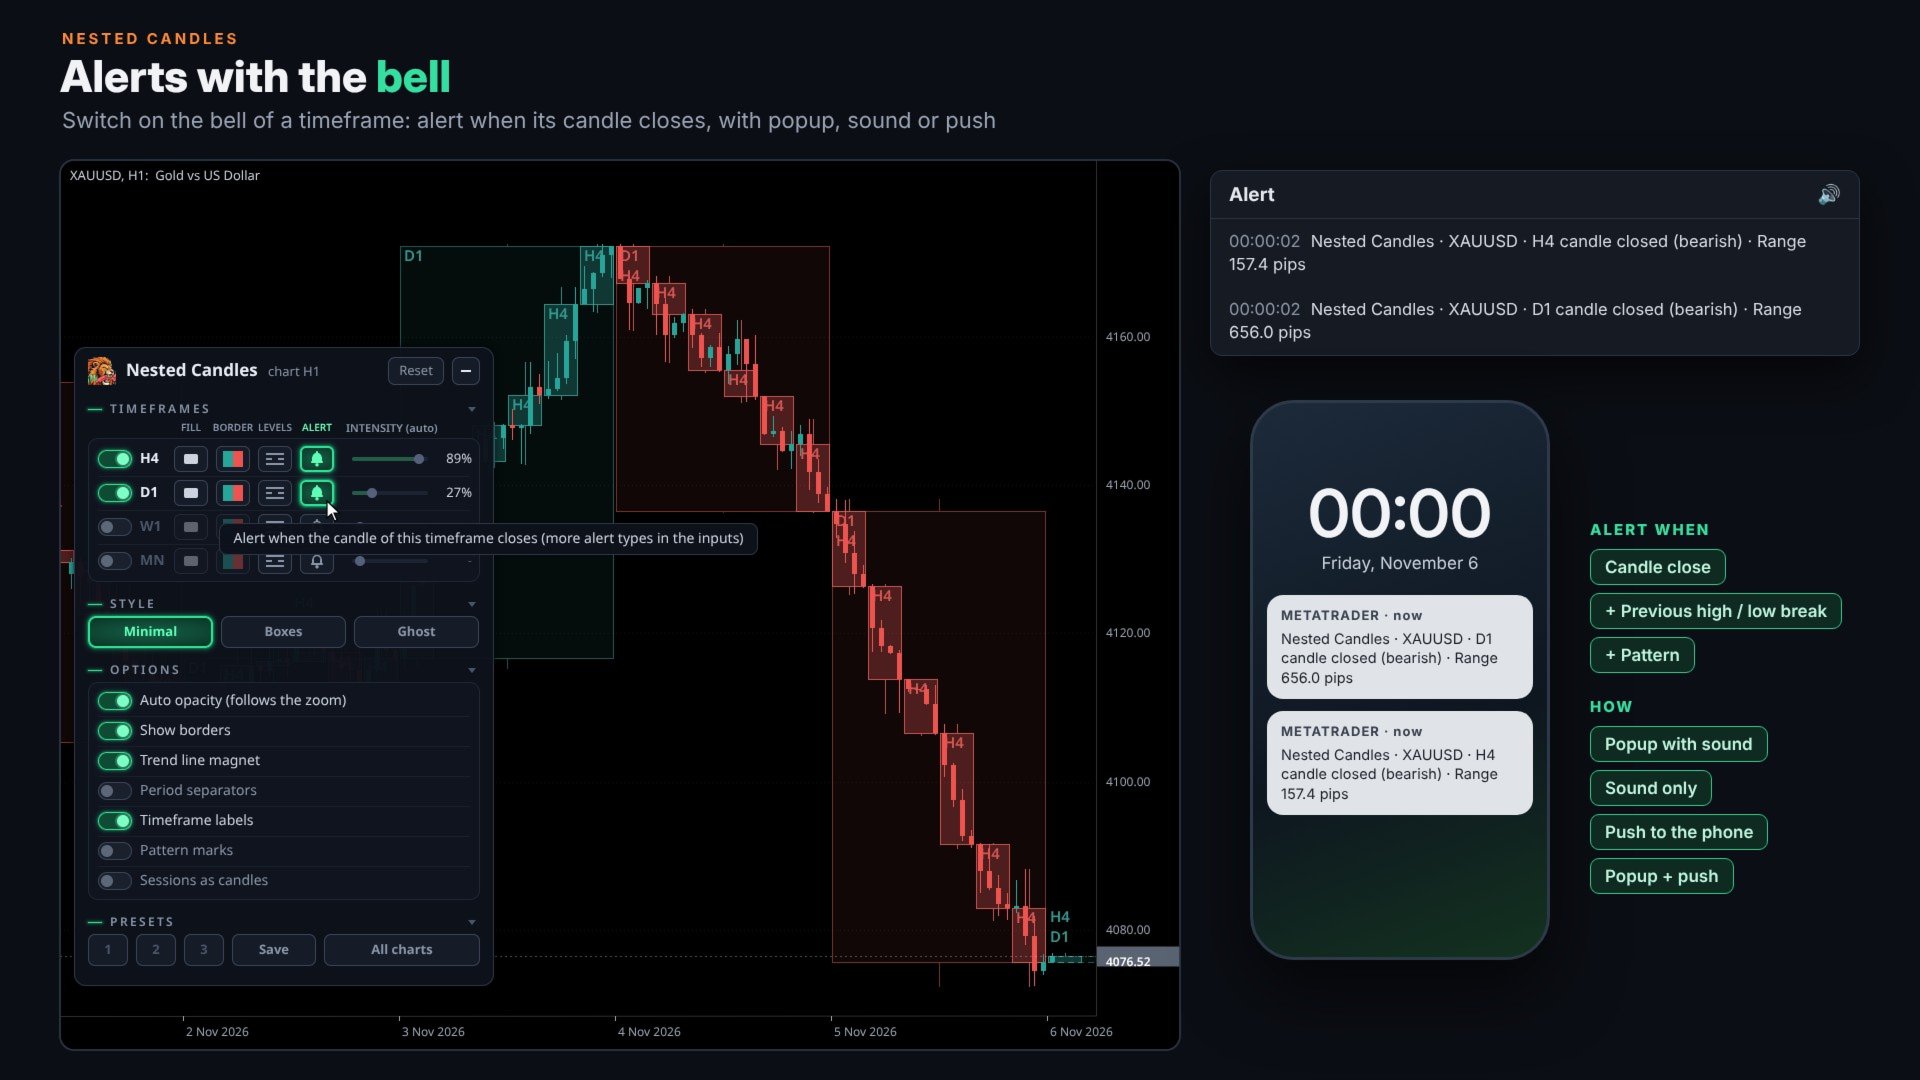
Each timeframe in the panel has a bell button. Switch it on and you get an alert when the candle of that timeframe closes, even if the candles of that row are not drawn. In the inputs you can also add an alert when price breaks the previous high or low, or when the closed candle forms a pattern, and choose how it arrives: popup with sound, sound only, push notification to your phone, or popup and push. All bells are off by default. The panel, tooltips and alerts are available in 11 languages, chosen automatically from your terminal language or selected in the inputs.
Input parameters
There are only a few inputs, because everything else is changed from the panel, which remembers your choices for each symbol:
- 1. Look: candle colors, panel language, panel size and size of the texts on the chart.
- 2. Timeframes: extra timeframes besides the seven of the panel.
- 3. Alerts: when to alert (candle close, break of the previous high or low, pattern) and how (popup with sound, sound only, push to the phone, or popup and push).
- 4. Extras: info card under the mouse and hotkeys.
- Advanced: broker GMT offset for the sessions and pip size. You can leave them as they are.
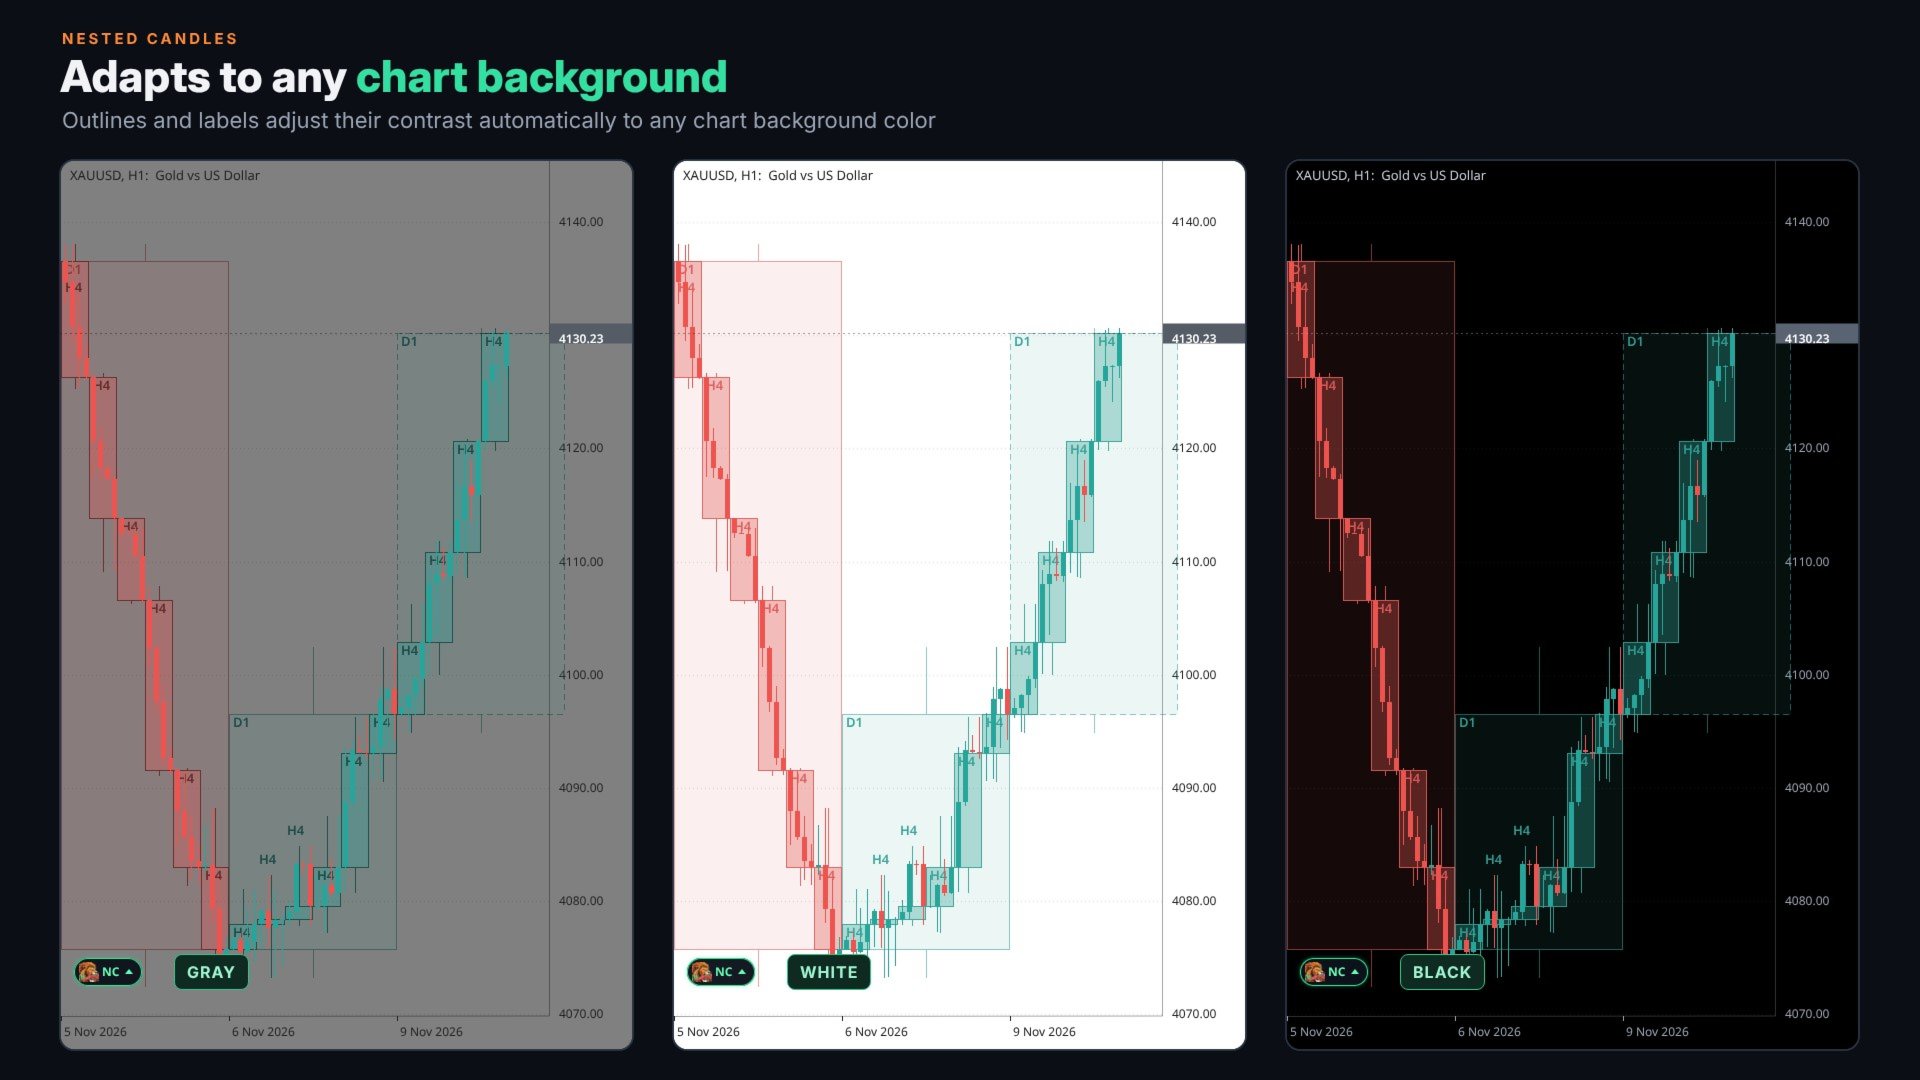
Everything is painted on a single transparent canvas, and only the visible candles are read and redrawn when something on screen changes, so the indicator uses very few resources. Outlines and labels adjust their contrast automatically to any chart background color. When you remove it, your chart colors and period separators come back as they were. For EAs, the OHLC of each higher timeframe is available in buffers through iCustom.
Higher timeframe candles are reference information, not trading signals. The indicator does not open or close trades.