• Overview
  • Reviews (1)
  • Comments
  • What's new

All inOneDemo

Features

It is a demo version of All inOne indicator

It works only on EURUSD, but the full version works on all currency pairs.

All in One indicator is a simple indicator, it makes you know about 8 indicators in all timeframes simultaneously at a single glance.

  • Stochastic
  • RSI
  • Moving Average (MA)
  • Parabolic SAR
  • ADX
  • MACD
  • CCI
  • Last Candle (Candle)

In all timeframes (M1, M5, M15, M30, H1, H4, D1, MN) at the same time.
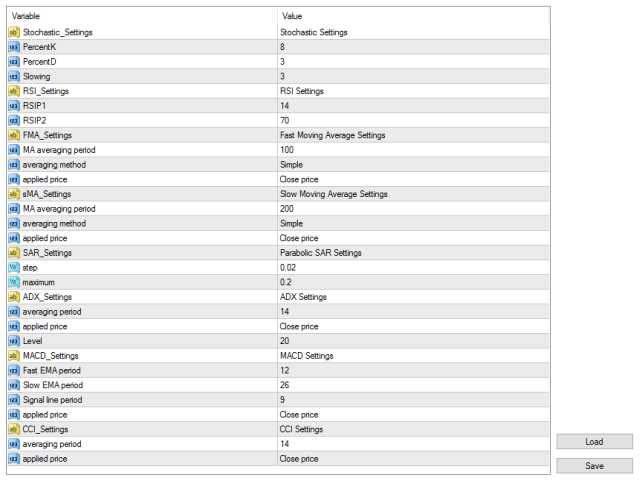

Parameters

Stochastic:

  • PercentK: Period of the %K line.
  • PercentD: Period of the %D line.
  • Slowing: Slowing value.

RSI:

  • RSIP1: Period 1
  • RSIP2: Period 2

Fast Moving Average:

  • MA averaging period: Averaging period for calculation.
  • Averaging method: Moving Average method. It can be any of Simple, Exponential, Smoothed and Linear Weighted.
  • Applied price: Applied price. It can be any of Close price, Open price, High, Low, Median, Typical, Weighted.

Slow Moving Average:

  • MA averaging period: Averaging period for calculation.
  • Averaging method: Moving Average method. It can be any of Simple, Exponential, Smoothed, Linear Weighted.
  • Applied price: Applied price. It can be any of Close price, Open price, High, Low, Median, Typical, Weighted.

Parabolic SAR:

  • Step: price increment step - acceleration factor.
  • Maximum: maximum value of step.

ADX:

  • Averaging period: Averaging period for calculation.
  • Applied price: Applied price. It can be any of Close price, Open price, High, Low, Median, Typical, Weighted.

MACD:

  • Fast EMA period: Fast EMA averaging period.
  • Slow EMA period: Slow EMA averaging period.
  • Signal line period: Signal line averaging period.
  • Applied price: Applied price. It can be any of Close price, Open price, High, Low, Median, Typical, Weighted.

CCI:

  • Averaging period: Averaging period for calculation.
  • Applied price: Applied price. It can be any of Close price, Open price, High, Low, Median, Typical, Weighted.
Recommended products
Extremum Reverse Bar
Yurij Izyumov
2.8 (5)
This indicator has been created for finding the probable reversal points of the symbol price. A small candlestick reversal pattern is used it its operation in conjunction with a filter of extremums. The indicator is not redrawn! If the extremum filter is disabled, the indicator shows all points that have a pattern. If the extremum filter is enabled, the condition works – if the history Previous bars 1 candles back contains higher candles and they are farther than the Previous bars 2 candle, such
FREE
Wise Men Indicator demo
Bohdan Kasyanenko
3 (2)
The indicator displays signals according to the strategy of Bill Williams on the chart. Demo version of the indicator has the same features as the paid, except that it can work only on a demo account . Signal "First Wise Man" is formed when there is a divergent bar with angulation.  Bullish divergent bar - with lower minimum and closing price in the upper half. Bearish divergent bar - higher maximum and the closing price at the bottom half. Angulation is formed when all three lines of Alligat
FREE
Pin Bars
Yury Emeliyanov
5 (3)
Main purpose: "Pin Bars" is designed to automatically detect pin bars on financial market charts. A pin bar is a candle with a characteristic body and a long tail, which can signal a trend reversal or correction. How it works: The indicator analyzes each candle on the chart, determining the size of the body, tail and nose of the candle. When a pin bar corresponding to predefined parameters is detected, the indicator marks it on the chart with an up or down arrow, depending on the direction of
FREE
Trend Catcher with Alert
Issam Kassas
4.69 (49)
The Trend Catcher: The Trend Catcher Strategy with Alert Indicator is a versatile technical analysis tool that aids traders in identifying market trends and potential entry and exit points. It features a dynamic Trend Catcher Strategy , adapting to market conditions for a clear visual representation of trend direction. Traders can customize parameters to align with their preferences and risk tolerance. The indicator assists in trend identification, signals potential reversals, serves as a trail
FREE
Free automatic Fibonacci is an indicator that automatically plots a Fibonacci retracement based on the number of bars you select on the BarsToScan setting in the indicator. The Fibonacci is automatically updated in real time as new highest and lowest values appears amongst the selected bars. You can select which level values to be displayed in the indicator settings. You can also select the color of the levels thus enabling the trader to be able to attach the indicator several times with differe
FREE
MA Dev Chanel
Alexandr Gladkiy
Индикатор показывает максимальное отклонение от скользящей средней за заданный период. Границы канала могут послужить своего рода зонами перекупленности/перепроданности, от которых может произойти откат цены к центру канала. За этими уровнями и стоит искать дополнительные сигналы для входа в сделку.  В настройках индикатора всего 2 параметра -  период, за который будет расчитываться индикатор и метод усреднения скользящей средней.
FREE
Note: this product is a free limited version of the full featured product Currency Timeframe Strength Matrix . It only includes AUD, CAD, CHF currencies instead of all 8 currencies. It includes only 5S, 1M, 5M time frames instead of all 8 (5S, 1M, 5M, 15M, 30M, 1H, 4H, 1D). What is it? The Currency TimeFrame Strength Matrix is a simple and comprehensive Forex map that gives a snapshot of what is happening in the Forex market at the very present time. It illustrates the strength and momentum
FREE
TrendPlus
Sivakumar Subbaiya
4.08 (12)
Trend Plus   Trendplus  Indicator   Time Frame: Suitable for any time frame.  Purpose: Trend Prediction. Blue and red candle indicate the buy and sell call respectively. Buy: When the blue candle is formed buy call is initiated. close the buy trades when the next red candle will formed.   Sell: When the Red candle is formed Sell call is initiated. close the Sell trades when the next blue candle will formed.   Happy trade!!
FREE
Ppr PA
Yury Emeliyanov
4.5 (2)
"Ppr PA" is a unique technical indicator created to identify "PPR" patterns on the currency charts of the MT4 trading platform. These patterns can indicate possible reversals or continuation of the trend, providing traders with valuable signals to enter the market. Features: Automatic PPR Detection: The indicator automatically identifies and marks PPR patterns with arrows on the chart. Visual Signals: Green and red arrows indicate the optimal points for buying and selling, respectively. Arrow
FREE
StrikePin
Mike Pascal Plavonil
1 (1)
The StrikePin indicator is a technical, analytical tool designed to identify trend reversals and find optimal market entries.  The StrikePin indicator is based on the pin bar pattern, which is the Price Action reversal pattern. An entry signal, in a trending market, can offer a very high-probability entry and a good risk to reward scenario. Be careful: the indicator is repainting since it is looking for highest high and lowest lows.  You should avoid to use it in experts but you can use it
FREE
Head and Shoulders Pattern Indicator - Your Key to Recognizing Trend Reversals Unlock the power of pattern recognition with the "Head and Shoulders Pattern Indicator." This cutting-edge tool, designed for MetaTrader, is your trusted ally in identifying one of the most powerful chart patterns in technical analysis. Whether you're a novice or an experienced trader, this indicator simplifies the process of spotting the Head and Shoulders pattern, allowing you to make informed trading decisions. Key
FREE
Show Pips
Roman Podpora
4.3 (54)
This information indicator will be useful for those who always want to be aware of the current situation on the account. The indicator displays data such as profit in points, percentage and currency, as well as the spread for the current pair and the time until the bar closes on the current timeframe. VERSION MT5 - More useful indicators There are several options for placing the information line on the chart: 1. To the right of the price (runs behind the price); 2. As a comment (in the up
FREE
Индикатор, который ищет качественные точки входа в рынок и отображает их в виде стрелок. Действует по сложному алгоритму. Сначала ищет на графике специальные уровни, которые обязательно должны быть пробиты импульсом. Если цена возвращается к этому уровню в виде свечи с длинной тенью и маленьким телом и касается уровня только тенью - возникает точка входа.  Не перерисовывается!  Лучше всего выглядит и отрабатывает на Н1.    Может использоваться как: Индикатор уровней, где цена будет останавлива
FREE
Follow The Line
Oliver Gideon Amofa Appiah
4.07 (14)
FOLLOW THE LINE GET THE FULL VERSION HERE: https://www.mql5.com/en/market/product/36024 This indicator obeys the popular maxim that: "THE TREND IS YOUR FRIEND" It paints a GREEN line for BUY and also paints a RED line for SELL.  It gives alarms and alerts of all kinds. IT DOES NOT REPAINT and can be used for all currency pairs and timeframes. Yes, as easy and simple as that. Even a newbie can use it to make great and reliable trades. NB: For best results, get my other premium indicators for more
FREE
MTF Alligator
Alexander Pekhterev
4.71 (7)
This is an indicator detecting trend direction. It uses the popular Bill Williams Alligator. It shows market state on all timeframes on one chart. As is well known, traders gain the main profit on the Forex market trading by trend, and losses usually occur when the market is flat. So, in order to gain profit a trader should learn to detect trend market and direction of a current trend in a rapid manner. This indicator has been developed for this purpose. MTF Alligator helps to: Profitably trade
FREE
BuySellAlert free
Oleg Borisov
5 (1)
The BuySellAlert free arrow indicator is developed based on the use of HMA, Laguerre, CCI, and ATR. The BuySellAlert free arrow indicator: generates possible entry points  for BUY and SELL ; displays current profit ; displays  current spread. The profitability of the indicator is shown in the screenshot on the example of the GBPUSD pair Does not redraw and works on opening bar. Timeframes - M1-H1. Recommended TimeFrame-M15. The BuySellAlert free  works only with  AUDUSD . Version without restric
FREE
Basic Harmonic Pattern
Mehran Sepah Mansoor
4.56 (50)
This indicator identifies the most popular   Harmonic Patterns   which predict market reversal points.  These harmonic patterns are price formations that are constantly repeating in the forex market and suggest possible future price movements /    Free MT5 Version Dashboard Scanner for this indicator: ( Basic Harmonic Patterns Dashboard ) Comparison of "Basic Harmonic Pattern" vs. "Basic Harmonic Patterns Dashboard" Indicators Feature Basic Harmonic Pattern Basic Harmonic Patterns Dashboard
FREE
Trend arrow Indicator
NGUYEN NGHIEM DUY
3.33 (9)
Trend arrow Indicator is an arrow Indicator used as an assistant tool for your trading strategy. The indicator analyzes the standard deviation of bar close for a given period and generates a buy or sell signals if the deviation increases. It good to combo with Martingale EA to follow Trend and Sellect Buy Only/Sell Only for EA work Semi-Automatic. You can use this  Indicator with any EAs in my Products.
FREE
QualifiedEngulfing
Ashkan Hazegh Nikrou
QualifiedEngulfing Is Free Version Of ProEngulfing Indicator  ProEngulfing Is Paid Version Of This Indicator  Download It Here . What is Different Between free and paid version of ProEngulfing ?  Free version has limitation of One Signal Per Day Join Koala Trading Solution Channel in mql5 community to find out the latest news about all koala products, join link is below : https://www.mql5.com/en/channels/koalatradingsolution Introducing QualifiedEngulfing   – Your Professional Engulf Pattern In
FREE
Pip Show - MultiStrategy Trading   The indicator is for free and you have to install it before you can use the Pip Show - MultiStrategy Trading EA. The use of the indicator is very simple, on green open buy positions and on red open sell positions. Its based on a MA calculation. Check out my fully automatic trading robot  multistrategy-trading.com It has four parameters: Period, Divisor ("speed"), Price and TimeFrame Period - how many candles , backwards, are calculating Divisor - how "quick" is
FREE
Check my paid tools they work great and I share Ea's based on them for free please r ate The Dual Timeframe RSI (Relative Strength Index) indicator is a novel trading tool that allows traders to monitor RSI readings from two different timeframes on a single chart. This dual perspective enables traders to identify potential trend confirmations and divergences more effectively. For instance, a trader might use a 1-hour RSI alongside a daily RSI to ensure that short-term trades align with the bro
FREE
MASi Three Screens
Aleksey Terentev
5 (2)
MASi Three Screens is based on the trading strategy by Dr. Alexander Elder. This indicator is a collection of algorithms. Algorithms are based on the analysis of charts of several timeframes. You can apply any of the provided algorithms. List of versions of algorithms:     ThreeScreens v1.0 - A simple implementation, with analysis of the MACD line;     ThreeScreens v1.1 - A simple implementation, with analysis of the MACD histogram;     ThreeScreens v1.2 - Combines the first two algorithms
FREE
MASi Wave Histogram
Aleksey Terentev
5 (1)
This is an implementation of the market cycle indicator described by Raghee Horner in the book "Forex Trading for Maximum Profit" . The current state of the market can be determined by analyzing the inclination angle of the exponential moving average (EMA) running on a period of 34 bars. If the EMA inclination is defined as the direction of the hour hand on the dial from 12 to 2 hours, then an uptrend is considered to be present; from 2 to 4 hours, the market consolidates; from 4 to 6 hours, a d
FREE
Triple RSI
Pablo Leonardo Spata
1 (1)
LOOK AT THE FOLLOWING STRATEGY WITH THIS INDICATOR. Triple RSI is a tool that uses the classic Relative Strength Indicator, but in several timeframes to find market reversals.    1.  ️ Idea behind the indicator and its strategy: In Trading, be it Forex or any other asset, the ideal is to keep it simple, the simpler the better . The triple RSI strategy is one of the simple strategies that seek market returns. In our experience, where there is more money to always be won, is in the marke
FREE
Indicator ini berdasarkan Gain ADX - Follow Trend - Disertai Pivot, Support & Resistant Daily Dengan indicator ini semoga menjadikan indicator yang porofit able, selama mengikuti signal yang tampil, apabila berwarna Hijau siap2 untuk Buy, dan berwarna Merah siap2 untuk Sell. Akan tampil signal Sell/Buy di saat gain mencukupi, baik TF Kecil maupun TF Besar TF Besar / High TF adalah Trend Kuat TF Kecil / Low TF adalah Trend Lemah Open Posisi pada High TF, signal akan menunjukkan Sell/Buy.
FREE
Full Fractals
Sergey Ermolov
4.85 (13)
MT5 version  |   Owl Smart Levels Indicator  |  Owl Smart Levels Strategy  |  FAQ The Fractals Indicator is one of the elements of the author's trading strategy of  Bill Williams . It is used to search for price reversal points on the price chart and, consequently, support and resistance levels. The Full Fractals Indicator is an improved Fractals which is available in the toolkit of almost all trading terminals. Its only difference is that to build a fractal we use 5 candles to the left and 2
FREE
Necessary for traders: tools and indicators Waves automatically calculate indicators, channel trend trading Perfect trend-wave automatic calculation channel calculation , MT4 Perfect trend-wave automatic calculation channel calculation , MT5 Local Trading copying Easy And Fast Copy , MT4 Easy And Fast Copy , MT5 Local Trading copying For DEMO Easy And Fast Copy , MT4 DEMO Easy And Fast Copy , MT5 DEMO The homeopathic indicator is also called the CCI indicator. The CCI indicator was propos
FREE
Wicks UpDown Target GJ Wicks UpDown Target GJ is specialized in GJ forex pairs. Choppy movement up and down on the opening range every day.  Trading breakouts on London session and New York session is recommended. Guideline Entry Strategy Idea: Step 1 - Breakout Forming (Warning! Trade on London Session and New York Session) Step 2 - Breakout Starting (Take Action on your trading plan) Step 3 - Partial Close your order & set breakeven (no-risk) Step 4 - Target complete Step 5 - Don't tr
FREE
Key Level
Lee Teik Hong
Key Level  Key Level is a MetaTrader 4 Indicator that uses a proprietary algorithm based on Price Retracement/Breakout Method to show the Entry-Line on your trading. Instead, it analyzes data of market and identify entry points and opportunities. (Price Retracement / Price Breakout) It's also a trading tool that be used to practice and enhance your manual trading skills. Key Level is an amazing tool for Scalping Trader. It also a trading tool that be used to practice and enhance your manual t
FREE
This indicator shows the latest untouched support and resistance as horizontal lines. The indicator can show support/resistance from higher timeframes. With this indicator you can e.g. easily see the support/resistance of the timeframes H4, D1 and W1 on a H1 chart, which can be a big advantage while time your entry on H1. This is the FREE version of the indicator: Support Resistance Multi Time Frame The free version works only on EURUSD and GBPUSD! Parameters referenceTF: the timeframe from wh
FREE
Buyers of this product also purchase
Gann Made Easy
Oleg Rodin
4.85 (82)
Gann Made Easy is a professional and easy to use Forex trading system which is based on the best principles of trading using the theory of mr. W.D. Gann. The indicator provides accurate BUY and SELL signals including Stop Loss and Take Profit Levels. You can trade even on the go using PUSH notifications. PLEASE CONTACT ME AFTER PURCHASE TO GET MY TRADING TIPS PLUS A GREAT BONUS! Probably you heard already many times about Gann trading methods. Usually Gann's theory is very complex thing not only
TPSpro RFI Levels
Roman Podpora
4.82 (22)
Reversal First Impulse levels (RFI)    INSTRUCTIONS        RUS       -       ENG              R ecommended to use with an indicator   -   TPSpro  TREND PRO -  Version MT5 A key element in trading is zones or levels from which decisions to buy or sell a trading instrument are made. Despite attempts by major players to conceal their presence in the market, they inevitably leave traces. Our task was to learn how to identify these traces and interpret them correctly. Main functions: Displaying activ
Gold Stuff
Vasiliy Strukov
4.89 (238)
Gold Stuff is a trend indicator designed specifically for gold and can also be used on any financial instrument. The indicator does not redraw and does not lag. Recommended time frame H1. At it indicator work full auto  Expert Advisor EA Gold Stuff. You can find it at my profile. Contact me immediately after the purchase to get   personal bonus!  You can get a free copy of our Strong Support and Trend Scanner indicator, please pm. me! Settings  and manual here   SETTINGS Draw Arrow - on off. dra
Atomic Analyst
Issam Kassas
5 (2)
First of all Its worth emphasizing here that this Trading Indicator is   Non-Repainting , Non Redrawing and Non Lagging Indicator   Indicator, Which makes it ideal from both manual and robot trading.  User manual: settings, inputs and strategy . The Atomic Analyst  is a PA Price Action Indicator that uses Strength and Momentum of the price to find a better edge in the market. Equipped with Advanced filters which help remove noises and false signals, and Increase Trading Potential. Using Multipl
Trend Punch
Mohamed Hassan
4.95 (19)
This indicator is unstoppable when combined with our other indicator called  Support & Resistance . After purchase, send us a message and you will get it   for  FREE as a BONUS! Introducing Trend Punch , the revolutionary forex trend indicator that will transform the way you trade! Trend Punch is uniquely designed to provide precise buy and sell arrows during strong market trends, making your trading decisions clearer and more confident. Whether you're trading major currency pairs or exotic sym
TPSproTREND PrO
Roman Podpora
4.79 (19)
TPSpro TRENDPRO  - is a trend indicator that automatically analyzes the market and provides information about the trend and each of its changes, as well as giving signals for entering trades without redrawing! The indicator uses each candle, analyzing them separately. referring to different impulses - up or down impulse. Exact entry points into transactions for currencies, crypto, metals, stocks, indices!  Version MT5             DETAILED DESCRIPTION              R ecommended to use with an indi
Trend Screener
STE S.S.COMPANY
4.8 (87)
Unlock the Power of Trends Trading with the Trend Screener Indicator: Your Ultimate Trend Trading Solution powered by Fuzzy Logic and Multi-Currencies System! Elevate your trading game with the Trend Screener, the revolutionary trend indicator designed to transform your Metatrader into a powerful Trend Analyzer. This comprehensive tool leverages fuzzy logic and integrates over 13 premium features and three trading strategies, offering unmatched precision and versatility. LIMITED TIME OFFER : Sup
FX Power MT4 NG
Daniel Stein
5 (12)
Trading GOLD, and currencies, with the dog walk strategy  - super smart Trading GOLD, and currencies, with the breakout strategy  - super easy Visit our all-new   Stein Investments Welcome Page   to get the latest information, updates and trading strategies. FX Power MT4 NG  is the next generation of our long-time very popular currency strength meter, FX Power.  And what does this next-generation strength meter offer? Everything you have loved about the original FX Power  PLUS GOLD/XAU stre
FX Volume
Daniel Stein
4.58 (33)
Visit our all-new   Stein Investments Welcome Page   to get the latest information, updates and trading strategies. FX Volume is the FIRST and ONLY volume indicator that provides a REAL insight into the market sentiment from a broker's point of view. It provides awesome insights into how institutional market participants, like brokers, are positioned in the Forex market, much faster than COT reports. Seeing this information directly on your chart is the real game-changer and breakthrough solut
Scalper Inside PRO
Alexey Minkov
4.73 (56)
An exclusive indicator that utilizes an innovative algorithm to swiftly and accurately determine the market trend. The indicator automatically calculates opening, closing, and profit levels, providing detailed trading statistics. With these features, you can choose the most appropriate trading instrument for the current market conditions. Additionally, you can easily integrate your own arrow indicators into Scalper Inside Pro to quickly evaluate their statistics and profitability. Scalper Inside
- Real price is 80$ - 40% Discount ( It is 49$ now ) Contact me for instruction, add group and any questions! Related EA Product: Bitcoin Expert Introduction The breakout and retest strategy is traded support and resistance levels. it involves price breaking through a previous level.  The break and retest strategy is designed to help traders do two main things, the first is to avoid false breakouts. Many false breakouts start with a candlestick that breaks out of a level but ends with an immedi
Enigmera
Ivan Stefanov
5 (3)
ENIGMERA: The core of the market (If the demo of mql5.com doesn't working and you want to try Enigmera please message me.) Introduction This indicator and trading system is a remarkable approach to the financial markets . ENIGMERA uses the fractal cycles to accurately calculate support and resistance levels. It shows the authentic accumulation phase and gives direction and targets.  A system that works whether we are in a trend or a correction.   How does it operate? ENIGMERA comprises of fol
The Chart Patterns All-in-One indicator helps traders visualize various chart patterns commonly used in technical analysis. It supports identifying potential market behaviors, but profitability is not guaranteed. Testing in demo mode is recommended before purchasing. Current Offer : 50% discount on the "Chart Patterns All in One" indicator. Included Patterns : Pattern 1-2-3 : Detects market reversals using three key points (highs or lows). Buy : Two consecutive lows followed by a lower high. Se
MetaBands M4
Vahidreza Heidar Gholami
5 (2)
MetaBands uses powerful and unique algorithms to draw channels and detect trends so that it can provide traders with potential points for entering and exiting trades. It’s a channel indicator plus a powerful trend indicator. It includes different types of channels which can be merged to create new channels simply by using the input parameters. MetaBands uses all types of alerts to notify users about market events. Features Supports most of the channel algorithms Powerful trend detection algorith
Market Reversal Alerts
LEE SAMSON
4.19 (113)
Profit from market structure changes as price reverses and pulls back. The market structure reversal alert indicator identifies when a trend or price move is approaching exhaustion and ready to reverse. It alerts you to changes in market structure which typically occur when a reversal or major pullback are about to happen. The indicator identifies breakouts and price momentum initially, every time a new high or low is formed near a possible exhaustion point. The indicator draws in a rectangle on
Currently 20% OFF ! Best Solution for any Newbie or Expert Trader! This dashboard software is working on 28 currency pairs plus one. It is based on 2 of our main indicators (Advanced Currency Strength 28 and Advanced Currency Impulse). It gives a great overview of the entire Forex market plus Gold or 1 indices. It shows Advanced Currency Strength values, currency speed of movement and signals for 28 Forex pairs in all (9) timeframes. Imagine how your trading will improve when you can watch the e
Bomb Bank Signal
Igor Pereira Calil
5 (1)
Bomb Bank Signal: Your Trusted Indicator for MetaTrader 4 The Bomb Bank Signal is a powerful indicator for MetaTrader 4, designed to identify the most relevant trends in the financial market. If you are looking for a tool that accurately anticipates movements, Bomb Bank is the ally you need. How it Works: This indicator combines three distinct methods – volume analysis, candle closes and symmetrical trend – to detect and signal buying and selling opportunities. Bomb Bank is like a "bomb"
Trend Cutter
Oleg Rodin
5 (2)
Trend Cutter   is a trend indicator which can be used with any time frame including the lower time frames like M1 and M5. The indicator is ideal for traders who prefer intraday trading and will be helpful to those who prefer long-term trading as well. You can use this indicator as a basis for your trading system or as a standalone trading solution. The indicator provides non-repaint signals on the close of the current candle. When the signal candle is closed, the signal will stay fixed on chart.
Currency Strength Wizard is a very powerful indicator that provides you with all-in-one solution for successful trading. The indicator calculates the power of this or that forex pair using the data of all currencies on multiple time frames. This data is represented in a form of easy to use currency index and currency power lines which you can use to see the power of this or that currency. All you need is attach the indicator to the chart you want to trade and the indicator will show you real str
TakePropips Donchian Trend Pro
Eric John Pajarillaga Aldana
4.44 (16)
TakePropips Donchian Trend Pro  (MT4) is a powerful and effective tool that automatically detects the direction of the trend using the Donchian Channel and provides you with an entry and exit trading signals! This multi-function indicator includes a trend scanner, trading signals, statistical panel, screener, trading sessions, and alerts history dashboard. It is designed to provide you with trading signals and save you hours analyzing the charts! You can download the user manual and installation
Supply and Demand Dashboard PRO
Bernhard Schweigert
4.8 (20)
Currently 20% OFF ! This dashboard is a very powerful piece of software working on multiple symbols and up to 9 timeframes. It is based on our main indicator (Best reviews:   Advanced Supply Demand ). The dashboard gives a great overview. It shows: Filtered Supply and Demand values including zone strength rating, Pips distances to/and within zones, It highlights nested zones, It gives 4 kind of alerts for the chosen symbols in all (9) time-frames. It is highly configurable for your personal
CURRENTLY 26% OFF Best Solution for any Newbie or Expert Trader! This Indicator is a unique, high quality and affordable trading tool because we have incorporated a number of proprietary features and a new formula. With only ONE chart you can read Currency Strength for 28 Forex pairs! Imagine how your trading will improve because you are able to pinpoint the exact trigger point of a new trend or scalping opportunity? User manual: click here That's the first one, the original! Don't buy a worthle
CURRENTLY 31% OFF !! Best Solution for any Newbie or Expert Trader! This indicator is a unique, high quality and affordable trading tool because we have incorporated a number of proprietary features and a secret formula. With only ONE chart it gives Alerts for all 28 currency pairs. Imagine how your trading will improve because you are able to pinpoint the exact trigger point of a new trend or scalping opportunity! Built on new underlying algorithms it makes it even easier to identify and confir
IX Power MT4
Daniel Stein
5 (5)
IX Power finally brings the unbeatable precision of FX Power to all your trading symbols. It accurately determines the intensity of short, medium and long-term trends in your favourite indices, stocks, commodities, ETFs, and even cryptocurrencies. You can analyse everything your terminal has to offer. Try it out and experience how your timing improves significantly when trading. Read about our latest strategic development -  Easy scalping with IX Power Visit our all-new   Stein Investments
Stratos Pali Indicator   is a revolutionary tool designed to enhance your trading strategy by accurately identifying market trends. This sophisticated indicator uses a unique algorithm to generate a complete histogram, which records when the trend is Long or Short. When a trend reversal occurs, an arrow appears, indicating the new direction of the trend. Important Information Revealed Leave a review and contact me via mql5 message to receive My Top 5 set files for Stratos Pali at no cost! D
Automatically draw support and resistance levels PLUS propulsion candle gaps on your chart, so you can see where price is likely to head next and/or potentially reverse. This indicator is designed to be used as part of the position trading methodology taught on my website (The Market Structure Trader) and displays key information for targeting and potential entries. MT version available here:  https://www.mql5.com/en/market/product/97973 There are 2 CORE features in the indicator and 4 additiona
This dashboard is an alert tool for use with the market structure reversal indicator. It's primary purpose is to alert you to reversal opportunities on specific time frames and also to the re-tests of the alerts (confirmation) as the indicator does. The dashboard is designed to sit on a chart on it's own and work in the background to send you alerts on your chosen pairs and timeframes. It was developed after many people requested a dash to monitor multiple pairs and time frames at once rather th
Gold Channel is a volatility-based indicator, developed with a specific timing algorithm for the XAUUSD pair, which consists of finding possible corrections in the market. This indicator shows two outer lines, an inner line (retracement line) and an arrow sign, where the theory of the channel is to help identify overbought and oversold conditions in the market. The market price will generally fall between the boundaries of the channel. If prices touch or move outside the channel it is a tra
PRO Renko System
Oleg Rodin
5 (25)
PRO Renko System is a highly accurate trading system specially designed for trading RENKO charts. The ARROWS and Trend Indicators DO NOT REPAINT! The system effectively neutralizes so called market noise giving you access to accurate reversal signals. The indicator is very easy to use and has only one parameter responsible for signal generation. You can easily adapt the tool to any trading instrument of your choice and the size of the renko bar. I am always ready to provide extra support to help
First of all Its worth emphasizing here that this Trading Tool is Non-Repainting Non-Redrawing and Non-Lagging Indicator Which makes it ideal for professional trading . Online course, user manual and demo. The Smart Price Action Concepts Indicator is a very powerful tool for both new and experienced traders . It packs more than 20 useful indicators into one combining advanced trading ideas like Inner Circle Trader Analysis and Smart Money Concepts Trading Strategies . This indicator focuses on
More from author
It is the same of Advanced Arrow indicator but shows the signal of 8 currencies pairs at the same time on 5 Timeframes without any TPs line or SL. Features You will know when exactly you should enter the market. This indicator does not repaint it's signals. Signal Types and Timeframes Used You can use this indicator on any timeframes but i recommend you to use it on H1, H4 frames. The indicator gives you four signals (Ready to Buy "RBuy", Ready to Sell "RSell", Buy, Sell). When RBuy appear y
FiboRecDemo
Alfred Kamal
4 (1)
This indicator is Demo version of FiboRec and works only on EURUSD This indicator depends on Fibonacci lines but there are secret lines I used. By using FiboRec indicator you will be able to know a lot of important information in the market such as: Features You can avoid entry during market turbulence. You can enter orders in general trend only. You will know if the trend is strong or weak. Signal Types and Frame used You can use this indicator just on H1 frame. Enter buy order in case Cand
FREE
It is a demo version of Advanced Arrow indicator It works only on GBPJPY but the full version works on all currency pairs. Features Simply it gives you entry point ,SL line and 4 TP lines or less. Once SL-TP lines are shown with the arrow, they remains as they are until signal change. It is historical indicator. No Repaint. Indicator parameters Indicator Version : choose V5 or V6. TP 1 Line color : TP1 color. TP 2 Line color : TP2 color. TP 3 Line color : TP3 color. TP 4 Line color : TP4 co
FREE
This is Demo version of PipsFactoryWeekly This indicator depends on High and Low price of Currency in last Week and then i made some secret equations to draw 10 lines. Features: You will know what exactly price you should enter the market . You will know when to be out of market. You will know you what should you do in market: Buy Sell Take profit and there are 3 levels to take your profit Support Resistance Risk to buy Risk to Sell Signal Types and Frame used: You can use this indicator jus
FREE
PipsFactoryDailyDemo
Alfred Kamal
4.5 (2)
This is Demo Version of PipsFactoryDaily This indicator depends on High and Low price of currency in the last day, and then I made some secret equations to draw 10 lines. Features You will know what exactly price you should enter the market. You will know when to be out of market. You will know what you should do in market: Buy Sell Take profit, and there are three levels to take your profit Support Resistance Risk to buy Risk to sell Signal Types and Timeframes Used You can use this indicat
FREE
This is Demo Version of PipsFactoryMonthly This indicator depends on High and Low price of Currency in last Month and then i made some secret equations to draw 10 lines. Features You will know what exactly price you should enter the market. You will know when to be out of market. You will know you what should you do in market: Buy Sell Take profit and there are 3 levels to take your profit Support Resistance Risk to buy Risk to Sell Signal Types and Timeframe Used You can use this indicator
FREE
This is a Demo version of PipsFactoryInd it is works only NZD/USD but full version is works on all currency pair. This indicator is a collection of three indicators, it is 3 in 1: PipsFactoryDaily Click Here PipsFactoryWeekly Click Here PipsFactoryMonthly Click Here This indicator depends on High and Low price of currency in the (Last day / Last week / Last Month) depends on user input, and then I made some secret equations to draw 10 lines. Features: You will know what exactly price you s
FREE
FiboRec
Alfred Kamal
This indicator depends on Fibonacci lines but there is a secret lines i used them, by using FiboRec indicator you will be able to know a lot of important information in the market such as: Features You can avoid entry during market turbulence. You can enter orders in general trend only. You will know if the trend is strong or weak. Signal Types and Frame used You can use this indicator just on H1 frame. Enter buy order in case Candle break out the square area and closed over it, at least 20
This indicator depends on High and Low price of Currency in last Week and then i made some secret equations to draw 10 lines. Features: You will know what exactly price you should enter the market . You will know when to be out of market. You will know you what should you do in market: Buy Sell Take profit and there are 3 levels to take your profit Support Resistance Risk to buy Risk to Sell Signal Types and Frame used: You can use this indicator just on H4 frame and you have to download the
This indicator depends on High and Low price of Currency in last Month and then i made some secret equations to draw 10 lines. Features You will know what exactly price you should enter the market . You will know when to be out of market. You will know you what should you do in market: Buy Sell Take profit and there are 3 levels to take your profit Support Resistance Risk to buy Risk to Sell Signal Types and Timeframe Used You can use this indicator just on H4 timeframe and you have to downl
PipsFactoryDaily
Alfred Kamal
5 (1)
This indicator depends on High and Low price of currency in the last day, and then I made some secret equations to draw 10 lines. Features You will know what exactly price you should enter the market. You will know when to be out of market. You will know what you should do in market: Buy Sell Take profit, and there are three levels to take your profit Support Resistance Risk to buy Risk to sell Signal Types and Timeframes Used You can use this indicator just on (M1, M5, M15, M30, H1) timefra
Description: This indicator is a collection of three indicators , it is 3 in 1: PipsFactoryDaily Click Here PipsFactoryWeekly Click Here PipsFactoryMonthly Click Here If you are interesting in all of them, you can save money - this collection indicator is cheaper. This indicator depends on High and Low price of currency in the (Last day / Last week / Last Month) depends on user input, and then I made some secret equations to draw 10 lines. Features: You will know what exactly price you sho
Advanced Arrow
Alfred Kamal
3.9 (39)
This indicator depends on some secrets equations to draw Signals with Stop loss and maximum 4 Take profits. There is a free EA depends on this indicator as a gift when you purchase/rent it. Features Simply it gives you entry point as Ready sign (Buy / Sell) and arrow (Buy / Sell) after candle closed, also SL line and 4 TP lines or less. Once SL-TP lines are shown with the arrow, they remains as they are until signal change. It is historical indicator. No Repaint. user manual for V5 please cli
All inOne
Alfred Kamal
Features All in One indicator is a simple indicator. It makes you know about eight indicators in all timeframes at just one view in the same time. Stochastic RSI Moving Average (MA) Parabolic SAR ADX MACD CCI Last Candle (Candle) in all timeframes (M1, M5, M15, M30, H1, H4, D1, MN) in the same time. Parameters Stochastic PercentK : period of the %K line. PercentD : period of the %D line. Slowing : slowing value. RSI RSIP1 : period 1 RSIP2 : period 2 Fast Moving Average MA averaging period: ave
All Pivot Points
Alfred Kamal
5 (1)
Pivot Points is used by traders to objectively determine potential support and resistance levels. Pivots can be extremely useful in Forex since many currency pairs usually fluctuate between these levels. Most of the time, price ranges between R1 and S1. Pivot points can be used by range, breakout, and trend traders. Range-bound Forex traders will enter a buy order near identified levels of support and a sell order when the pair nears resistance. But there are more one method to determine Pivot p
This indicator draws the Fibonacci -38.2, -17, 38.2, 61.8, 117, 138 levels for the last closed H1, H4, Daily, Weekly and Monthly candle. Features Automatic display of the most important Fibonacci levels. Parameters TimeFrame: Choose which timeframe you want Fibonacci levels to be based on. SetLabels: Visible/invisible Fibonacci level labels. Labels Position : Position of Fibonacci level labels (Right - Left - Middle). FontSize: Font size of Fibonacci level labels. c38: Color of level 3
This indicator show you the begin of the Trend by drawing (Up/Down) arrow. It works using compatibility of current fame and the next 3 frames to make it more professional and more profitable. Features:- Simply it gives you entry point as arrow (Buy / Sell) after candle closed. You can use it on time frames ( M1 , M5 , M15 , M30 ) are more profitable. You can use it on any currencies pair. It is historical indicator. No Repaint. No additional indicator needed. Easy to use. Indicator parameters:
Filter:
Jianyou Wu
30
Jianyou Wu 2017.12.23 13:00 
 

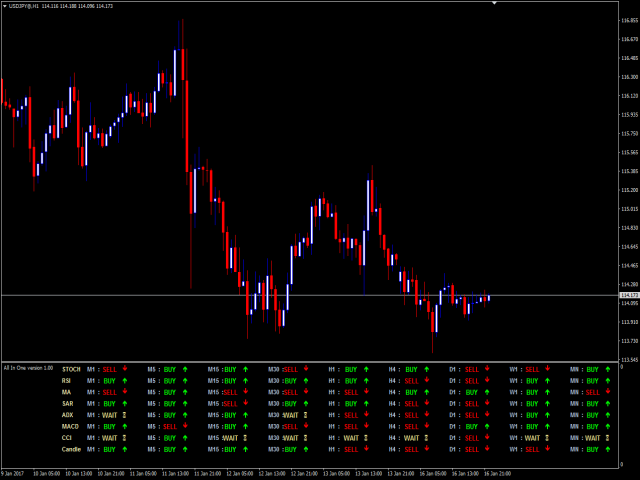
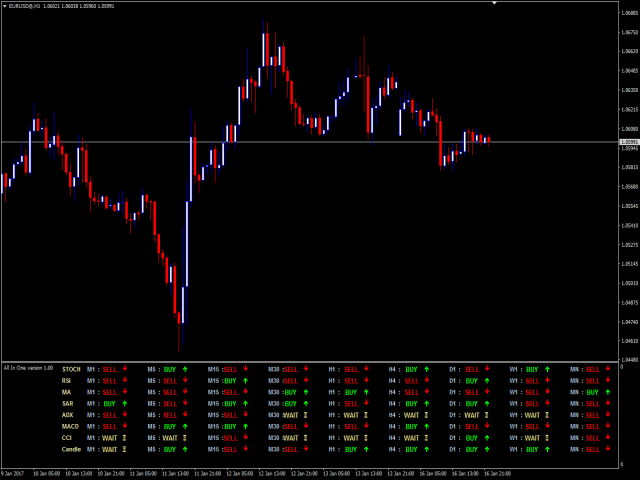
There is a mistake in the candle's signal, please correct it

Reply to review
Version 2.0 2021.12.03
recompile in the latest platform build