SMA Riels
- Indicators
-
Andres Eduardo Rodriguez Fortunato
 I am a software developer and independent quantitative trading researcher with a passion for understanding how markets behave beyond traditional indicators.
 - Version: 1.0
- Activations: 10
Overview
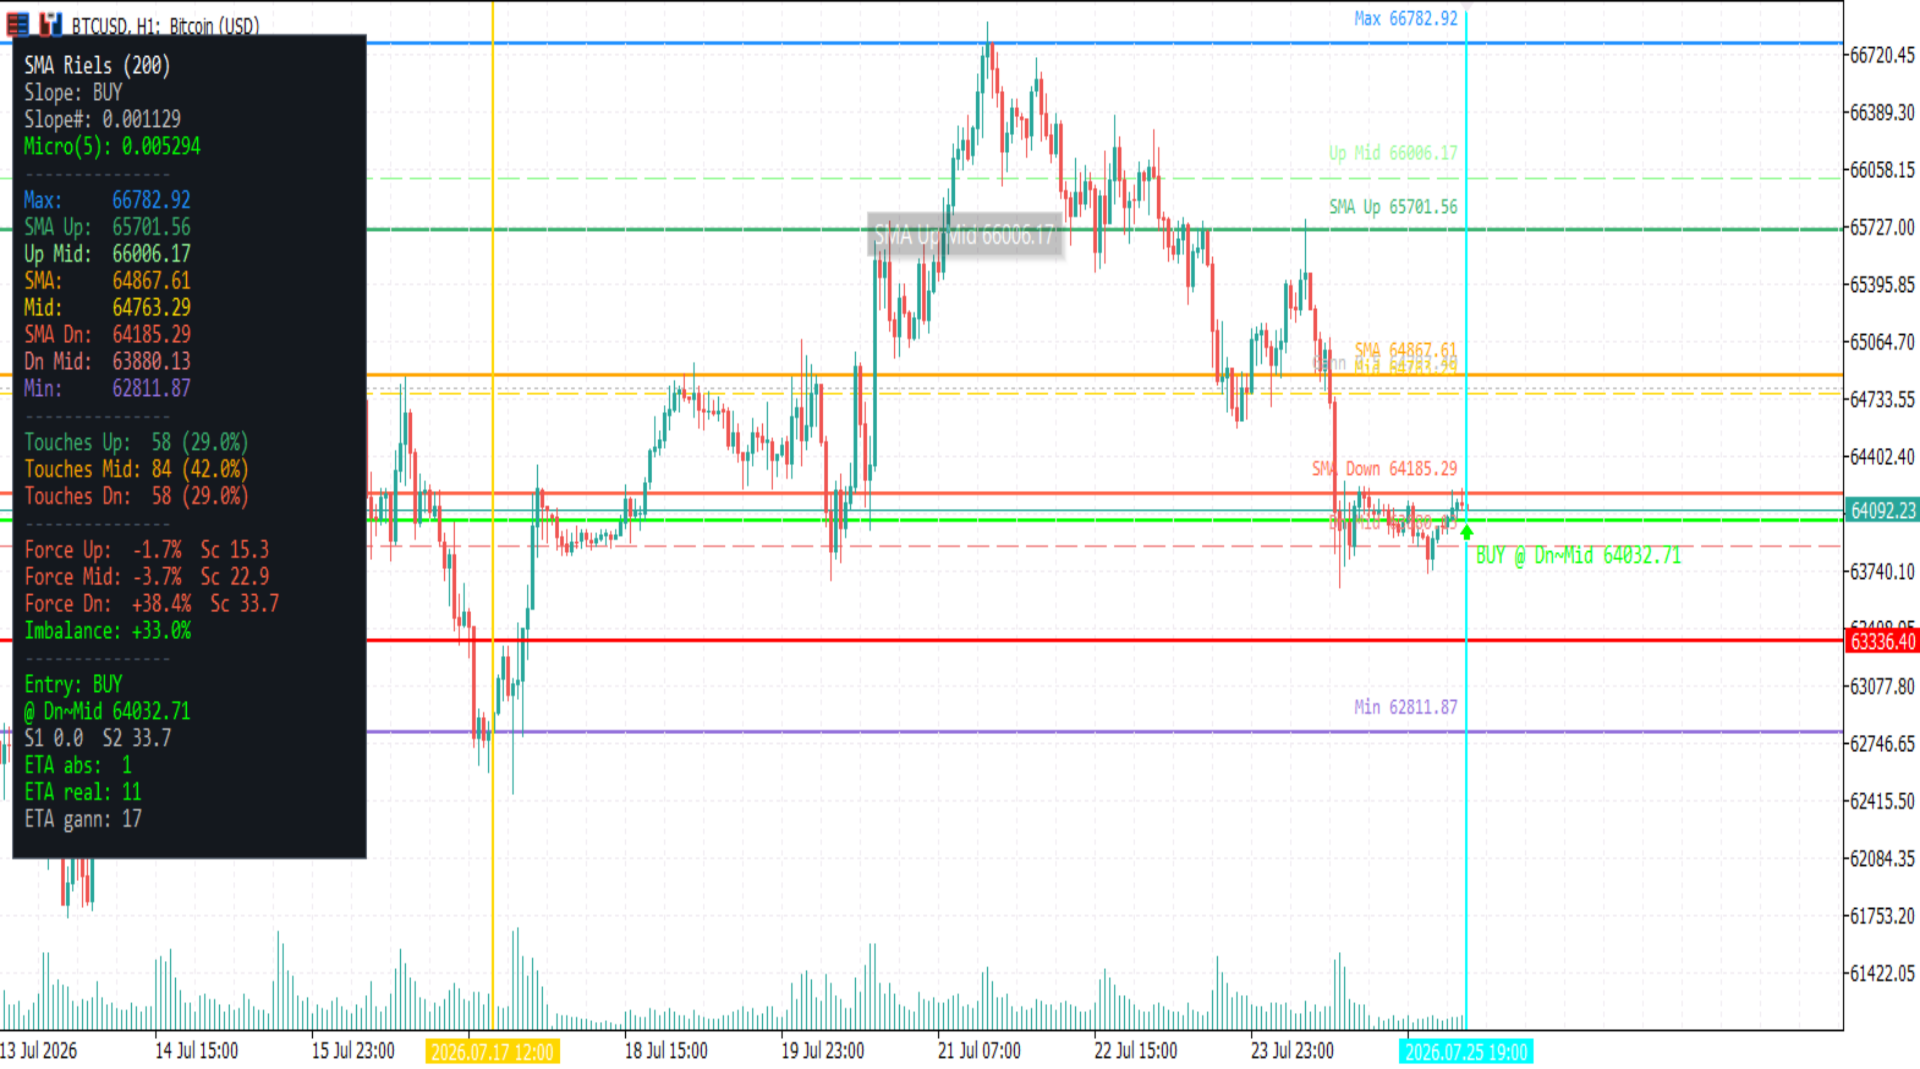
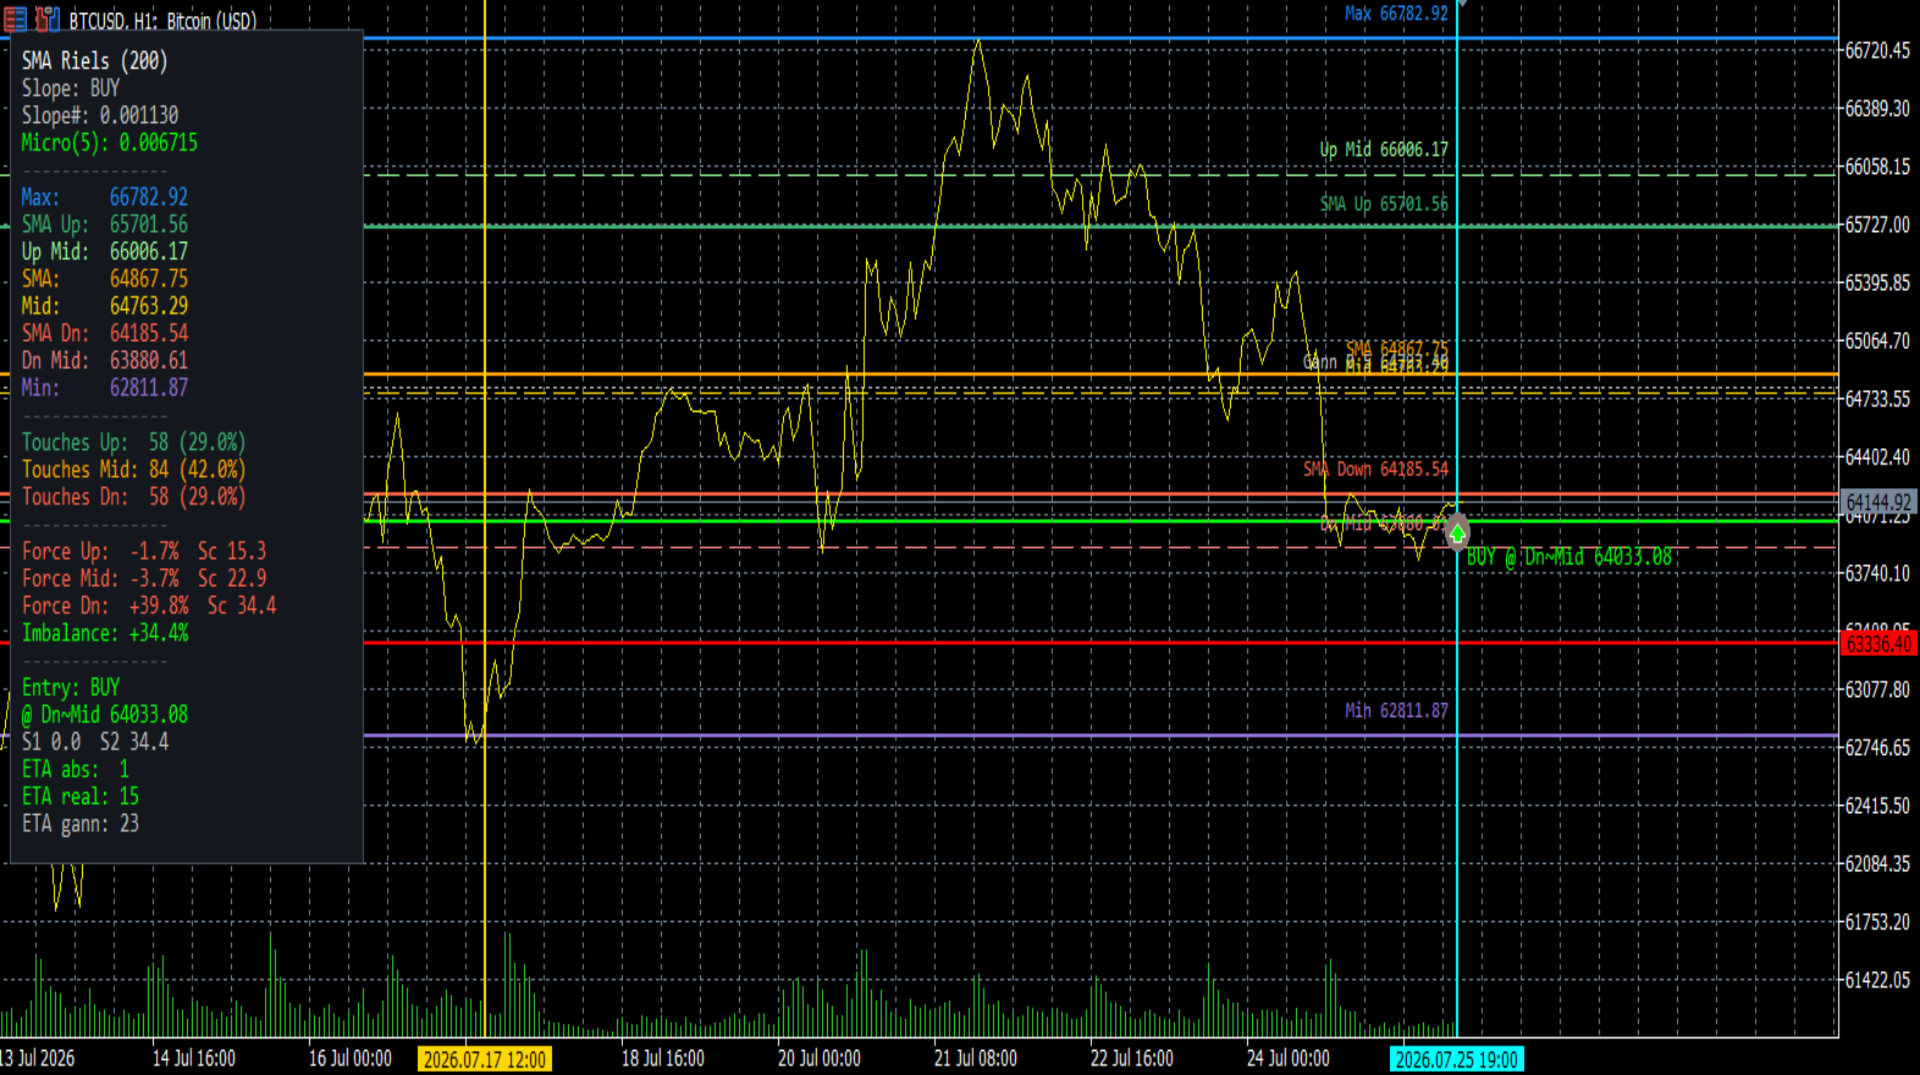
SMARiels is a MetaTrader 5 chart indicator for structural price analysis. The user selects a price range with two vertical lines. Inside that range, the indicator calculates horizontal price levels, directional slope, zone force, zone touches, imbalance, and the strongest BUY and SELL rails by signed zone score.
The indicator is an analysis tool. It does not place orders and it does not replace risk management. Strong BUY and Strong SELL rails show where buying or selling pressure is concentrated. They are reference levels, not trade orders.
Chart objects
Horizontal levels drawn in the selected range:
- Maximum and minimum body extremes
- SMA Up, SMA, and SMA Down
- SMA Up Mid, SMA Mid, and SMA Down Mid
- Gann 0.5 midpoint between minimum and maximum
- Strong BUY and Strong SELL rails when the zone score reaches the minimum score
Vertical lines:
- Start line — beginning of the selected range
- End line — end of the selected range
Both vertical lines can be dragged. Calculations use only the candles between Start and End.
How to use
- Attach the indicator to a chart.
- Place the Start line at the beginning of the price structure you want to study.
- Place the End line at the end of that structure.
- Review the levels, slope, force, touches, score, and imbalance in the panel.
- Treat Strong BUY and Strong SELL as pressure references for further analysis, not as orders to open from the current price.
A useful range is usually one clear price structure with enough candles for stable averages. Mixing unrelated swings or using very short ranges may produce less stable levels.
Inputs
Analysis
- Initial period (bars) — number of candles used for the first Start and End placement (default 200)
- Price source — Close, Open, or average of Open and Close (default average)
- MicroSlope period — number of candles used for the short slope at the end of the range (minimum 5, maximum equal to the range size)
Display
- Show info panel — on-chart information panel
- Show rail labels — text labels on the levels
- Show SMA Up/Mid/Down Mid — dashed third-zone mid levels
- Show Gann 0.5 — dotted midpoint between Min and Max
- Show Strong BUY/SELL rails — highlight the strongest positive and negative score rails
Score
- Force% weight in score — weight of Force percent in the zone score (default 0.6)
- Touch% weight in score — weight of Touch percent in the zone score (default 0.4)
- Minimum score to highlight — a Strong BUY or Strong SELL rail is shown only if its absolute score reaches this value (default 15)
Raw score formula:
Score = absolute Force percent times Force weight + Touch percent times Touch weight
The signed score is positive when Force is positive and negative when Force is negative.
Gaps
- Clean abnormal gaps — off by default. When enabled, only large outlier gaps in the selected range are closed (for example a weekend or session jump). Normal small gaps between candles are kept.
- Gap threshold (percentile 0..1) — which gap size is treated as abnormal (default 0.925). Higher values clean fewer gaps. When a gap is cleaned, the next candle open is moved to the previous close.
Colors
Separate color inputs for Max, SMA Up, SMA, SMA Down, Min, Mid rails, Gann 0.5, Start and End vertical lines, and Strong BUY / Strong SELL marks.
Panel information
- Slope — direction of the linear regression of normalized prices in the range
- Micro slope — short slope near the End line
- Level prices — Maximum, SMA Up, Up Mid, SMA, Mid, SMA Down, Down Mid, Minimum
- Touches — count and percent of candles in each third of the range
- Force — net body pressure in each zone as a percent of the range height
- Score — zone score shown next to each Force line
- Imbalance — sum of Force Up, Force Mid, and Force Down
- Strong BUY — zone with the highest positive signed score, with level name and price (Up Mid, SMA Mid, or Down Mid midpoint)
- Strong SELL — zone with the lowest negative signed score, with level name and price
Strong BUY and Strong SELL
These marks show pressure concentration, not a trade entry from the current price to that level.
- Each zone (Up, Mid, Down) receives a signed score from Force and Touches.
- Strong BUY is the zone with the highest positive score, if that score is at least the minimum score.
- Strong SELL is the zone with the most negative score, if its absolute value is at least the minimum score.
- The displayed price is the midpoint between the classic rail of that zone and its Mid rail (Up Mid, SMA Mid, or Down Mid).
Both marks can appear at the same time. If a zone score is below the minimum, that side is not highlighted.
Notes
SMARiels is intended for chart analysis. Market conditions change, and indicator values are based on the selected historical range. Always apply your own confirmation rules and risk controls before making trading decisions.