Object Synchronizer
- Utilities
- Version: 5.0
- Updated: 10 March 2020
- Activations: 20

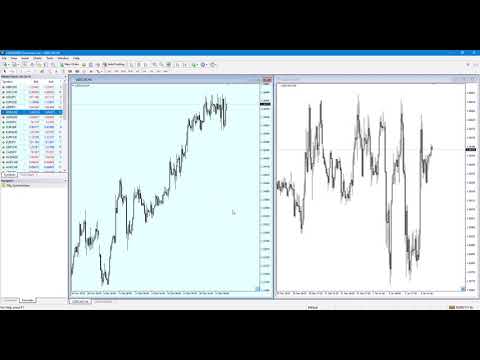
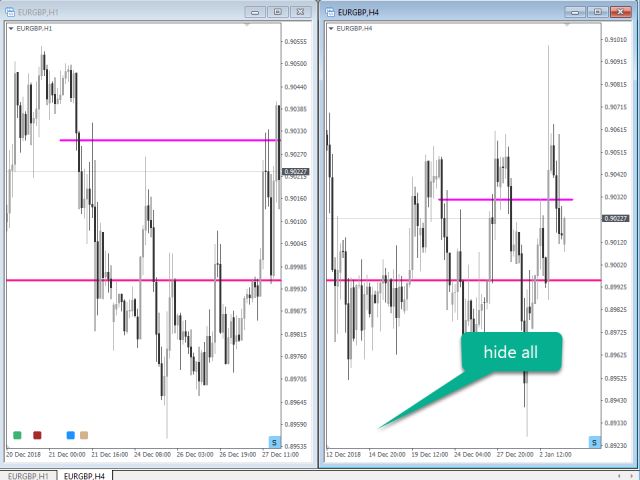
Object Synchronizer: Better focus/analysis of the price chart in many time frames.
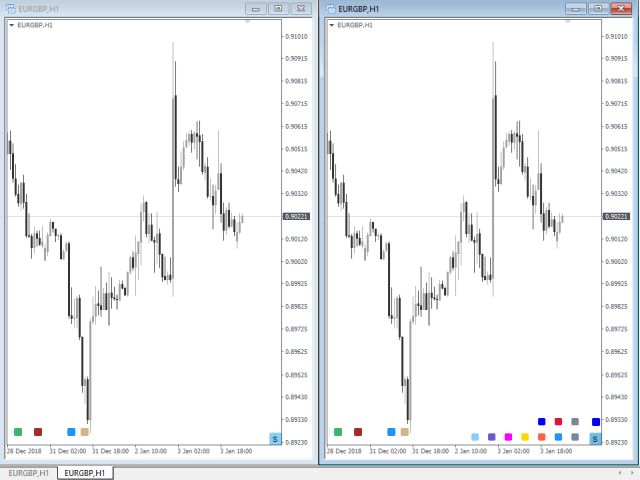
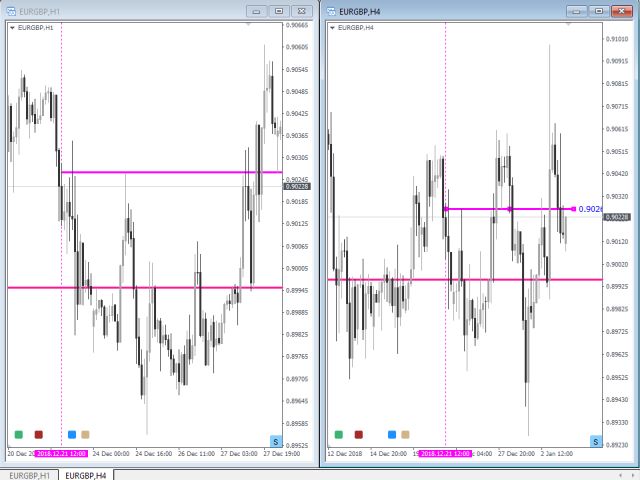
Are you bored to save and load template many times for the same symbol for many chart time frames? Here is the alternative. With this indicator, you enjoy creating objects across many charts, you can modify the same object in any chart, you can delete the same object in any chart. All objects that you created/modified always are synchronized across all chart windows (with same symbol). Save your time, you can focus better on what you are looking for in many time frames.
Supported objects: Horizontal line, Trendline, Rectangle, Fibonacci retracement, Arrows, Equidistant channel, Triangle and Andrews Pitchfork lines
Advantages. [tracking and synchronizing objects across all charts with the same symbol]
- Easy to use. Just attach this indicator to your chart, with customized values and save as a template. Load all charts with the template. Now, it's very easy to create new objects/modify objects from any chart time frame.
- Save your time
- Help you better focus on price action trade in many time frames.
- Clear information for each object.
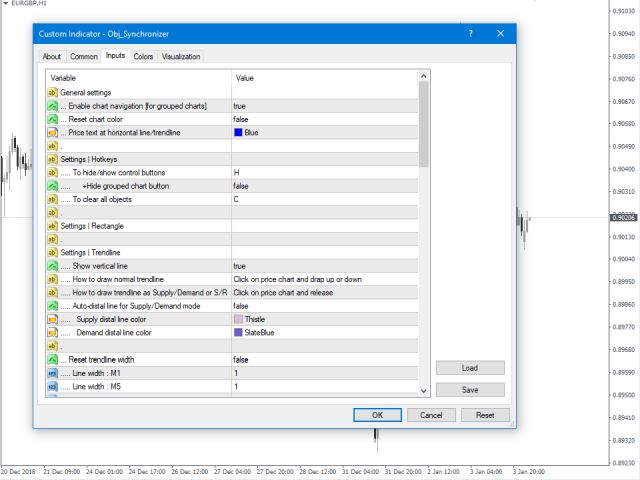
Indicator parameters [for default settings]
Settings: Hotkeys
- To clear all objects: C
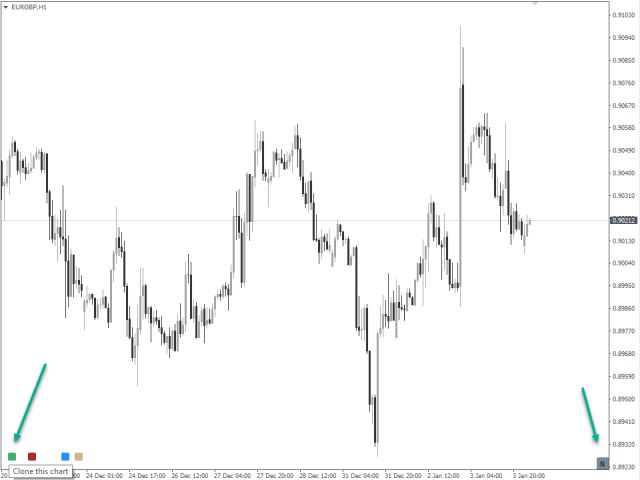
- To hide/show control and status buttons: H
- To synchronize X/Y to time/price: S
- To Draw rectangle as SDZ or PAZ: Z
- To drawn trend line as SDZ or S/R: T
- To open additional chart: A
General Settings for all objects
- Support Fibo objects - True
- Auto-visualization for new object - true
Settings | Rectangle object
- 1. Draw rectangle as Price Action Zone (PAZ)
- .. Use pre-settings - false
- .. Rectangle color
- .. Show price
- .. Price color
- .. Object description text color
- .. Object description text alignment
- 2. Draw rectangle as Supply/Demand Zone (SDZ)
- .. Show S/D level time frame
- .. S/D level time frame: Color
- .. Supply zone color
- .. Demand zone color
- .. Extended supply zone color
- .. Extended demand zone color
Settings | Trendlines
- 1. How to draw normal trend line
- 2. How to draw trend line as S/R
- .. Support line color
- .. Resistance line color
- .. + Show S/R price level
- .. + S/R price level color
- .. +Show S/R level time frame
- .. +Level S/R level time frame color
- 3. How to draw trend line as SDZ
- .. Supply base color
- .. Demand base color
- ... Show price level
- ... Show level time frame
- ... Proximal line price color
- ... Distal line price color
- .. Show vertical line
Settings | Horizontal lines
- .. Show price level
- ... Price level color
- ... Price level Alignment
- .. Show level time frame
- .. Level time frame color
- .. level time frame alignment
- .. Show vertical line
- .. Use pre-settings: Horizontal line color: false
- .. Resistance line color MN-M1
- .. Support line color MN-M1
- .. Use pre-settings: Horizontal line width: false
- ... S/R width: M1-MN
- Pips counter for horizontal line/trendline
- ... Pips counter: Show: false
- ... Pips counter: Color
- ... Pips counter: Auto-hide
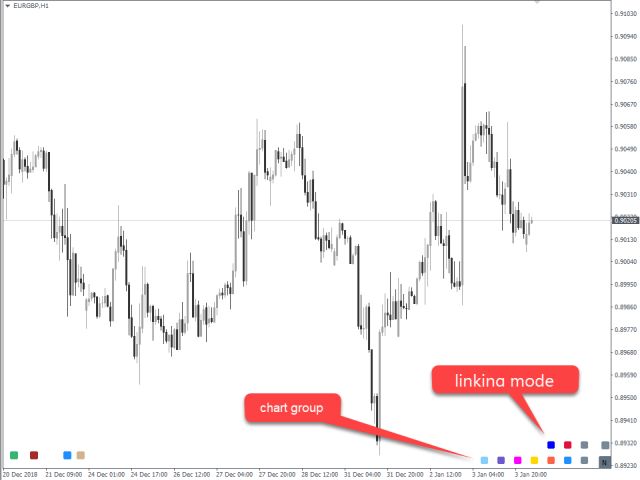
To link charts to the group, the same color group and window linking method is required to be selected.
- Objects will be copied across the grouped chart when the same group button color in each chart is the same and window linking: Symbol
- All chart will be changed to the same time frame when the same group button color in each chart is the same and window linking: Timeframe
Steps are: click on status button and then 1. select chart group, 2. select window linking method for the group
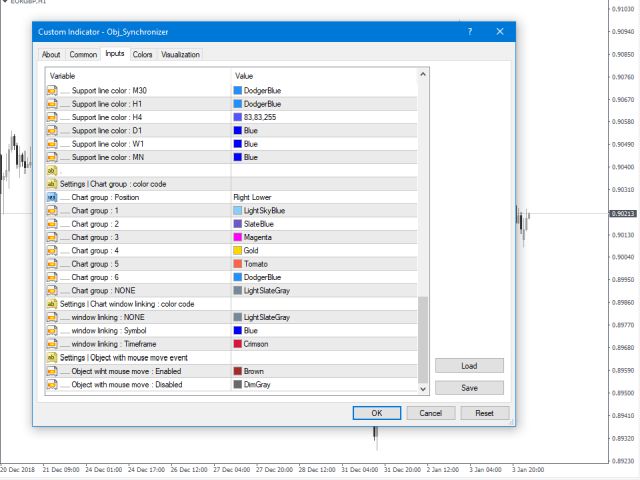
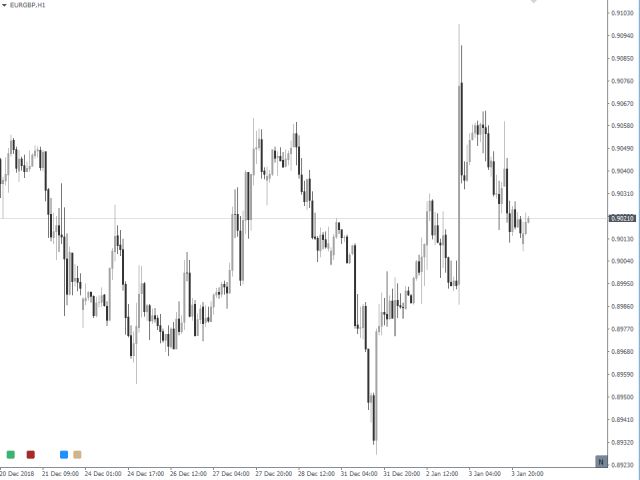
Settings | Chart group: Color code
- ... Chart group position
- ... Chart group: NONE
- ... Chart group: 1 - 6
Settings | Chart window linking mode: Color code
- ... Window linking: NONE
- ... Window linking: Symbol
- ... Window linking: Time frame
Settings | Object with mouse move event: Color code
- ... Object with mouse event: Enabled
- ... Object with mouse event: Disabled
Settings | Rectangle for PAZ or SDZ: Color code
- ... Draw rectangle as Price Action zone
- ... Draw rectangle as Supply/Demand zone
Settings | Trendline as S/R or SDZ: Color code
- ... Draw trendline as S/R
- ... Draw trendline as Supply as Demand zone
Settings: Open new chart
- ... Button color
This utility save me lots of time when doing MTF analysis. I am very happy with this, though some improvements still can be made.