Basic Volume Profile MT5
- Indicators
- Mehran Sepah Mansoor
- Version: 1.20
- Updated: 10 May 2024
- Activations: 10
Discover the power of volume analysis with our volume profile indicator for Metatrader! / MT4 Version
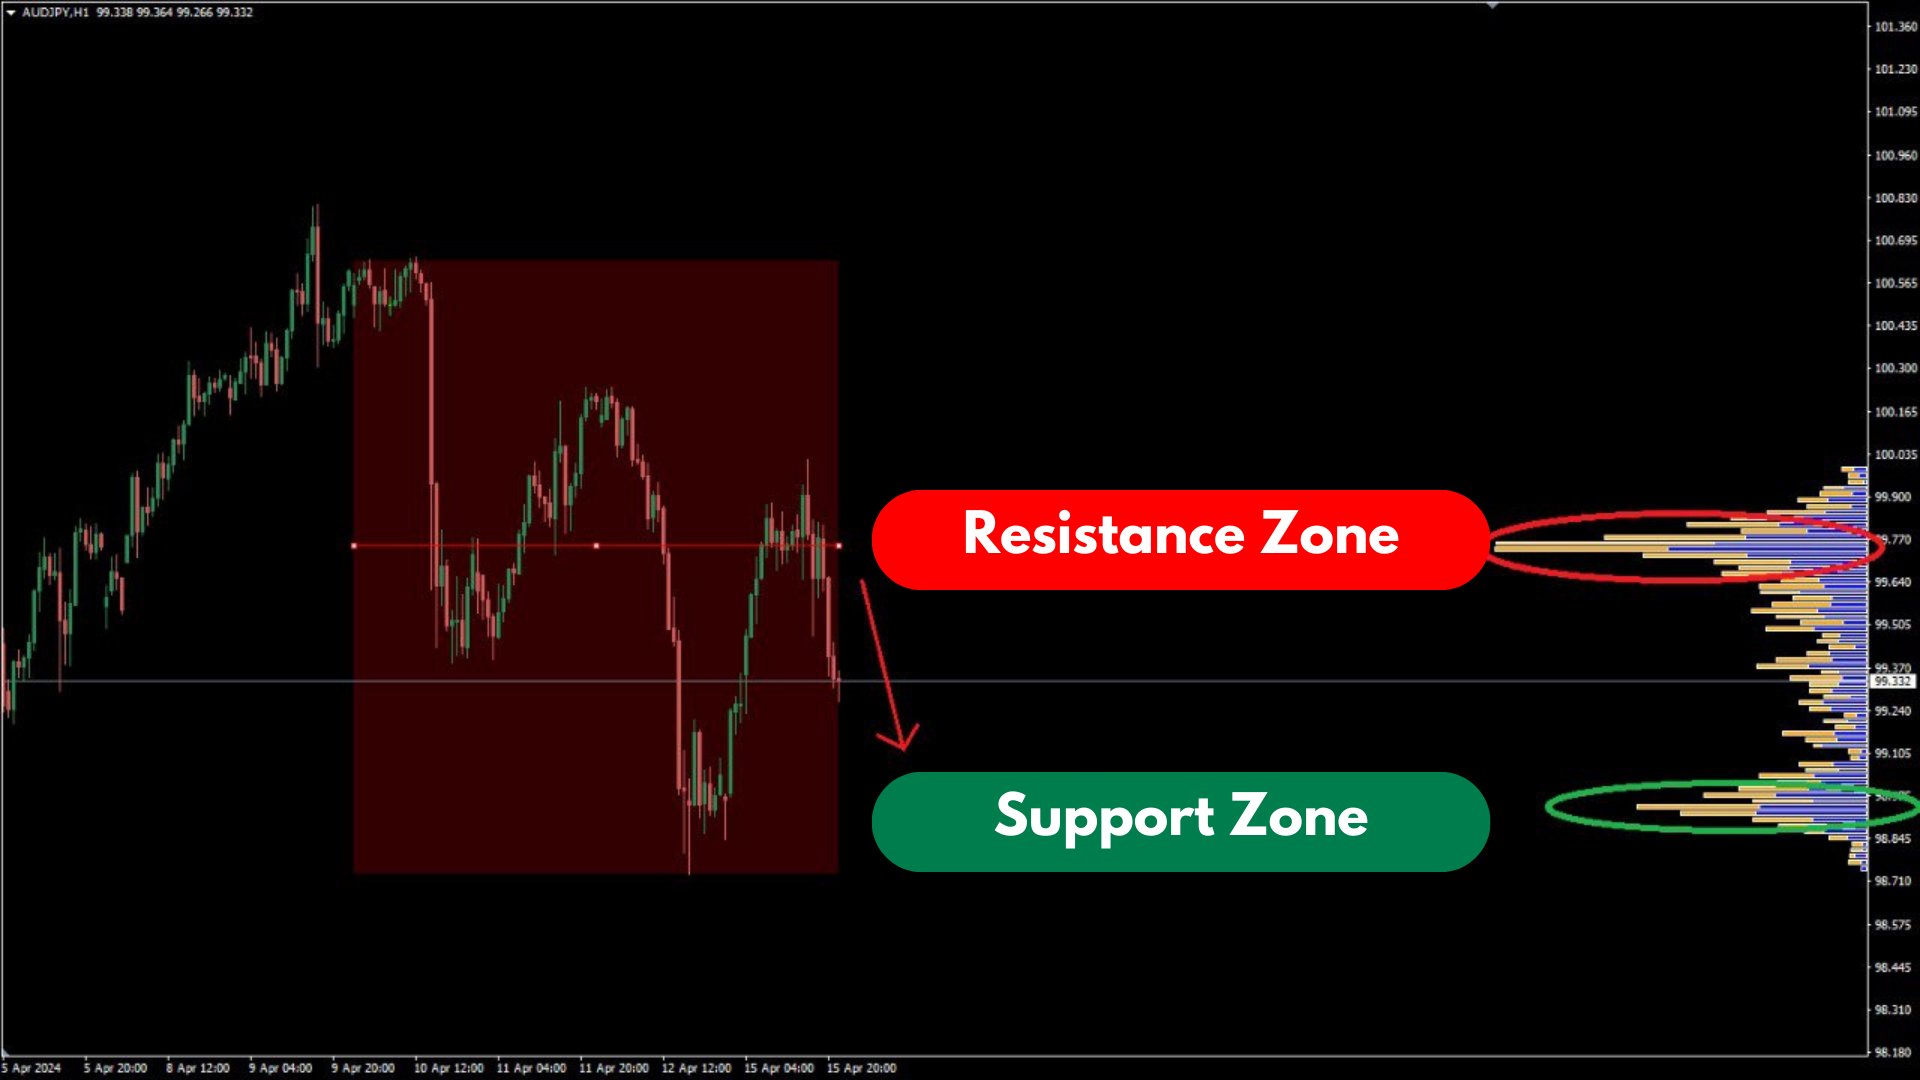
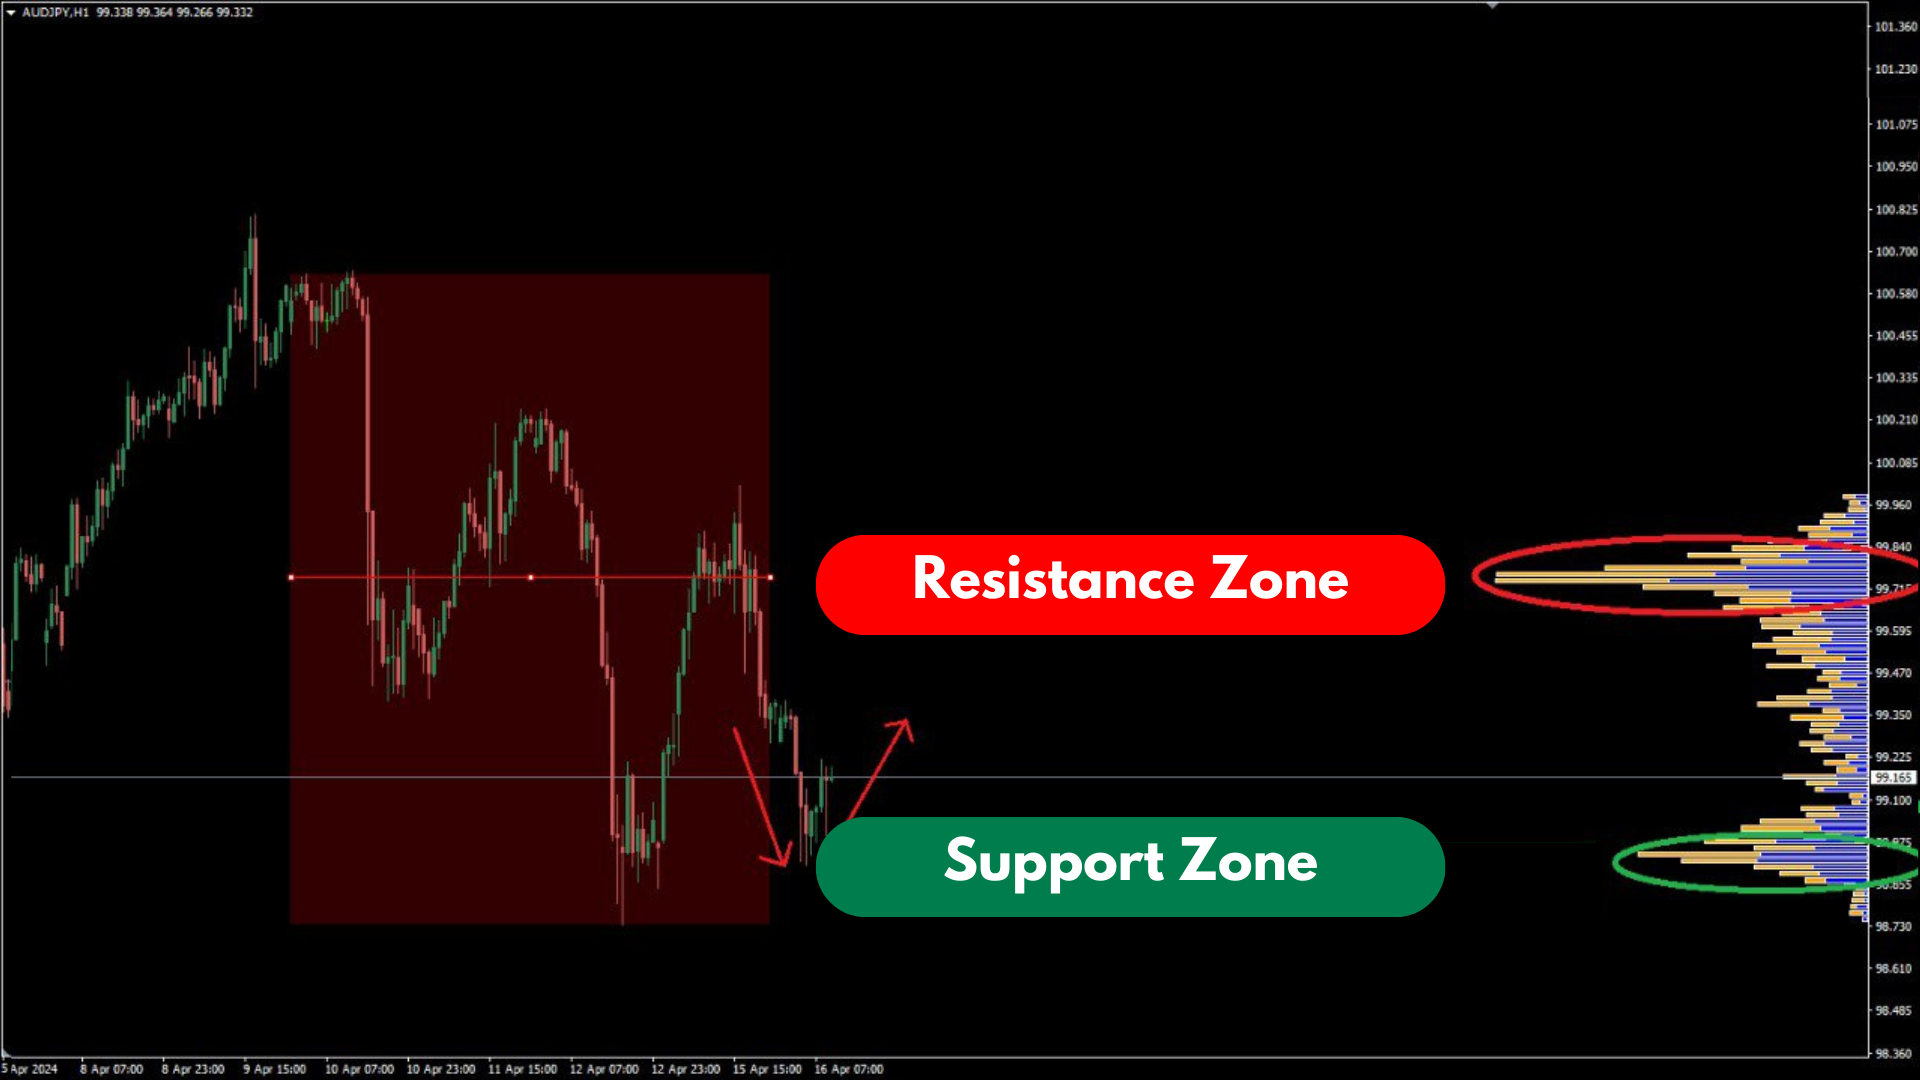
Basic Volume Profile is an indicator specifically designed for manual traders looking to optimize their trading. The Volume Profile Indicator is an essential tool for any serious trader looking to better understand market behavior. With our innovative solution you can clearly and concisely visualize how trading volume is distributed across prices. This allows you to identify key areas of interest, such as support and resistance levels, accumulation and distribution zones, and significant control points. Unlike a normal volume indicator which indicates the trading volume on a specific day, Basic Volume Profile shows you the trading volume for a specific price.
Our indicator features an intuitive and customizable interface that allows you to tailor it to your trading preferences.
Features
- Clear display of the volume profile on the price chart.
- Quick identification of areas of high and low volume activity.
- Full customization of colors and styles to suit your trading style.
- Supports multiple timeframes for comprehensive analysis.
- Dedicated technical support to ensure a smooth experience.
Configuration Parameters
Indicator settings
- Number of histograms: Number of volume bars to be displayed
- Profile position: Whether you want the volume profile to be displayed on the first candle or sideways
- Color mode: Whether you want the volume profile to be split into bullish/bearish or not
Indicator color settings
- Up color: this parameter changes the color of the bullish volume
- Down color: this parameter changes the color of bearish volume
- Total color: this parameter changes the color of the total volume
- Line color: this parameter changes the color of the POC line, which is the price level of the time period with the highest trading volume
- Background color: this parameter changes the color of the background of the box generated by the POC line
- Background opacity: this parameter changes the opacity of the previous frame
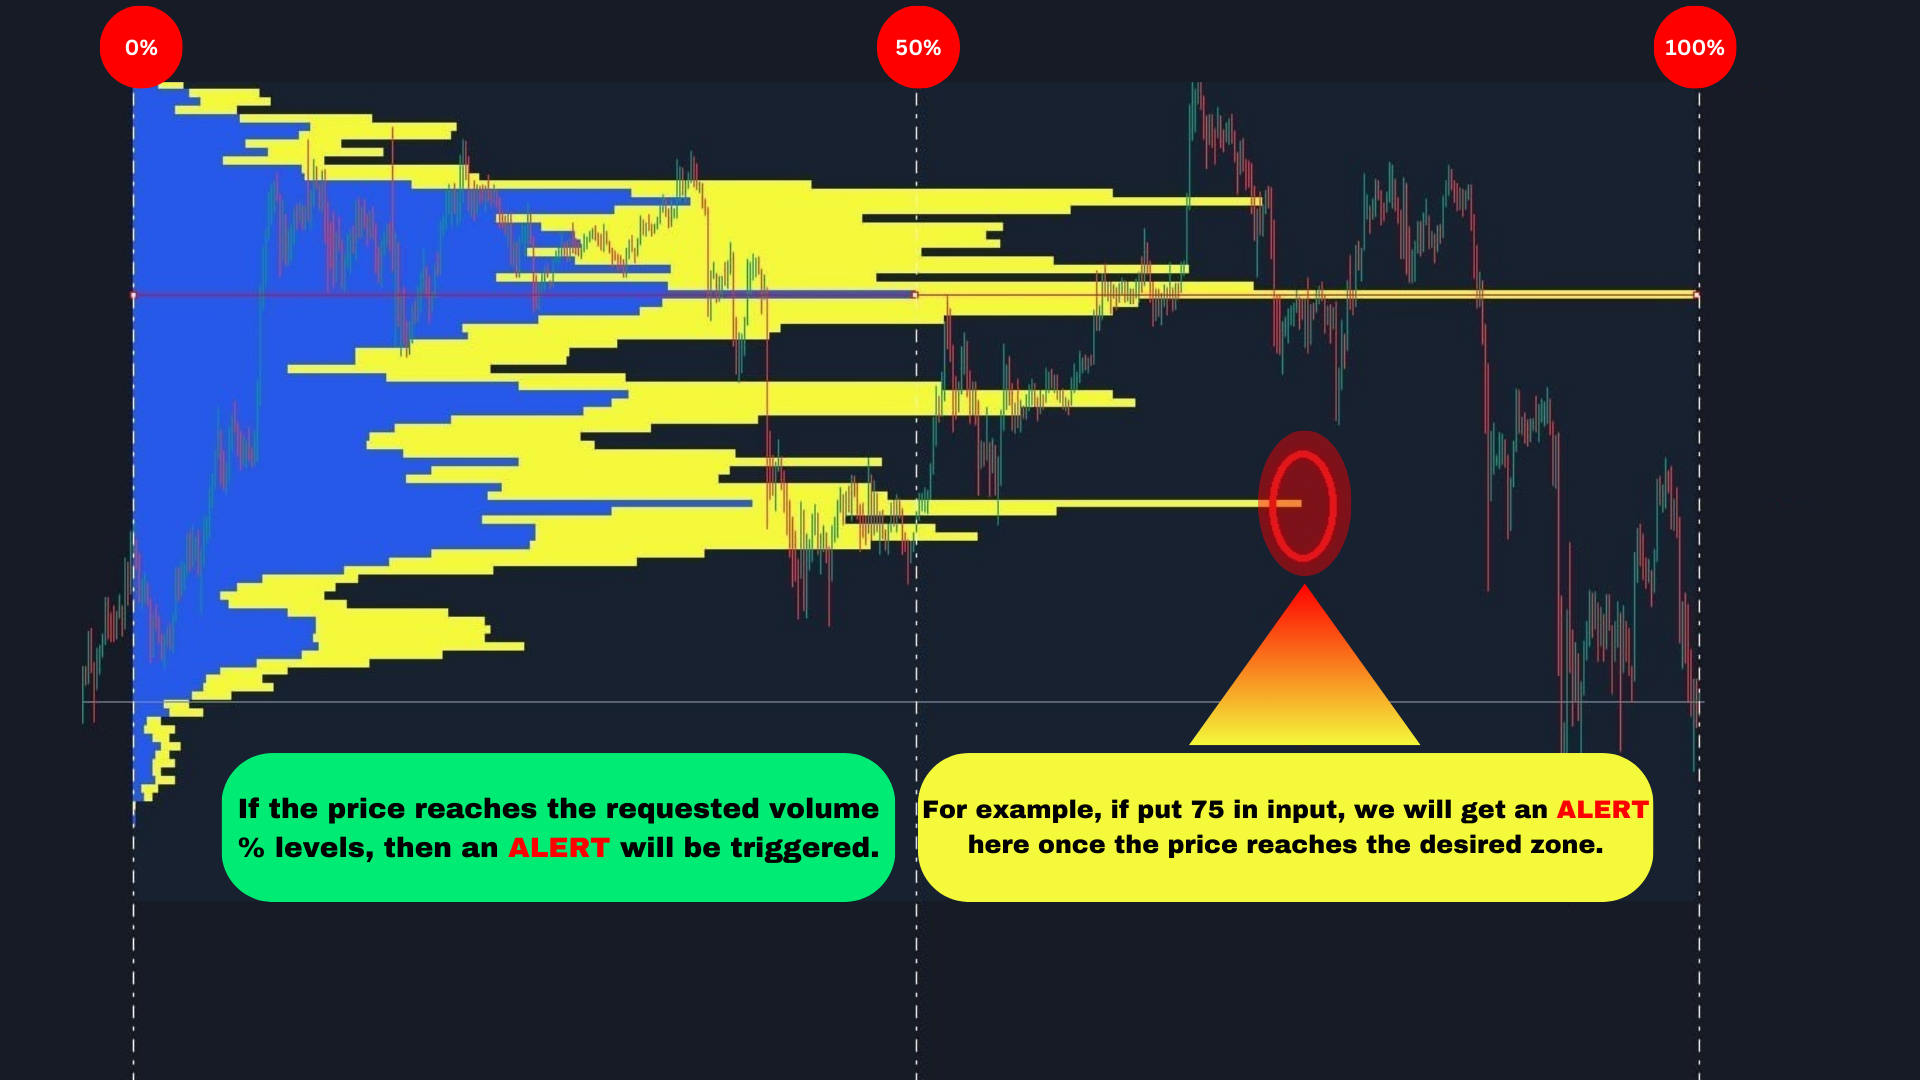
Alerts
- Alert trigger %: alert based on % of volume candles (see picture as example)
- Pop-up alert: alert to MT4 terminal
- Push notification alert: alert to phone
- Email alert: email alert
Chart settings
Here you can set all chart related parameters such as candlestick color and chart background