VWAP With Alerts
- Indicators
- Francisco Gomes Da Silva
- Version: 1.0
This VWAP is a simple VWAP, but we have added alerts to let you know when the price touches the simple VWAP or when the price crosses the VWAP.
This indicator is a traditional VWAP indicator for MetaTrader 5 (MT5).
The default parameters are those of the normal VWAP, but you have the ability to use new calculations and the best part:
When the price touches or crosses the VWAP, you will be notified through alerts, mobile notifications, email, or sound events.
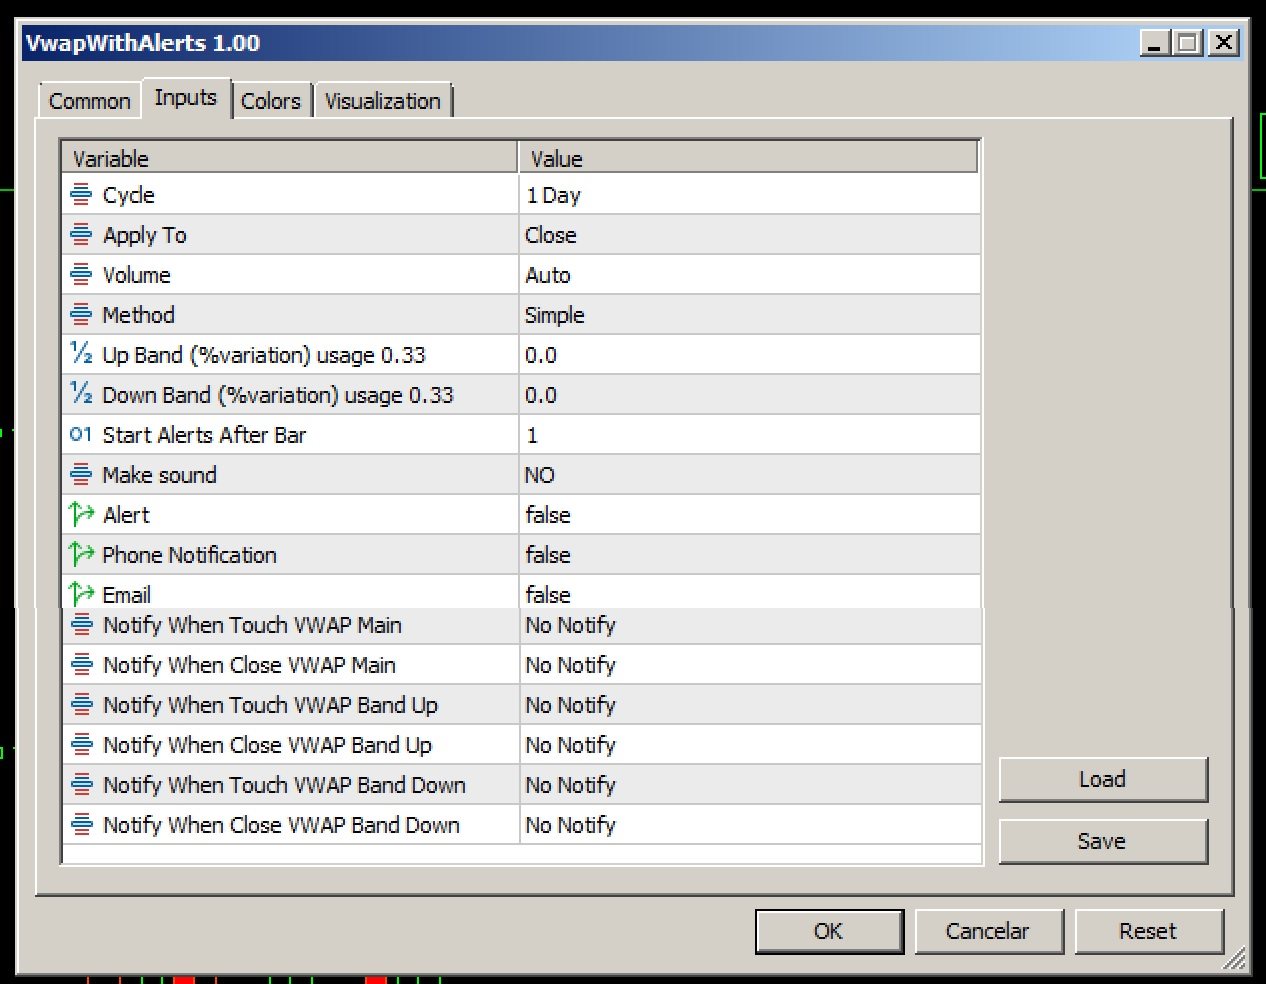
Parameters:
VWAP Cycle
The VWAP calculates based on a time cycle. The common VWAP starts fresh every day with a new calculation. However, we've left this parameter for you to select a time cycle for calculating your preferred VWAP. In other words, you can be on the M1 timeframe and see the H1 VWAP calculation, which refreshes with each new H1 bar. The calculation always restarts with each chosen timeframe cycle.
However, you don't need to worry about it now, as the default parameters are those of the standard VWAP. Just download this VWAP indicator and insert it into a chart on your MetaTrader 5 (MT5).
Price Type
The default for calculating VWAP is the closing price, which is the standard price for simple VWAP. However, you can also choose other price types to use in the VWAP calculation, as listed below:
- Close
- Open
- High
- Low
- Median
- Typical
- Weighted
- Up, meaning the higher price between open and close (to ignore shadows)
- Down, meaning the lower price between open and close (to ignore shadows)
Volume Type
You can choose the volume type or leave it automatic. Automatic means it will use the actual trading volume of the asset as a priority for calculating VWAP, provided the broker provides this information.
VWAP Smoothing Methods
The VWAP calculation itself has no smoothing, but traders have found that by using exponential smoothing on VWAP, you can have faster opportunities.
- Simple: This is the standard VWAP calculation, i.e., volume-weighted by price. It is the simple VWAP you are looking for.
- Exponential: The first variation. With this calculation, VWAP gives more weight to recent prices, providing faster trading or scalping opportunities. However, on very small timeframes like M5 and M1, it is not recommended to use this calculation; it is better to use the Linear Weighted calculation, as there is distortion caused by extreme tick volume variation on smaller charts than M5.
- Smoothed: It is the same calculation as moving average smoothing but applied to VWAP. It is very similar to the calculation of simple VWAP.
- Linear Weighted: It is a very fast version as well, similar to the Exponential VWAP version. However, it works well on all timeframes as it does not have distortions on charts smaller than the M5 timeframe.
VWAP Channel
If you want to have margins on your VWAP, you can select a percentage variation to create an offset on your VWAP, which will also have alerts later.
- Band Up: We have bands for these VWAPs. This band is a percentage variation of the main VWAP price. With this feature, you can create a channel for your VWAP or just a margin to know when the price is very close. The recommended value is 0.33, as it is the most commonly used in VWAP channels.
- Band Down: The same as Band Up, but downward.
Colors, Styles, and Line Widths
Colors, styles, and line widths are chosen when inserting the indicator on the chart. So, you can click on the "Colors" tab to select your favorite style for the simple VWAP and its bands.
Alerts and Notifications when the Price Touches or Crosses the VWAP
Here we have the cherry on top, which is the possibility of receiving a notification on your phone when the price touches the VWAP. So, you don't need to be staring at the chart all the time and can use the time to do other things while waiting for the price to hit the VWAP. The following is a list of what the VWAP indicator with alerts can do:
- Make sound: This VWAP has sound alerts to emit a sound when the VWAP touches or crosses its main lines or its margin bands.
- Alert: This alert is to show a message on your MetaTrader when the price touches or crosses the VWAP. It also works for the bands.
- Phone notification: You can insert the VWAP indicator on your MetaTrader, and this indicator will send a push notification when the price touches or crosses the VWAP.
- Email: Sends an email when the price touches or crosses the VWAP.
Types of Alerts for When the Price Touches the VWAP
You can leave it disabled (default) or enable them one by one to have alerts when there is an event between the price and the VWAP. The options here are:
- Do not notify
- Auto: When you choose the HIGH or UP price as the basis for VWAP calculation, only touches from bottom to top will be alerted. On the other hand, if you choose the LOW or DOWN price as the basis for VWAP calculation, only touches from top to bottom will be alerted. For all other prices chosen as the basis for VWAP calculation, you will receive alerts for both upward and downward touches.
- Notify only when the price touches only from the top
- Notify only when the price touches only from the bottom
- Notify every time the price touches the VWAP from top to bottom or bottom to top
Types of Alerts for When the Candle Closes Crossing the VWAP
- Do not notify
- Auto: When you choose the HIGH or UP price as the basis for VWAP calculation, only when the candle closes crossing the VWAP from bottom to top will be alerted. On the other hand, if you choose the LOW or DOWN price as the basis for VWAP calculation, only when the candle closes crossing the VWAP from top to bottom will be alerted. For all other prices chosen as the basis for VWAP calculation, you will receive alerts for both upward and downward crossing of the VWAP.
- Notify only when the candle closes crossing below the VWAP line
- Notify only when the candle closes crossing above the VWAP line
- Notify every time the candle closes crossing the VWAP from top to bottom or bottom to top
Alerts for Bands as Well
You can also set these same alerts for the VWAP bands.
Also, explore the power of anchored VWAPs.
The Main Advantage
The main advantage of this indicator is the alerts because they will save your time so that you don't have to keep watching when the price will touch your VWAP. Moreover, you don't even need to be at your computer, as this VWAP indicator can send a message to your phone, and then you can make your trade decision based on this information.
Add me as a friend here on the MQL5 site so that you receive a notification when I submit a new project on this platform.


muy bueno