Watch the Market tutorial videos on YouTube
How to buy а trading robot or an indicator
Run your EA on
virtual hosting
virtual hosting
Test аn indicator/trading robot before buying
Want to earn in the Market?
How to present a product for a sell-through
Paid Technical Indicators for MetaTrader 5 - 414

KingTrend — Price Action Trend Analysis Tool KingTrend is a trend-following indicator based on long-standing price action principles involving Highs, Lows, Open, and Close. The logic behind this tool comes from concepts passed on to me by my mentor and translated into code for consistent structure recognition. Features: Identifies market structure using price action logic Detects trend direction and key turning points Marks Higher Highs, Lower Lows, and extensions Suitable for discretionary or

Overview
SwingReversalFullHistory is a precision-engineered MetaTrader 5 indicator that spots true swing-highs and swing-lows on your chart and marks them with non-repainting arrows. It’s perfect for both Forex and crypto scalpers, delivering clear buy and sell signals on every closed bar. Key Features Arrow Color Signal Type When It Appears Green Swing-Low Buy Plotted at the candle’s low wick when a true swing-low is confirmed (Depth bars on each side lower). Red Swing-High Sell Plot

Multi-Level Correlation Analysis of Currencies, Cryptocurrencies, Indices, and Stocks Discover hidden relationships between assets and make data-driven decisions using advanced correlation analysis. "Interaction and Correlation Indicator" is a professional trading tool designed for deep analysis of interdependencies across Forex, cryptocurrencies, indices, and stocks. The indicator calculates the dynamics between fast and slow moving averages (MA) for selected currency pairs, cross rates, and in

Buy/Sell Volume Indicator with Pair Divergence for MT5 version "1.1" Description The Enhanced Buy/Sell Volume Indicator is a custom technical indicator designed for MetaTrader 5 (MT5) to analyze and visualize buy and sell tick volumes in a separate window. It provides traders with insights into market dynamics by highlighting volume dominance, balance, and divergence patterns. The indicator uses tick volume data to estimate buying and selling pressure, offering a detailed view of market sentime

The SuperTrend Advance Trading is a widely-used technical indicator based on SuperTrend Strategy + Price Action + EMA . How it works: - Buy/Sell Signals can be generated when the trend reverses, the conditions of Price action, TrendLine and EMA are met. - After the Signal appears, be patient and wait until the candle closes, at that time place the order as soon as possible. You may have time to review your entry, consider whether it is a good entry or not. - Carefully review the entry, up

Advanced Analysis – Total Visual Clarity
The Ichimoku Dashboard features three powerful dashboards to deliver precise trading signals based on a proven methodology. The color-coded panel design allows users to instantly identify the status of each monitored financial instrument at a glance. The combined table of the "Ichimoku Dashboard" for MetaTrader 5 is a key component that integrates and synthesizes trading signals generated by the indicators, providing a clear and immediate overview to su

DRAGON SCALE User Guide Indicator Visualization The DRAGON SCALE indicator displays several visual elements on the chart: Scale Zone – Displayed as purple areas (accumulation zones) and red areas (distribution zones) surrounding the pivot level. Lifebeat Signal – Appears as an arrow below the candle when the price enters a critical zone. The color of the arrow indicates the direction (green for bullish, red for bearish, yellow for neutral). Entry Countdown – Appears as an arrow above the cand

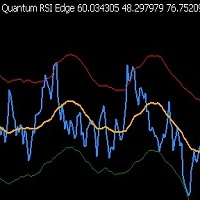
Quantum RSI Edge – Smart RSI Indicator with Dynamic Volatility Channels This indicator combines RSI, moving averages, and statistical volatility channels for precise trading signals. Key Features: Adaptive Overbought/Oversold Levels – adjusts to market conditions. False Signal Filtering – dynamic channels based on standard deviation. Universal – works on Forex, crypto, stocks, and all timeframes. Clear Visualization – colored lines for quick analysis. ️ Input Parameters: RsiPerio

How to Use 1. Setting the Parameters Momentum Period : Adjust based on the characteristics of the trading pair. Use lower values (8–12) for volatile pairs, and higher values (14–20) for more stable pairs. Accumulation Period : Adjust based on the timeframe. Use lower values (3–5) for lower timeframes (M5–M30), and higher values (5–10) for higher timeframes (H1–D1). Energy Burst Threshold : Set according to your desired sensitivity. Lower values (50–60) provide more frequent signals; higher value

From REAL KNOWLEDGE to TRADE LIKE A PRO! CHoCH Power Indicator – Instant BOS & Demand/Supply Zone Detection Transform your gold trading with crystal-clear insights: Trade Gold Effortlessly on M1 & M5 Spot Demand/Supply Zones on M15 & H1 Automatic 61.8% Fibonacci Retracement on M5, M15 & H1 Works Best with SMA 420 Price above SMA420 → Only consider LONG Price below SMA420 → Only consider SHORT SCM Multi-Frame Fibo Suite Multi-Timeframe Swing Detection
• Auto-identify swing highs & lows
• Rea

PULSAR ZONE MT5 Indicator Description PULSAR ZONE is a custom MT5 indicator designed for signal zoning based on volume pressure and trend direction. Ideal for scalping volatile pairs, it provides clear visual cues for both entry and exit points. Key Features Lifebeat Signal A visual signal triggered when a trend reversal occurs with significant volume pressure. Displayed as a green (bullish) or red (bearish) arrow, it highlights high-probability entry opportunities. Entry Countdown Once

What this indicator does. Detects candlestick patterns such as:
Hammer – indicates a possible bullish or bearish trend.
Engulfing – a strong momentum signal.
Doji – market uncertainty or potential reversal.
Three White Soldiers – a strong uptrend.
Three Black Crows – a strong downtrend.
Morning Star – the beginning of an uptrend.
Evening Star – the beginning of a downtrend.
Shows signals on the chart:
Can send a voice, email or pop-up notification when a pattern appears.
The MetaTrader Market is the only store where you can download a free demo trading robot for testing and optimization using historical data.
Read the application overview and reviews from other customers, download it right to your terminal and test a trading robot before you buy. Only on the MetaTrader Market you can test an application absolutely free of charge.
You are missing trading opportunities:
- Free trading apps
- Over 8,000 signals for copying
- Economic news for exploring financial markets
Registration
Log in
If you do not have an account, please register
Allow the use of cookies to log in to the MQL5.com website.
Please enable the necessary setting in your browser, otherwise you will not be able to log in.