 All orders
 Rules
Rules
Job finished

Specification
This is a simple data aggregation tool I want developed for an indicator I am using which is Trend Laser.
To summarize I have the indicator Trend Laser what I need is a developer that can go through trend laser past data and provide me with information for certain items I want to know for example maximum draw back when a signal was present.
To illustrate an example please refer to this diagram,
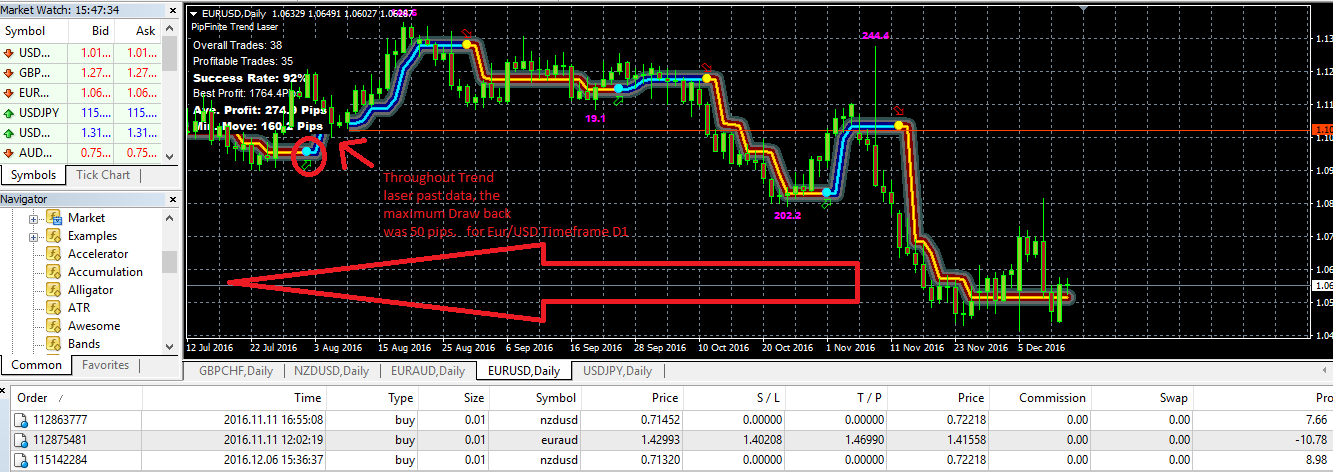
This is a chart for Trend Laser. All I need is to go back to past data and aggregate all that data, then based on that data make certain calculations and indications. In this example I am calculating the maximum drawback for trend laser when it gave a signal for buy it went 50 pips down.
These will be simple calculations that are made based on signals provided by Trend Laser in the past and displayed for me.
The data will be presented in a box on the right hand side, like this example.
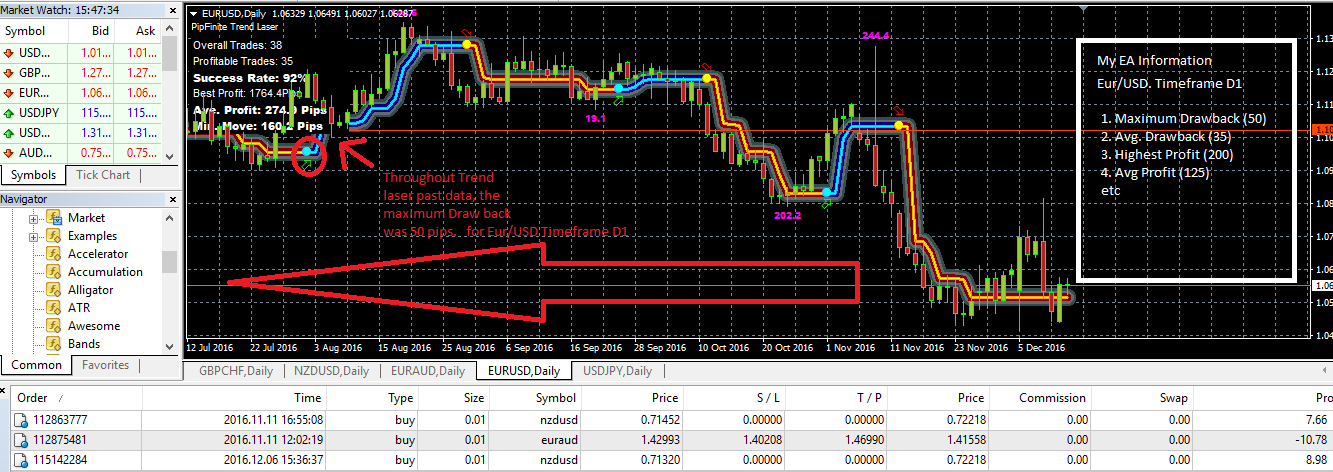
The info should be available for every time frame I select, and all pairs I select.
To summarize. You are going back on previous data from Trend laser Signal Points. You are then aggregating the information and making simple calculations to display the information I would like to see (such as average drawback, maximum drawback, etc.)
I believe that trend laser goes back 200 bars but it depends on the time frame.
This is quite a simple task I just need someone to tweak my Indicator Trend Laser who has a fundamental understanding of programming, has logic and can do basic maths.
If I select you for the job, I'll be more than happy to share all the info I want to collect from Trend laser past data.
I look forward to receiving your applications,
Kind Regards,
Dee