Watch how to order a trading robot
Read the Rules before you post an order or execute it
How to Order a Trading Robot in MQL5 and MQL4
See a sample Requirements Specification to order a robot
New orders in the category:
30 - 75 USD
30 - 50 USD
Specification
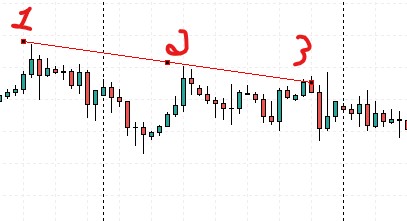
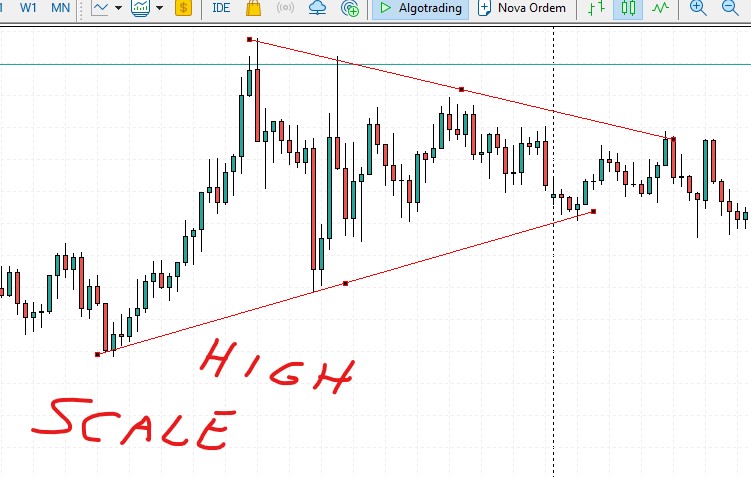
Basically locating fragments of diagonal and vertical support and resistance,
for example: on m15 the price is rising, the price falls and forms a top
then rises again higher or lower than the previous top
then it falls and forms top 2
when it falls again he needs to mark the extended line taking the two previous tops formed
when the price goes up and candle touches the top line, The line needs to be shortened until it touches point 3 in 5 seconds
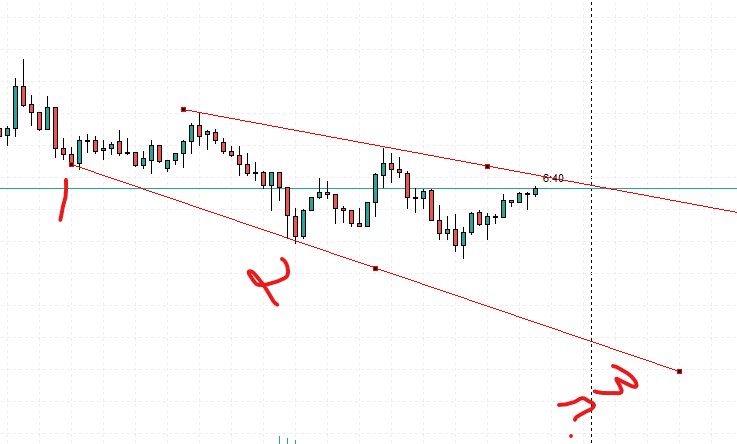
high scale: bar ranges need to be greater than 40 bars Or : input custom: This input must define any range to search for these levels and draw the lines
At each input change, need to delete the lines and insert new ones.
I have code references if you need them, I know a little about programming but it's not enough.
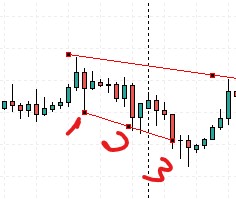
for example: on m15 the price is rising, the price falls and forms a top
then rises again higher or lower than the previous top
then it falls and forms top 2
when it falls again he needs to mark the extended line taking the two previous tops formed
when the price goes up and candle touches the top line, The line needs to be shortened until it touches point 3 in 5 seconds
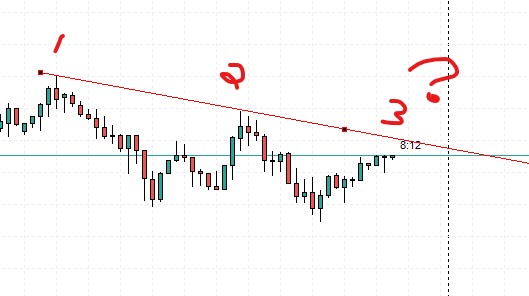
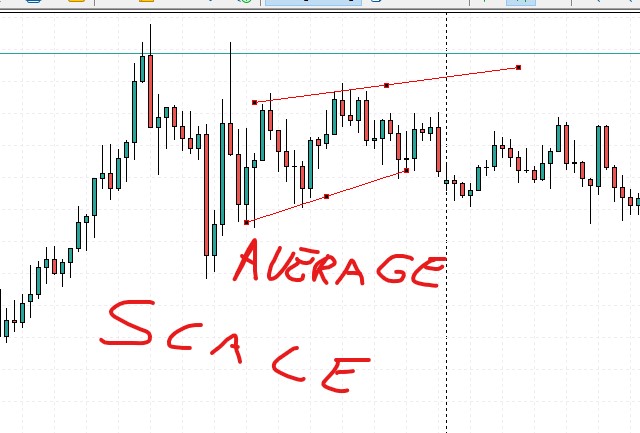
I need at least 2 inputs or 1 to define scales that will be used to test:
high scale: bar ranges need to be greater than 40 bars
medium scale: bar ranges need to be greater than 20 bars
At each input change, need to delete the lines and insert new ones.
I have code references if you need them, I know a little about programming but it's not enough.
Responded
1
Rating
Projects
55
5%
Arbitration
35
0%
/
94%
Overdue
24
44%
Working
2
Rating
Projects
1461
72%
Arbitration
122
29%
/
48%
Overdue
356
24%
Working
Published: 3 articles
Similar orders
EA para mesas proprietarias
50 - 200 USD
Estou em busca de um sistema operacional para mesas proprietarias, drawdown não pode passar de 3% e que faça algo entorno de 1 a 2% ao mês de lucratividade. forex ou futuros, o importante é o resultado
Hello, I need an Expert Advisor (EA) developed for MetaTrader 5, specifically tailored for the EUR/USD currency pair on the 5-minute (M5) timeframe. The robot should execute trades based on Price Action or Technical Analysis (such as Support/Resistance Breakouts or Moving Average Crossovers - I am open to the programmer's suggestions for proven, consolidated strategies). Mandatory Risk Management Requirements
PRECISO DE PROGRAMADOS BRABOS
30 - 75 USD
TENHO UM INDICADOR E EU QUERO QUE TRANSFORME ELE EM ROBÔ OU O ROBÔ FAÇA ENTRADAS COM ELE USANDO OS SINAIS DO INDICADOR. MEU NÚMERO 21969476161 SÓ CHAMAR QUE FALO DETALHADAMENTE
Preciso de uma ia baseado nisso
30 - 50 USD
quero que verifique onde o ativo teve o menor valor de mercado, depois cada vez que o ativo estiver com o menor valor de mercado quero que você faça a compra de 0.3 do ativo EURUSD e faça a venda quando atinger o maior valor com base nos ultimos 366 dias
Project information
Budget
40 - 100 USD
Deadline
to 50 day(s)