Indicator creates a chart and changes the color of candles
The way indicator works
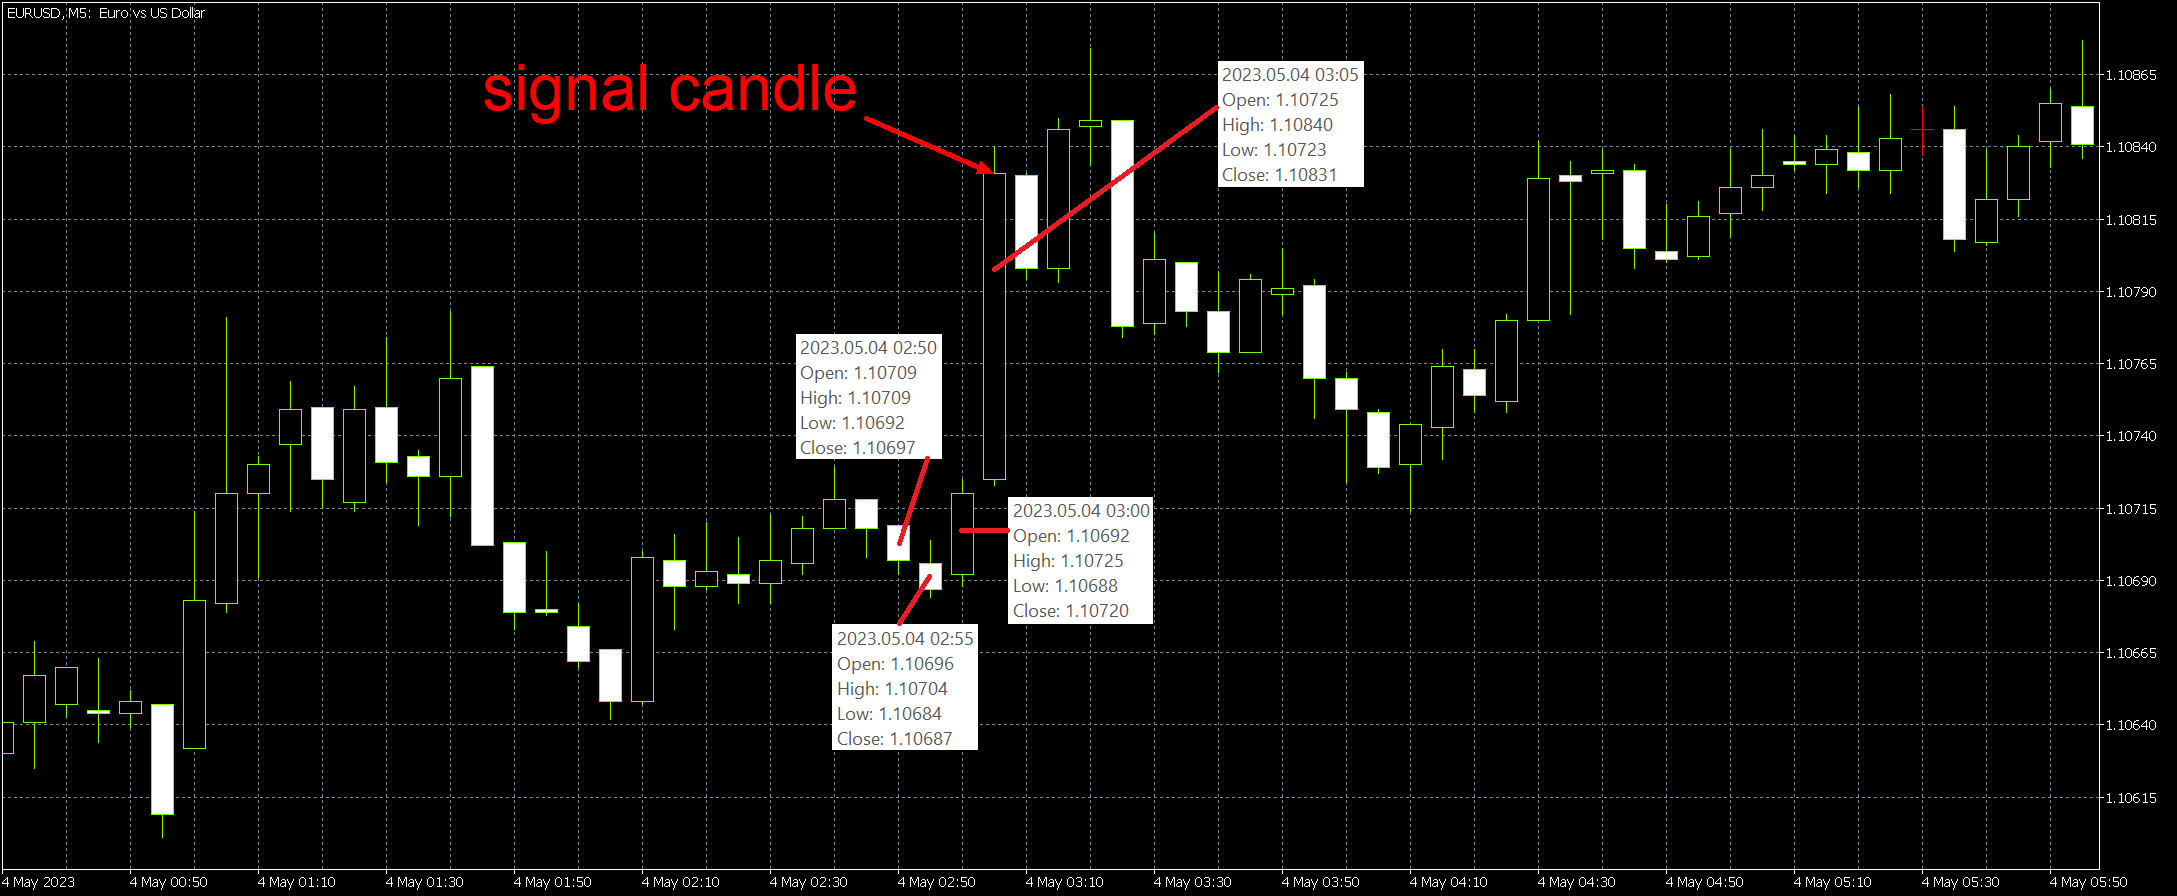
1. The length of a candle, let’s call it a signal candle, is X% more than length of the largest of X previous candles (number of previous candles is an input parameter). Indicator changes the color of this signal candle and creates a tick on the chart.
2. The length of the signal candle is X% more than the average length of X previous candles (number of previous candles is an input parameter). Indicator changes the color of this signal candle and creates a tick on the chart.
Once signal candle has been formed the indicator changes its color as well as color of previous candles that have been analyzed.
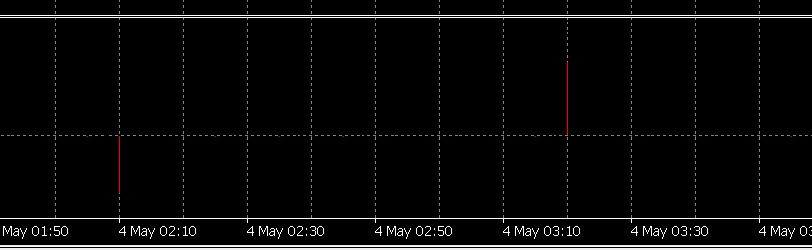
Indicator’s chart has levels 1, 0 and -1.
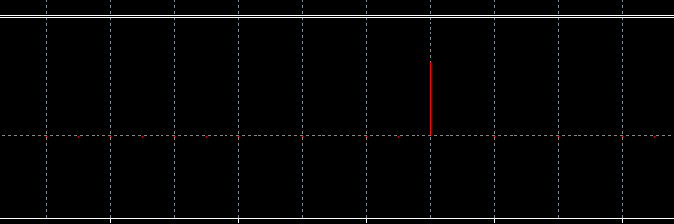
If the signal candle is bullish than indicator’s chart takes the value of 1
If the signal candle is bearish than indicator’s chart takes the value of -1
Indicator’s chart takes the value of 0 with other candles that are not signal.
Indicator’s chart should look like the one on the following picture. Thin vertical lines. The indicator will only have 3 values: 1, 0, -1.

Input indicator’s parameters
There are two tabs.
General
1. Mode - bodies/shades.
· Indicator takes into account open and close prices if mode is bodies.
· Indicator takes into account high and low prices if mode is shades.
2. Number of candles – number of previous candles that indicator analyzes.
3. Average % - shows by how many percent the signal candle length should be larger than the average length of the previous candles.
4. Max % - shows by how many percent the signal candle length should be larger than the length of the largest of previous candles.
Color
1. Signal candle color - The color is the same both for bearish and bullish candles.
2. Previous candles color
3. Chart color
Example
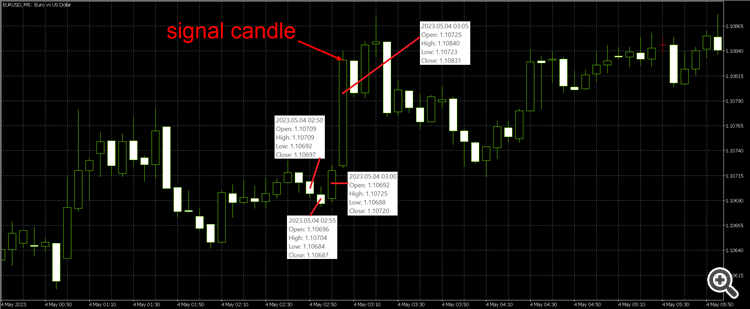
General
1. Mode = bodies
2. Number of candles = 3
3. Average % = 50
4. Max % = 50
Color
1. Signal candle color = Orange
2. Previous candles color = Blue
3. Chart color = Red
Mode = bodies. So we take into account open and close prices.
Let’s calculate the average length of 3 previous candles.
Candle 1. 1.10709 - 1.10697 = 0.00012
Candle 2. 1.10696 - 1.10687 = 0.00009
Candle 3. 1.10720 - 1.10692 = 0.00028
If candle is bullish than its length = close price – open price
If candle is bearish than its length = open price - close price
Now the signal candle 1.10831 – 1.10725 = 0.00106
Average = 50%. So the signal candle should be larger at least by 50% than the average length of the previous candles.
(12+9+28)/3 = 16.3. If 16.3 points = 100% than 106 points = 650.3 %
The requirements are met. The signal candle is much larger than average length of previous candles.
Max = 50%. So the signal candle should be larger at least by 50% than the largest of the previous candles.
If 28 points = 100% than 106 points = 387.6 %
The requirements are met. The signal candle is much larger than max length of previous candles.
Once signal candle has been formed the indicator changes its color as well as color of previous candles that have been analyzed (3 previous candles in this case) and creates a tick on the chart. 3 candles that were analyzed and all other candles that are not signal candles are reflected on the chart as 0.
Similar orders
We are seeking an experienced MQL4/MQL5 programmer to develop a high-performance, fully automated Expert Advisor (EA). The bot must execute a sophisticated multi-currency hedging strategy across correlated forex pairs. Key Responsibilities Develop Multi-Currency Logic : Build an EA capable of scanning and trading multiple currency pairs simultaneously from a single chart or setup. Implement Hedging Strategy : Code
I need an experienced MQL5 developer to create an Expert Advisor (EA) based on the trading strategy demonstrated in my video. The EA should accurately follow the entry, exit, risk management, lot size, trailing stop-loss, take-profit, and trade management rules shown. Full source code, backtesting, bug fixing, and clear input settings are required. And it should have option for Buy and Sell, then Sell only, Buy only
I am looking for an experienced MetaTrader 5 expert. I already have 3 MT5 trading accounts. I need someone to: 1. Help me choose a reliable Windows VPS. 2. Connect to my VPS remotely (AnyDesk or TeamViewer). 3. Install 3 MetaTrader 5 terminals. 4. Configure: - 1 Master Account - 2 Slave Accounts 5. Install and configure a professional Trade Copier. 6. Copy all trades from the Master account to both Slave
Hi there developer, I need someone who can create an trading ea that place order in points using an. Vps with an stop loss in 2 point behind the order price automatically it close order in 1 point if the market reverse
I have an MT4 custom indicator (.ex4) that I use regularly, and I would like an identical MT5 version. Important: I do not have the source code (.mq4). I only have the compiled MT4 indicator. I am looking for an experienced MQL developer who can recreate the indicator's functionality and appearance for MT5 by analyzing its behavior. The MT5 version should match the MT4 version as closely as possible, including
I need a Trend following Bot. Here we took entries by looking at two indicator which are 200 period ema and 12 26 9 MacD. Rules for entry exit are: Buy trade: When market is above 200 ema and MacD Line cross over the signal line and this cross over happened below the zero line of MacD indicator. We simply put Buy trade. Sell trade: When market is below 200 ema and MacD line crosses below the signal line and this
I I would like to create a trading robot based on 2 ema crossing. The robot is pretty simple, it should open buy position when fast ema cross slow ema and vise versa. Also it should use martingale after the loss position. It should has expiration period inside the code and alerts l
1. The general process is: Automated online forex marketing to find potential clients -> Answering potential clients' questions -> Converting them into actual clients -> Opening accounts, depositing funds, and copying trades. 2. Developers could implement an AI Digital Twin/Shadow Agent to answer customer questions, eliminating the need for me to answer customer inquiries. 3. I have a CTA website and I'm manually
Am looking for a bot to trade .so that I can be able to trade and become very successful and make some profit so that I cannot sleep on a empty stomach
Hello Traders and Investors, I am a professional algorithmic trading developer specialized in building high-quality Expert Advisors (EAs), Indicators, Scripts, and Trade Management Tools for MetaTrader 4 and MetaTrader 5. With extensive experience in financial markets and trading automation, I can transform your trading ideas into reliable and efficient solutions with clean, optimized, and well-structured code. My