Dashboard based on Fibonacci and Candlestick Pattern

Specification

Need one MT5 Dashboard that can display and generate Alerts based on Fibonacci and Candlestick Patterns on Higher and Lower timeframe combination. Need its source code also.

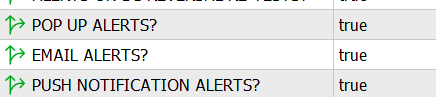
The alert setting should have below options, Similarly there should be true false option to be set for each higher and lower timeframe to turn them on and Off for checking on Major or Minor Timeframes, Atleast 1 Major Timeframe and 1 Minor Timeframe is Mandatory to select, Default will be 4 Hour for Major Timeframe and  30 Minutes for Lower timeframe.


Bullish Buy Scenario on Pullback

------------------------------------------

First Identify the Trend using the Higher timeframe like 1 Week, 1 day and 4 Hour Candles(is current candle above or below previous candle of same timeframe, also look at the moving average like 200,100,50,20 etc. on various timeframes with respect to current price) and then at various fib levels wait for a pullback till either 61.8% or 78.6%,  and then wait for a Bullish candles on lower timeframe like 1 hour, 30 minutes, 15 minutes, 5 minutes  etc.  then Show Buy alert when the candle closes. The list of Bullish Candles to be scanned should be configurable like Hammer, Dragon Fly Doji, Bullish Engulfing, Morning Star, Tweezer Bottom, Bullish Marabozu, Inverted Hammer, etc. The Body or wick of this candle should touch the Fibonacci % line and its closing price should be above the Fibonacci Percentage line. 

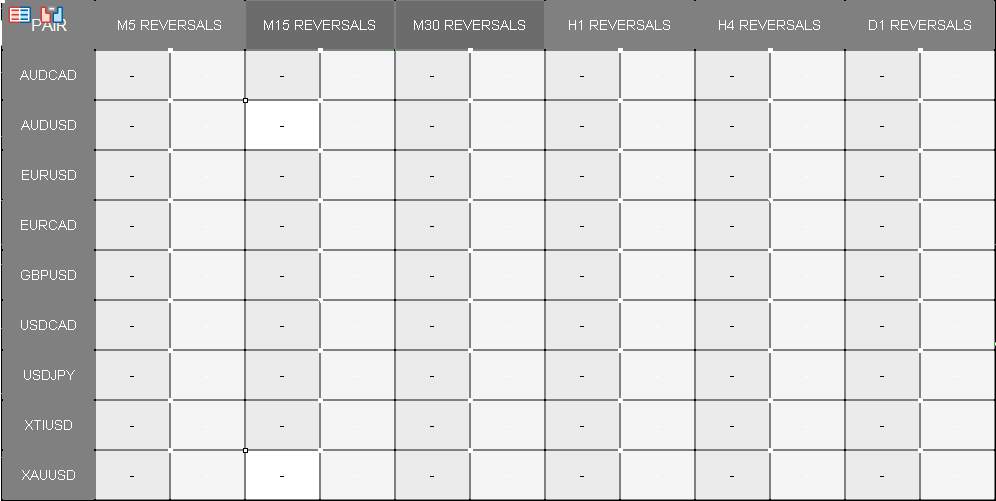
Need a dashboard which can show in a table for all symbols present in the marketwatch if this criteria is met or not, if met it should show the Date and timing when this condition first became true in User timezone (Default will be IST timezone (India time)). Then when we click on that symbol the chart should open for that symbol for that particular timeframe and that candle should be highlighted where the condition became true. 

Dashboard will show Symbol, which higher timeframe is Bullish, what is Fib percent where the candle has been created and the timeframe of that candle which is of a lower timeframe. Also there should be a column in the Dashboard that says if High/Low of this candle is broken or not by its next candle if yes it will show High broken at IST timestamp. When a new candle pattern is generated on same fib line then show both records but show recent record on top and old record below that. Put option to sort and filter on any symbol/pair and timeframe and recent date timestamp etc. Dashboard Table will look something like this. the Font size we should be able to reduce or increase and the text should be automatically wrapped, like WORD WRAP will be ON always. When Symbols are extra and cannot fit on one screen show a scroll bar for horizontal and vertical scrolling, if scrolling is not possible show pagination with next and previous buttons. The Dashboard can be applied on top of any chart on any timeframe but it will scan for this pattern on all timeframes and all symbols present in the Marketwatch of MT5. 


Responded

1
Developer 1
Rating
(222)
Projects
388
32%
Arbitration
52
37% / 40%
Overdue
138
36%
Busy
2
Developer 2
Rating
(42)
Projects
60
45%
Arbitration
2
0% / 100%
Overdue
0
Working
3
Developer 3
Rating
(559)
Projects
631
41%
Arbitration
21
57% / 29%
Overdue
45
7%
Working
4
Developer 4
Rating
(9)
Projects
4
0%
Arbitration
11
0% / 82%
Overdue
0
Free
5
Developer 5
Rating
(37)
Projects
71
39%
Arbitration
0
Overdue
0
Working
Similar orders
The idea behind this robot is to identify and confirm the direction of the market's trend using the higher timeframe charts before switching to the lower timeframe charts to find low risk, high probability trade setups in the direction of the prevalent trend to take advantage of. For example, If the direction of the trend is Bullish, then the robot will only take long trades on the lower timeframe charts and vice
Hello , i want to create an EA that get the High and Low of a specific time period for example from 10:00 to 11:00 , then set a sell stop on low and buy stop on the high , with tp and sl
preciso de um EA baseado em um indicador simples parecido com bandas de bolinger. O indicador funciona como um canal e quando o preço bater na linha de baixo deve ser feito a compra e vice-versa,ele deve abrir apenas uma ordem por direção,se abrir uma compra a próxima entrada deverá ser uma venda
Trendline 30+ USD
inserisce ordine buy quando la chiusura della candela precedente è sopra la retta, sell viceversa. chiude a stoploss chiude in 1 o più volte l'ordine quando guadagna % variabile sul prezzo di ingresso e mette stop a breakeven ogni volta le rette vengono inserite automaticamente al prezzo high/low della candela dell'ultimo fractal confermato. (confermato!! non quando appare)
I am laying the last hand on my EA and want someone with great experience to check it and add the following features to it: -Magicnumber, custimizable -Account lock, so i can put in a accountnumber and the EA will only work on that specific accountnumber
This strategy is going to be based on 3 sets of indicators. Indicator 1: Moving averages. Here we need 2 moving averages. ✓ The 50EMA and, ✓ The 200EMA. - Whenever the red 200EMA is above the blue 50EMA, this gives the idea that the market is bearish (look for sell opportunities) - Whenever the 50EMA is above the 200EMA this gives as the ideas that the market us bullish (look for buy opportunities). Indicator 2
Hi, I have a trading view indicator project that I've done most of it, and it needs to be completed within 36 hours. I need an expert pine script to help me finishing it. the strategy is the alignment of divergence with demand and supply zones, when the price gets rejected from a demand zone with divergence, the indicator should give a buy signal, and when a supply zone rejects the price, the indicator should give a
am looking for a developer to build a profitable MT4EA. EA will work with pending orders. It has to increase lot size when account is growing. Immediately trail stop loss on triggered order. EA will only trade one pair. open both sell stop and buy stop at the same time. (Requirements will be given to selected developer)
I want EA to picks symbols of the most strong, and trade by typical indicator like MACD. EA calculate this strength in real time to pick which symbols to be traded. For this, once everyday EA calculate the historic strength of all given symbols with ten years historic data, and, with this value, EA calculate Relative Strength in real time continuously. The exact calculation method will be given after being dedicated
Greetings developers, I am looking for someone who is advanced and skilled when it comes to programming. I need an EA that will draw a horizontal line on a specific area/price and will open trades when certain condotions are met below nor above the line which I will give more details later on. This are some of the requirements I will also need in the EA. Three signal types, Analyze on 1m or 5m option, Stop loss

Project information

Budget
30+ USD
For the developer
27 USD
Deadline
from 5 to 7 day(s)