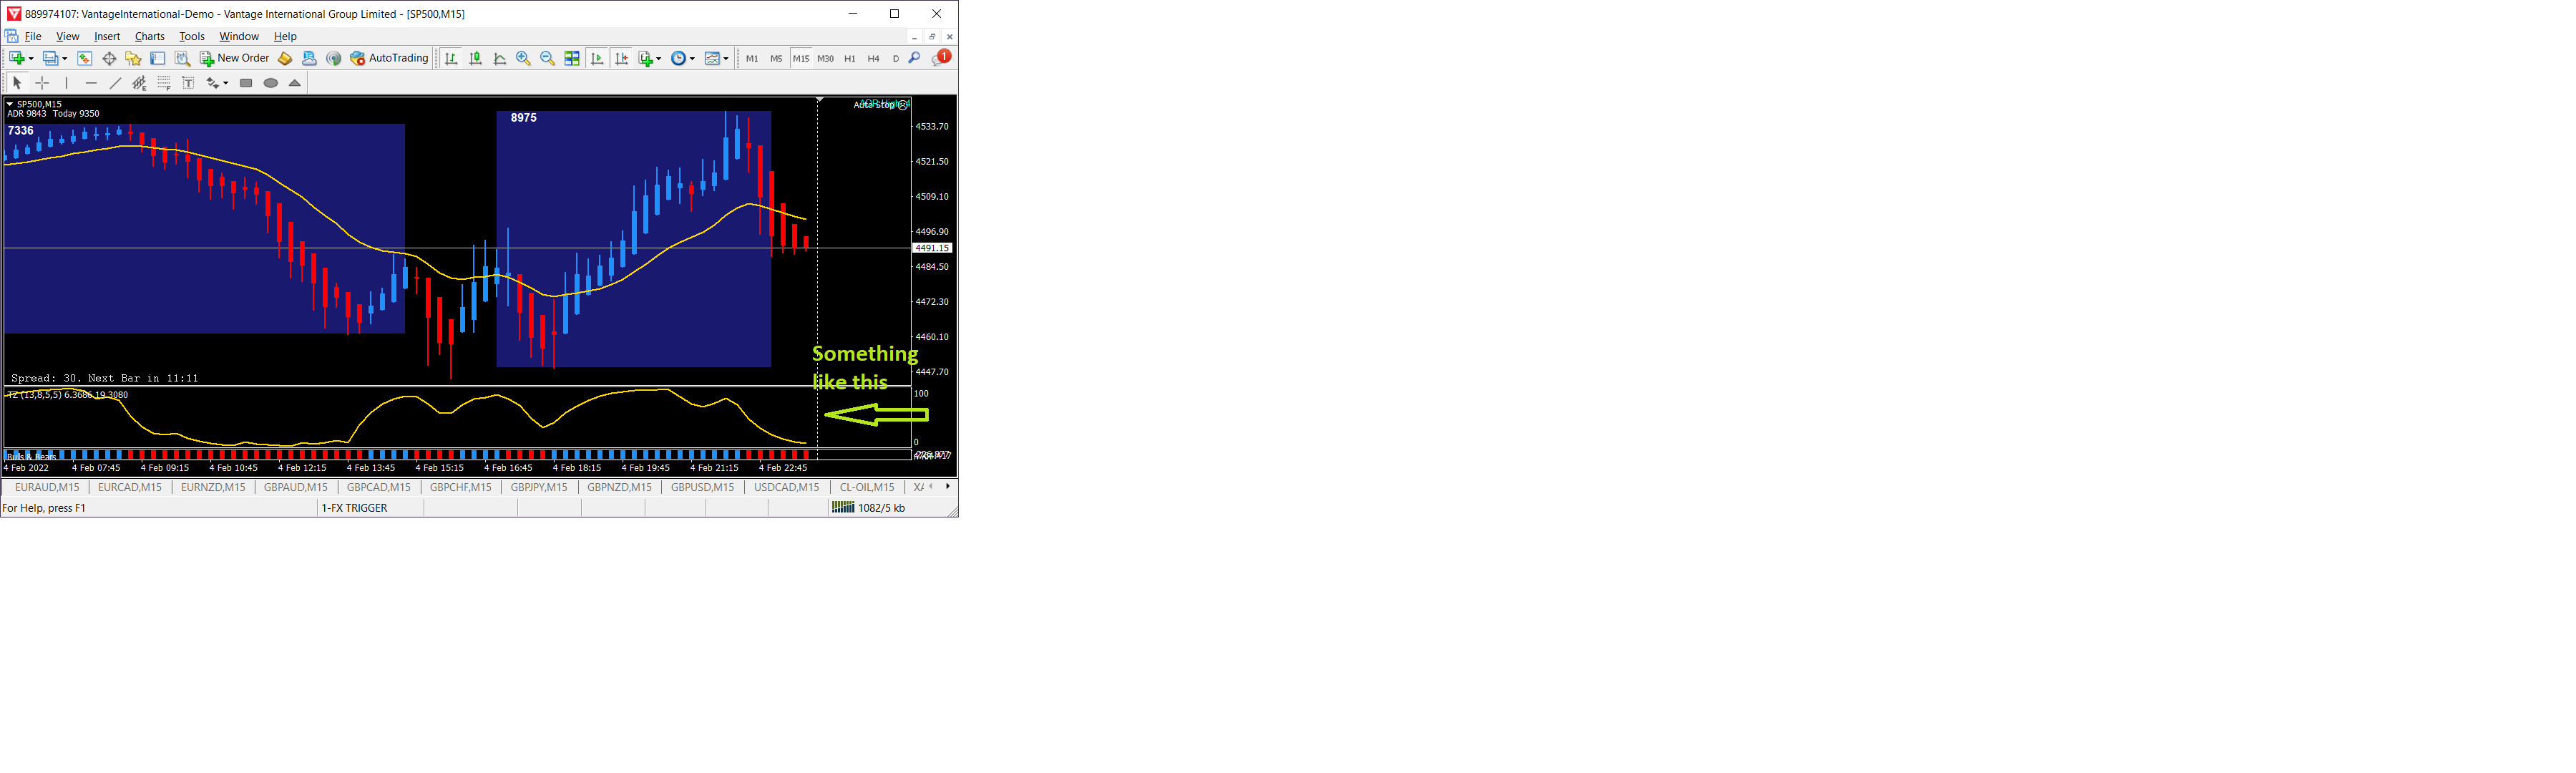
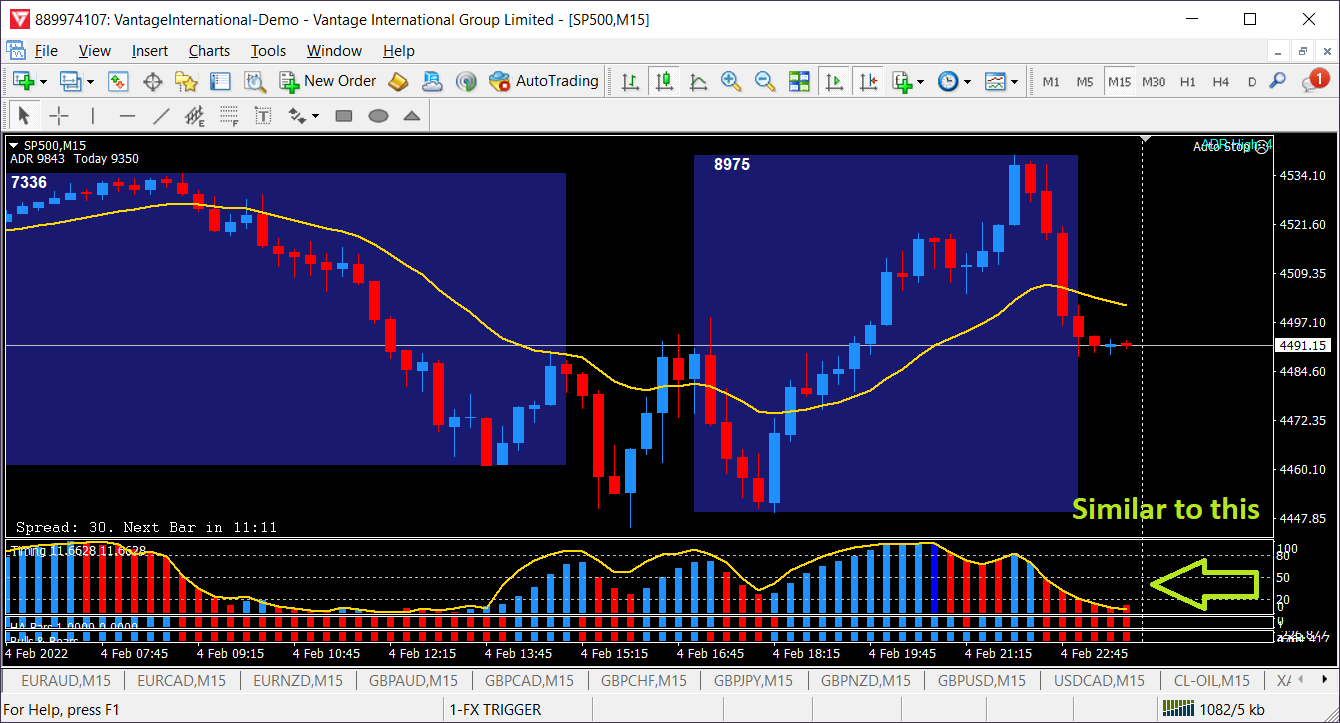
In an indicator window, I want an line graph showing the deviation of price from a rapid moving average, i.e. closing price – moving average of closing price, normalized to a percentage as explained below.
I would like a copy of the code in MQL4 for my own purposes. I’d like to retain exclusive copyright to the work.
INPUTS
A. select either simple moving average (SMA) or exponential moving average (EMA)
· 1=sma, 2=ema, default 1
B. number of bars in the moving average
· minimum 2, default 10 bars
C. (requirement deleted)
D. number of bars in the normalization period
· minimum 2, default 50 bars
E. toggle color bars below the curve
· false=off, true=on (default)
· If “true”, there should be color bars below the deviation curve, blue = increase in deviation, red = decrease in deviation (i.e. line graph up/down). See attached image for a rough example.
F. levels for indicator gridlines
· default -60%, 0, +60%
If negative levels cannot be achieved (I haven’t seen them), translate -100%,+100% to 0%,100%.
NORMALIZATION
The deviation should be normalized as a percentage of the maximum absolute deviation over the normalization period,
e.g. if the maximum absolute deviation over the last 50 bars (or see input D) is 40 pips, then we represent a deviation of +30 pips as +75% and a deviation of -10 pips as -25%
The indicator scale should show -100% to +100%, with default levels at +60%, 0%, and -60% (or see input F).
The “About” screen in the properties window should explain the input parameters. Please use this text:
Copyright Timothy Horton, Toronto 2022
· moving average method: 1=sma, 2=ema
· moving average period: minimum 2 bars
· normalization period: minimum 2 bars
· show color bars: false=off, true=on
Similar orders
I need any highly profitable MT5 robot which trades any sythetic indices on deriv very profitably. It should have good risk management and any good strategy The EA should have good risk management and can trade small accounts like 50 - 100USD Developers who have already made robots have higher chance
I'm looking for someone with a 5-star rating and a high number of "Completed Jobs" in MQL5. PLEASE MAKE SURE YOU READ MY DISCRIPTION AND THE UPLOADED CODE BEFOR SPEAKING TO ME. To trade - XAUUSD+ Broker - vantage.com raw account starting balance - £1000 I require a high-level MQL5 developer to build/refine a sophisticated Expert Advisor. I have attached the original source code. The developer must use the attached
I need a fully automated trading robot designed to generate consistent profits while strictly controlling risk and minimizing losses. The robot should use a combination of strategies, including trend-following, scalping, and price action, and must be able to adapt to different market conditions such as trending and ranging markets. It should analyze the market using indicators like Moving Averages, RSI, MACD, and
Seeking developer service to code an EA. Interested developer must have good experience and understanding on how ORB and FVG works, and agreed to the terms below : 1. Shall demonstrate a fully functional EA that operates as specified in the requirement and function automatically as requested in real-time environment (forward test - demo/live), regardless of good results obtained in strategy-tester. Backtesting
I need a robot for trading gold and currencies . I need to use it with metatrader 4 and 5 . My budget is not high . Max . 70 USD. I need to be able to start and stop it at any time without restrictions
am looking for an experienced MQL5 developer to build a high-frequency trading Expert Advisor (EA) for XAUUSD (Gold) on M1 and M5 timeframes . The EA must include advanced execution logic, dynamic pending orders, risk management, and news/session filters. Clean, efficient, and well-documented code is required. Strategy type: Scalping (fast trades, quick profit). Very fast execution logic (optimized for speed). Goal
Title: MT5 EA Needed – Prop‑Firm Compliance Tool (SL/TP at Entry, 60‑Second Hold, Daily Profit Cap, 0.5% XAUUSD Risk) Description: I need an MT5 Expert Advisor that enforces prop‑firm compliance rules for Instant Funding accounts. The EA must NOT trade automatically — it should only monitor and control my manual XAUUSD trading. I trade all sessions, so there should be no time restrictions. MY TRADING STYLE (Important
1. Project Overview Asset: XAUUSD (Gold) Timeframe: M1 (1-Minute) for execution; M5/M15 for trend filtering. Objective: Execute high-frequency scalps during peak liquidity (London/NY overlap) to capture 10–30 pip movements with high precision. Core Logic: The "Poverty Bot" strategy relies on Mean Reversion combined with Momentum Burst (Price Action + RSI/EMA filters). 2. Strategy Logic (The "Poverty"
Simple MA indicator with buy and sell arrow with a push notification. Conditions for buy or sell should be when price breaks above or below the MA and then retraced back to the MA creating a HH/HL or LH/LL then the buy/sell signal arrow should be at the reversal candle that forms the HL/HH. And on indicator window1 RSI cross over MA and the RSI line
I need any highly profitable robot which can trade small account like 50-100USD and any currency pair(s) The robot should avoid trading around news time and have good risk management. It should use any strategy which is profitable and not those unacceptable by brokers. Demo versions will be required before selection