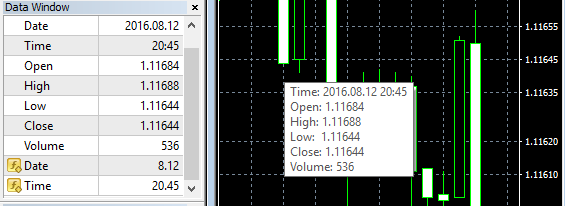
How to show a datetime in Data Window for my custom indicator?
double _Date[];
double _Time[];
//+------------------------------------------------------------------+
//| Custom indicator initialization function                         |
//+------------------------------------------------------------------+
int OnInit()
  {
//--- indicator buffers mapping
   SetIndexBuffer(0,_Date);
   SetIndexLabel(0,"Date");
   SetIndexBuffer(1,_Time);
   SetIndexLabel(1,"Time");
   IndicatorDigits(2);
//---
   return(INIT_SUCCEEDED);
  }
//+------------------------------------------------------------------+
//| Custom indicator iteration function                              |
//+------------------------------------------------------------------+
int OnCalculate(const int rates_total,
                const int prev_calculated,
                const datetime &time[],
                const double &open[],
                const double &high[],
                const double &low[],
                const double &close[],
                const long &tick_volume[],
                const long &volume[],
                const int &spread[])
  {
//---
   for(int i=rates_total-1;i>=0;i--)
     {
      int month=TimeMonth(time[i]);
      int day=TimeDay(time[i]);
      _Date[i]=month+day/100.0;
      int hour=TimeHour(time[i]);
      int minute=TimeMinute(time[i]);
      _Time[i]=hour+minute/100.0;
     }
//--- return value of prev_calculated for next call
   return(rates_total);
  }
MqlDateTime dt;
double _Date[];
double _Time[];
//+------------------------------------------------------------------+
//| Custom indicator initialization function                         |
//+------------------------------------------------------------------+
int OnInit()
  {
//--- indicator buffers mapping
   SetIndexBuffer(0,_Date);
   PlotIndexSetString(0,PLOT_LABEL,"Date");
   SetIndexBuffer(1,_Time);
   PlotIndexSetString(1,PLOT_LABEL,"Time");
   IndicatorSetInteger(INDICATOR_DIGITS,2);
//---
   return(INIT_SUCCEEDED);
  }
//+------------------------------------------------------------------+
//| Custom indicator iteration function                              |
//+------------------------------------------------------------------+
int OnCalculate(const int rates_total,
                const int prev_calculated,
                const datetime &time[],
                const double &open[],
                const double &high[],
                const double &low[],
                const double &close[],
                const long &tick_volume[],
                const long &volume[],
                const int &spread[])
  {
//---
   for(int i=rates_total-1;i>=0;i--)
     {
      TimeToStruct(time[i],dt);
      _Date[i]=dt.mon+dt.day/100.0;
      _Time[i]=dt.hour+dt.min/100.0;
     }
//--- return value of prev_calculated for next call
   return(rates_total);
  }
You are missing trading opportunities:
- Free trading apps
- Over 8,000 signals for copying
- Economic news for exploring financial markets
Registration
Log in
You agree to website policy and terms of use
If you do not have an account, please register
I would like to show a value of type datetime for my custom indicator.