ADX
Forum on trading, automated trading systems and testing trading strategies
Sergey Golubev, 2016.08.10 17:44
Average Directional Movement Index (ADX)
Developed by J. Welles Wilder
The ADX is a momentum indicator used to determine the strength of a price trend; it is derived from the DMI –Directional Movement Index which has two indicators
- +DI- Positive Directional indicator
- –DI - Negative Directional Indicator
ADX is calculated by subtracting these two values and applying a smoothing function, example a function of ten to come up with a 10 period ADX.
The ADX is not a directional indicator but a measure of the strength of the trend. The ADX has a scale of Zero -100.
- The higher the ADX value the stronger the trend.
- ADX value below 20 indicates that the market is not trending but moving in a range.
- ADX value above 20 confirms a buy or sell signal and indicates a new trend is emerging.
- ADX value above 30 signifies a strong trending market.
- When ADX value turns down from above 30, it signifies that the current trend is losing momentum.
ADX indicator combined with DMI- Directional Movement Index
- Since the ADX alone is a directionless indicator it is combined with the DMI index to determine the direction of the currency pair.
- When the ADX is combined with DMI index a trader can determine the direction of the trend and then use the ADX to determine the momentum of the forex trend.

Technical Analysis of ADX indicator
Buy Signal
- A buy signal is generated when the +DI is above –DI, and the ADX is above 20
- The Exit signal is generated when the ADX turns down from above 30.
- A short signal is generated when the –DI is above +DI, and the ADX is above 20
- The Exit signal is generated when the ADX turns down from above 30.
This lesson describes the ADX with the DI+ and DI- Directional Indicators, and also shows how they are commonly use
Forum on trading, automated trading systems and testing trading strategies
Sergey Golubev, 2016.06.26 07:07
How To Trade: ADX 50 trend trading strategy (adapted from the article)
Finding a strong directional move is the first priority of any trend trader. However, when having to select a currency pair to trade, it can be difficult to identify the best trends. For the ADX 50 strategy we will be using the ADX (Average Directional Index) indicator for this process. First, add a 14 period ADX to the 4Hour chart, using Daily periods.
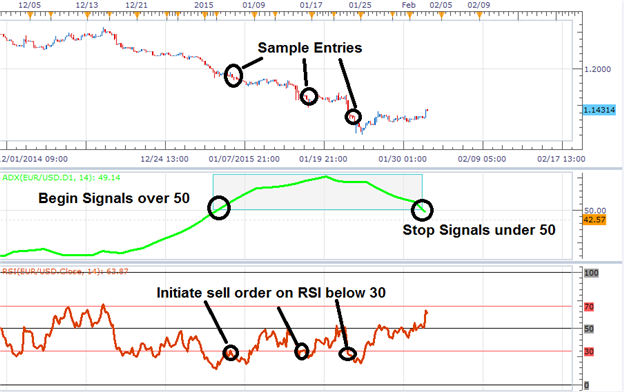
Remember, ADX is not identifying the direction of the trend, only its
intensity. If a currency pair’s trend is weak or if the pair is
consolidating, ADX will read significantly lower than a strong
directional market. For the ADX 50 strategy, we will only be looking
for currency pairs with an ADX value of over 50! If Daily ADX reads over
50, you can then begin to move to the execution phase of the strategy.
Once a strong trend is found, it is time to plan an entry into the
market. The ADX 50 trend trading strategy uses an RSI (Relative
Strength Index) indicator with a 14 period setting on a 4Hour chart.
Traders should always have a plan for managing their position. Eventually trends will come to an end and any existing trades should be exited. When initiating a buy order, stop orders should be placed at a 14 period low on the 4Hour chart. That way if a new low is created, all existing buy trades will be closed. Conversely if a trader is selling in a downtrend, stops can be placed at a 14 period high again using the 4Hour chart.
How To Trade - ADX indicator and How Does It Work
ADX indicator is used to determine the strength of the trend:
- +DI- Positive Directional indicator
- –DI - Negative Directional Indicator
You do need to know that:
- The +DI Line is representative of how strong or weak the uptrend in the market is.
- The –DI line is representative of how strong or weak the downtrend in the market is.
- As the ADX line is comprised of both the +DI Line and the –DI Line, it does not indicate whether the trend is up or down, but simply the strength of the overall trend in the market.
As the ADX Line is Non Directional, it does not tell you whether the market is in an uptrend or a downtrend (you must look to price or the +DI/-DI Lines for this) but simply how strong or weak the trend in the financial instrument you are analyzing is. When the ADX line is above 40 and rising this is indicative of a strong trend, and when the ADX line is below 20 and falling this is indicative of a ranging market.
So one of the first ways traders will use the ADX in their trading is as a confirmation of whether or not a financial instrument is trending, and to avoid choppy periods in the market where many find it harder to make money. In addition to a situation where the ADX line trending below 20, the developer of the indicator recommends not trading a trend based strategy when the ADX line is below both the +DI Line and the –DI Line.
- Free trading apps
- Over 8,000 signals for copying
- Economic news for exploring financial markets
You agree to website policy and terms of use
I want to have detailed description about ADX,how to read it and how it works,
is thinstead of this.ere any other indicatoe which can be used