2 indicators in one indicator window, how is their position calculated/modified so their range matches?
There are thousands of websites you can google to understand it better but in your example you would want a formula such as:
ScaledValue = (RSImax - RSImin)/(MomentumMax - MomentumMin)*(MomentumValue - MomentumMax) + RSImax
So in using your example again, RSImax=100, RSImin=0, MomentumMax=110, MomentumMin=90. Now lets say you have a momentum value of 105 that you want to normalize to the RSI scale of 0-100:
 ScaledMomentumValue = (100 - 0)/(110 - 90)*(105 - 110) + 100
                     = (100)/(20)*(-5)+100
                     = 75
Just a warning, it is possible to end up with a divide by zero error in MQL so you will need to build that check into your formula on the right side of the equation
Thank you!
One side of it is explain, now only one question remains.
How exaclty do I get the min/max value for Momentum if it is calculated the followings:
MOMENTUM = CLOSE(i)/CLOSE(i-N)*100source:https://www.metatrader5.com/en/terminal/help/indicators/oscillators/momentum

- www.metatrader5.com
Thank you!
One side of it is explain, now only one question remains.
How exaclty do I get the min/max value for Momentum if it is calculated the followings:
source:https://www.metatrader5.com/en/terminal/help/indicators/oscillators/momentum
If you have a data series that doesn't have a fixed min/max (like 0 to 100) then what you need to do is record the min/max over a certain period of bars. So for instance, the momentum indicator has a "Periods" parameter (the "N" in your formula above). So all you need to do is look for the min/max values over that period. Then recalculate N periods on the close of every candle to get the new min/max of that period.
Technically, when using that approach you then have a "sample" rather than a "population" so the scaling formula should be slightly different but to be honest, this approach should work just fine for what you are doing
- Free trading apps
- Over 8,000 signals for copying
- Economic news for exploring financial markets
You agree to website policy and terms of use
Hello!
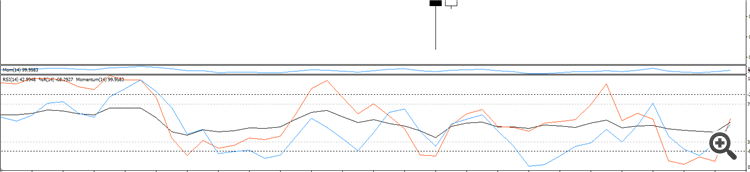
When you put 2 indicators in same indicator window what value ranges doesn't match then metatrader is making the graph still match.
rsi and wpr has the range between 0 to (-)100 what can easily be mapped in graph however momentum has a range from 90-110.
The reason why i'm trying to figure this out is because i wound interesting relationship between momentum and wpr but not in numbers, only in graph and I wanna make an ea out of it.
Any ideas of how the graph positions is calculated?
Thanks!