Brent Crude Oil Technical Analysis 2016, 24.07 - 31.07: daily breakdown; weekly bearish; 43.30 is the key support
Forum on trading, automated trading systems and testing trading strategies
Sergey Golubev, 2016.07.25 17:50
Opinion: Oil prices slide on oversupply (based on the article)
Morgan Stanley:
"The potential for larger-than-normal stock builds is growing. With the market increasingly trading on DOE (U.S. Department of Energy) stats, this could be a catalyst for additional downside. As a result, crude oil demand from refineries is underperforming product demand by a wide margin."
Barclays:
"Global oil demand in the third quarter of 2016
was expanding at less than a third of the year-earlier rate, weighed
down by anaemic economic growth. Demand support from developed economies had faded, while growth from China and India had slowed."
Energy Aspects:
"The oil market was beginning to show small signs of "normalcy" in supply-and-demand balances. Crude markets are slowly tightening and are now more resilient in the face of falling refinery demand for crude. We do not mean that the rebalancing is over, or
even close to being over, but nevertheless, we are now in a new market
paradigm where the steps towards normalcy begin."
Forum on trading, automated trading systems and testing trading strategies
Sergey Golubev, 2013.11.06 15:02
Dollar Index Futures & Correlations to Crude Oil & Gold Futures TradingLet's first discuss the basic correlation that traders use. There is a negative correlation between the DX and almost every other market that traders watch. The Dollar is negative to other currencies b/c it's the world reserve currency, and it's negative to commodities b/c of the simple laws of supply and demand. Let's focus on the correlation to Gold & Crude Oil Futures.
As traders, there are lots of different times in the day when the dollar begins to move more dramatically, such as the open of the US Markets @ 9:30am EST, before and after major news events such as Jobless Claims Reports or FOMC News. We look for the Dollar to begin its trend, and using the negative correlation between these markets, we look for crude oil & gold opportunities to the opposite of the dollar's trend. When the Dollar is trending, traders use Breakout Patterns to capitalize on this correlation. With the dollar rising, look for high-percentage entries to the short side of Gold or Crude Oil Futures.
Most traders will use the Dollar correlation as a filter because it allows them to avoid high-risk entries on Gold & Crude Oil Futures. Without a trend on Dollar, the Gold & Crude Oil Futures also show flat price action, and tend to reverse their current trends often. The dollar has a tendency to get very choppy during indecisive times in the market, and we tend to stay away from higher-risk trading on Crude Oil & Gold during these times.
Another important thing to watch on the Dollar is key Support & Resistance around simple chart patterns. For example, using a Head & Shoulders pattern on the Dollar, traders will avoid trading Gold & Crude Oil when the Dollar attempts to complete the trend reversal. Smart traders will wait to trade the reaction to the move around these extreme levels, rather than trying to be the first to enter the market when the Dollar here. In closing, the Dollar Index Futures can be used very effectively with a negative correlation with many of the market we love to trade. Of all the uses for this index, the most effective way most traders use the Dollar is as a filter, to avoid taking high-risk trades on other markets such as Crude Oil & Gold.
U.S. Commercial Crude Oil Inventories news event: bullish ranging above bearish reversal
2016-07-27 14:30 GMT | [USD - Crude Oil Inventories]
- past data is -2.3M
- forecast data is -2.1M
- actual data is 1.7M according to the latest press release
[USD - Crude Oil Inventories] = Change in the number of barrels of crude oil held in inventory by commercial firms during the past week.
==========
"U.S.
commercial crude oil inventories (excluding those in the Strategic
Petroleum Reserve) increased by 1.7 million barrels from the previous
week."
==========
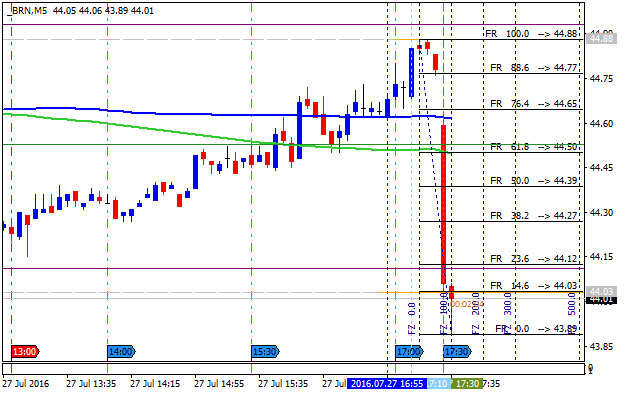
Crude Oil M5: bearish breakdown. The price broke 200 SMA for the breakdown to the bearish area of the chart: price broke 100 SMA/200 SMA for the primary bearish market condition with 43.89 support level as a nearest intra-day bearish target to re-enter.If the price breaks 44.65 resistance level so the reversal of the intra-day price movement from the primary bearish to the primary bullish market condition will be started.
If the price breaks 43.89 support so the intra-day primary bearish trend will be continuing.
If not so the price will be on ranging within the levels.
==========
Crude Oil Daily: correction to the bearish reversal.
The price broke 100 period SMA to below for the secondary ranging condition within the primary bearish trend. The price is breakdown for the ready to break 200-day SMA value at 42.46 to below for the reversal of the price movement to the primary bearish market condition.
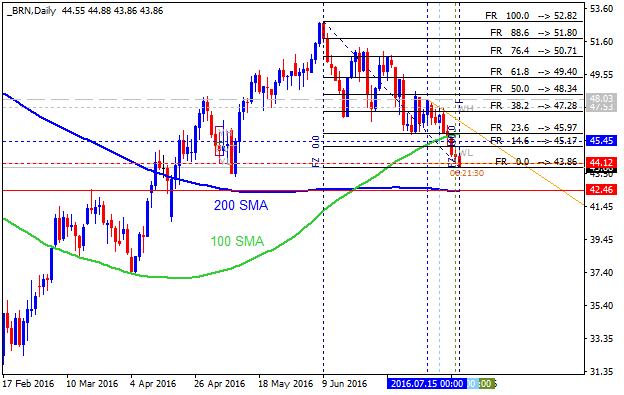
If the price breaks 50.0% Fibo resistance level at 48.34 to above on close daily bar so the primary bullish trend will be continuing.
if the price breaks 42.46
support level on close daily bar so the reversal of the price movement to the primary bearish market condition will be started.
If not so the price will be on ranging within the levels.
Forum on trading, automated trading systems and testing trading strategies
Sergey Golubev, 2016.07.29 09:01
Brent Crude Oil Technical Analysis - daily bearish with 42.54 key support (adapted from the article)
Daily price is on bearish market condition located below Ichimoku cloud: price is testing 42.54 support level to below for the bearish trend to be continuing. Alternative, if the price breaks 45.15 resistance level to above so the local uptrend as the bear market rally will be started, otherwise - ranging bearish.
- "Ichimoku Cloud is a trend following indicator that allows you to see the “big-picture trend” on the chart. If price (shown via candles), and the momentum line (bright green on my chart) are below the cloud, we are in a bearish environment. Buying against the momentum and trend is not advised because a downtrend tends to gather steam much like a snowball rolling down a mountain."
- "For now, we can use the bottom of the cloud, which aligns with the
100-DMA at $44.63/bbl as clear resistance. Until price breaks above this
level on a closing basis, higher prices should be viewed as more
favorable levels to enter a short position as opposed to buying low."
- "Significant support aligns at the 61.8% Fibonacci Retracement zone of the February-June zone, which is also the late-March low ~$35.81/bbl. While fighting a trend is not encouraged, that is a level to see if buyers begin to show up due to bargain prices."
Descending triangle pattern was formed by the price to be crossed to below for the bearish trend to be continuing.

- Recommendation for long: watch close D1 price to break 45.15 for possible buy trade
- Recommendation
to go short: watch D1 price to break 42.54 support level for possible sell trade
- Trading Summary: bearish
| Resistance | Support |
|---|---|
| 45.15 | 42.54 |
| 47.53 | N/A |
- Free trading apps
- Over 8,000 signals for copying
- Economic news for exploring financial markets
You agree to website policy and terms of use
Daily price broke Ichimoku cloud together with 'reversal' Senkou Span line to below for the bearish reversal. The price is testing 45.15 support level on open daily bar for the bearish breakdown to be continuing with 55-day low at 43.30 level as a nearest daily bearish target to re-enter.
If D1 price breaks 43.30 support level on close bar so the bearish trend will be continuing up to bottom to be formed.If D1 price breaks 48.19 resistance level on close bar from below to above so the reversal of the price movement to the primary bullish market condition will be started.
If D1 price breaks 51.21 resistance level on close bar from below to above so the price will be reversed to the primary bullish market condition with 52.82 nearest bullish target.
If not so the price will be on ranging bearish within the levels.
SUMMARY : bearish breakdown
TREND : bearish