Indicators: RSI HTF
Trading RSI (based on dailyfx article)
- The Relative Strength Index can be an extremely versatile indicator
- Like any other indicator, it will never be perfectly predictive
- Three ways of trading with RSI, using various approaches
Indicators can be dangerous.
The reason for this is simple: Indicators have no better chance of predicting the future with 100% accuracy than any of us as human beings do.
With technical analysis, that’s all we’re really doing: Looking at the past to get an idea as to how to best trade future price movements. Technical Analysis can help traders associate the probabilities of success; and indicators can help traders more easily identify high-probability setups.
One of the more universally accepted indicators is RSI, or the Relative Strength Index. This is often one of the first indicators that a trader learns; and after seeing that it doesn’t always work, RSI often becomes one of the first indicators that traders learn to ignore or forget about.
But RSI can offer traders quite a bit more than just what it can do by default. In this article, we’re going to look at three methods for trading RSI.
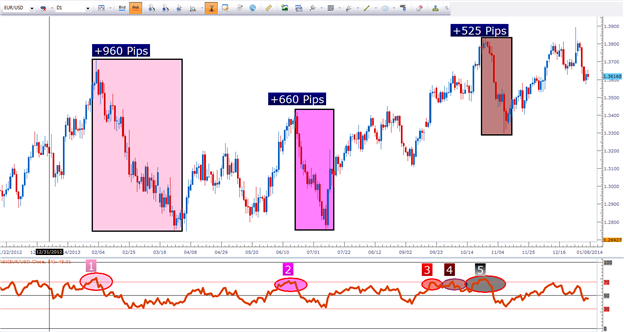
Method #1: Daily Chart with 1-to-2 Risk-to-Reward Ratio
The simplest way to trade with RSI can also be one of the more effective.
As an example, EURUSD had five RSI crosses on the daily chart in 2013, all of which were sell entries as RSI moved down and through 70. Each of these are identified and numbered on the chart below:
Method #2: Catching Reversals with RSI Divergence
RSI Divergence can be an extremely interesting way to trade with Relative Strength.
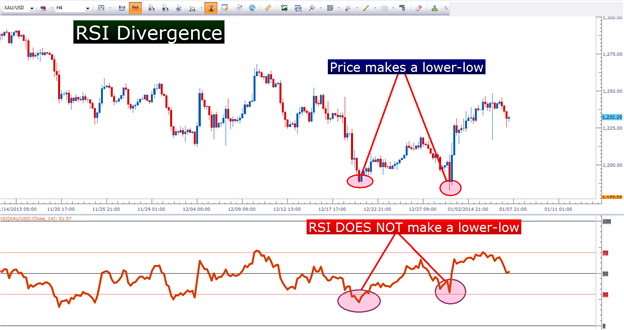
Key importance with RSI divergence is risk management; because if the trend does not reverse, the trade can be extremely costly as the trader sits in a counter-trend position.
Method #3: As a Trigger with a Longer-Term Trend Filter
Multiple Time Frame Analysis can bring considerable value to the technical trader; key of which is allowing the trader to assimilate price action from varying points of view.
Traders can look to the longer-term chart to get an idea for the general trend direction; and then look to enter on the shorter-term chart in consideration of the longer-term trend. The longer-term chart brings the luxury of allowing the trader to see the ‘bigger picture,’ while the shorter time frame allows the trader to get more granular with their entry and stop placement.

- Free trading apps
- Over 8,000 signals for copying
- Economic news for exploring financial markets
You agree to website policy and terms of use
RSI HTF:
Standard RSI that can be applied for a chart having a different timeframe.
Author: Nikolay Kositsin