Indicators: Point and Figure
Point & Figure Charting reduces the importance of time on a chart and instead focuses on price movements. Point & Figure charts are made up of X's and O's, X's being new highs and O's being new lows. There are two inputs to a Point & Figure chart:
- Box Size: The size of movement required to add an "X" or an "O". For example, a stock at a price of $20 may have a box size of $1. This means that an increase from $20.01 to a high of $21.34 means another "X" is added. If the high price only increased to $20.99, then another "X" is not added because the stock didn't close another box size ($1) more.
- Reversal Amount: The size of reversal before another column is added to a Point & Figure chart. To illustrate, if the reversal amount is $3, then the $20 stock would have to fall down to $17 before a new column (in this example of O's) would be started.
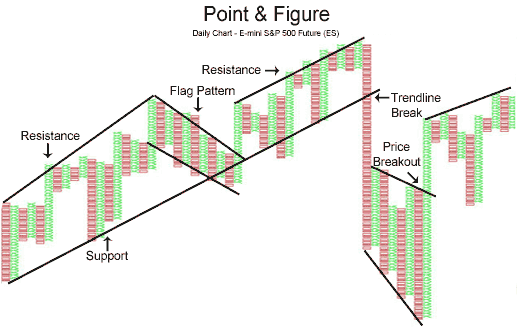
One of the main uses for Point & Figure charts, and the one emphasized in this section, is that Point & Figure charts make it easier for traders to see classic chart patterns. In the chart below of the E-mini S&P 500 Future, the Point & Figure chart emphasized support and resistance lines as well as areas of price breakouts:
Again, the Point & Figure chart makes it easy for traders to see the double bottom pattern below in the chart of the E-mini S&P 500 Futures contract:
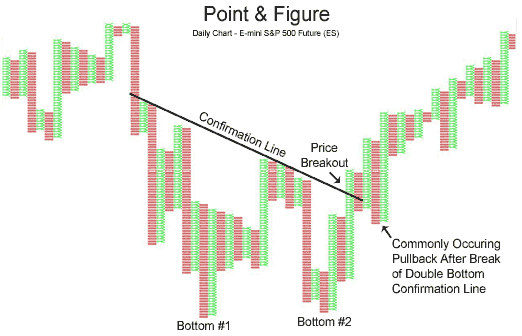
The e-mini chart above illustrates the two bottoms of the double bottom pattern, as well as the confirmation line that is pierced, resulting in a buying opportunity.
Point & Figure is a very unique way to plot market action. The strongsuit of Point & Figure charting is that it eliminates the element of time and focuses on what is truly important - pricePoint & Figure Part I (based on dailyfx article)
- The History of Point & Figure Charts
- Why Traders Use Point & Figure Charts
- The Construction of Point & Figure Charts
The History of Point & Figure Charts
Unlike other charting methods, there is no one person credited for creating Point & Figure charts. Before computers, Point & Figures were adapted from a method used by floor traders in the 19th and pre-computer 20th century. The basic premise that caused P&F to be born is that there needed to be a simple method for floor traders to record price action to analyze price without unnecessary noise. Over a handful of years, two charts converged into one type of chart known as Point & Figure Charts.
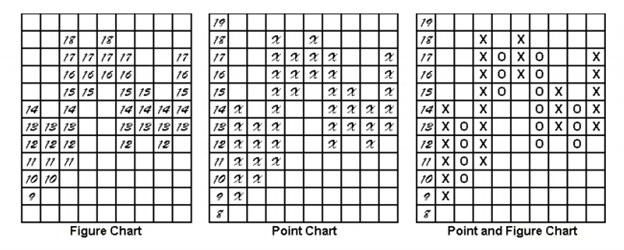
To make sense of the far-right chart above, it may be helpful to know what creates a new column which will be explained in detail later in the article. The chart on the right requires a reversal of 3 boxes of $1 each or $3 move against the prior trend to print a new column. As you can see, instead of price being printed, a column of X’s or O’s will occupy the chart.
The first method on the left was simply recording prices up and down without fractions which, you can imagine would become mind-numbing overtime. To make analysis less tedious and thus trading easier, a point chart above was constructed with price marked once on the y-axis and then marked an “X” or “point” for either direction when any whole figure was crosses. The Forex equivalent of this would be an Average True Range equivalent or 1XATR or 100 Pips.
Why Traders Use Point & Figure Charts
Due to technology, Point & Figure charts have fallen out of favor due to the likely fact that Point & Figure charts do not update in real-time, for a reason you’ll soon learn, and they may not appear as exciting as a short-term scalping chart. Point & Figure charts do not utilize time but only price. Therefore, you will not see a new candle print because there is a new day or time period like you do with candlestick charts. If price has not reversed or broken out from your predetermined levels discussed below, then there will be no change to the chart. In other words, the Point & Figure charts are famously objective.
The Construction of Point & Figure Charts
Constructing the Point & Figure chart takes some decisions on your part that we’ll discuss shortly. Another great advantage to Point & Figure charts as you’ll see is that you have control over how much action you see.
There are 3 main components that will be needed to construct a Point & Figure charts. The components are:
- Reversal Size Parameter
- Box Size Parameter
- Price Data used for Chart Construction
Once these three components are determined, you will come up with a specific name for your Point & Figure chart like a 10X3 chart or 1ATRX3 chart for example. This name type comes from Box size X Reversal. Also, please note that higher prices will be marked by X’s and O’s for down-columns.
The reversal size will determine how sensitive your charts are. This will be determined by how many X’s or O’s the price must reverse before changing columns. The most common choices are 1-box reversals and 3-box reversals. A 3-box reversal chart will require 3x the amount of price action against the prior trend before reversing than a 1-box reversal.
Closing Thoughts
Today’s introduction to Point & Figure opens up an exciting avenue of analysis for your trading. It may be helpful for you to see Point & Figure as a new objective way of identifying price action but not necessarily a chart that you will enter trades on.
- Tyler Yell
- www.dailyfx.com
(taken from my turkey).
input int BrickSize =10; //Brick Size
input bool TotalBars = false; //Use full history

int BarsCount = 500; //Count of bars

// total count of bars
int total = Bars(_Symbol,PERIOD_M1);


//--- optimal bars count ------
if (TotalBars == true)
    BarsCount = total;
else if(brickSize > 1)
     {
      BarsCount = (int)BarsCount * (int)brickSize;
     }
- Free trading apps
- Over 8,000 signals for copying
- Economic news for exploring financial markets
You agree to website policy and terms of use
Point and Figure:
Point and Figure indicator shown in bars and displayed in the separate window.
Author: Alexey Sergeev