XAU Against USD - Discussions
From a multi-timeframe multi-indicator perspective:
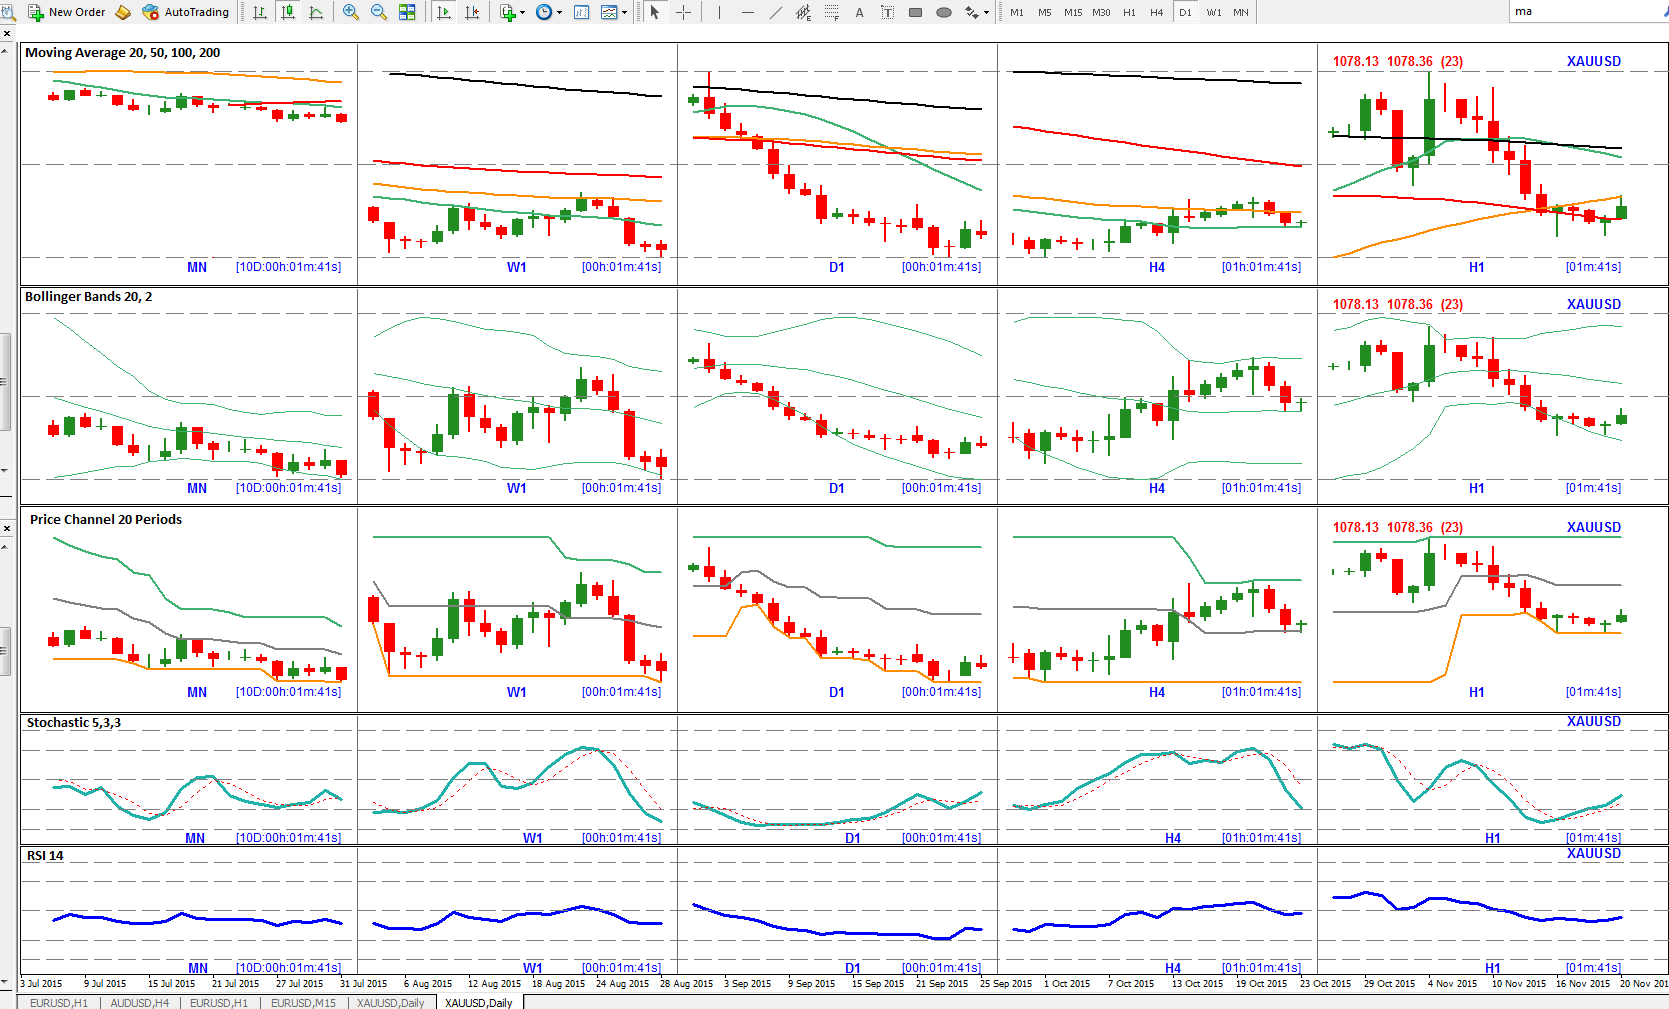
MA's: All timeframes show down trend still intact. There is some room for movement up to ~ 1105 though price is currently sitting below solid resistance around 1080/90 from July / August so would need to break through that first
Bollingers: Hugging the Monthly and Weekly lower bands. Bit of a squeeze on the Monthly. Daily mid point hanging around the 1105 level giving confluence with the MA that there is room to move to this level. Lower Daily band @ 1040 so lots of room to move down
Price Channels: Monthly and Weekly price flirting with downward price breakouts and confirming general downward trend. Daily showing that 1105 area as a large resistance zone from September/October. Daily also showing a lovely downward step but would like to see the Daily break below 1060 for another downward break.
Stochastics: Not a lot of action except for a bearish diversion forming on the Daily. If price continues to move up into the 1105 zone, this divergence could be eliminated.
RSI: Also showing bearish divergence on the Daily
From a multi-timeframe multi-indicator perspective:
MA's: All timeframes show down trend still intact. There is some room for movement up to ~ 1105 though price is currently sitting below solid resistance around 1080/90 from July / August so would need to break through that first
Bollingers: Hugging the Monthly and Weekly lower bands. Bit of a squeeze on the Monthly. Daily mid point hanging around the 1105 level giving confluence with the MA that there is room to move to this level. Lower Daily band @ 1040 so lots of room to move down
Price Channels: Monthly and Weekly price flirting with downward price breakouts and confirming general downward trend. Daily showing that 1105 area as a large resistance zone from September/October. Daily also showing a lovely downward step but would like to see the Daily break below 1060 for another downward break.
Stochastics: Not a lot of action except for a bearish diversion forming on the Daily. If price continues to move up into the 1105 zone, this divergence could be eliminated.
RSI: Also showing bearish divergence on the Daily
THANKS WITH APPRECIATE FOR YOUR REPLY :), SO MY DEAR WHAT YOU THINK AM I RIGHT?
I'd never try to give an exact prediction. But from a probability perspective, at this stage, some near term ranging with an initial upward bias, then on further confirmation, a break lower. But the picture changes every minute. What's true today may not be true tomorrow :)
- Free trading apps
- Over 8,000 signals for copying
- Economic news for exploring financial markets
You agree to website policy and terms of use
Hi Freinds,
We are here for some live discussion so now the topic as per subject I am pasting an chart image where my indicators telling me some position a per daily trade. Please look at chart. As per gray indication recently reverse fro over sold condition and after reverse again going to south position as red indicator indicates at 1187. As per my review I am expecting more South but its limited
What is your opinion? Idea? Please share your reviews and correct me If I am wrong
Thanking You All