I am not sure how you get to these 'statistical' values you speak of.
If you analyze a 100 Bars you will find the following:
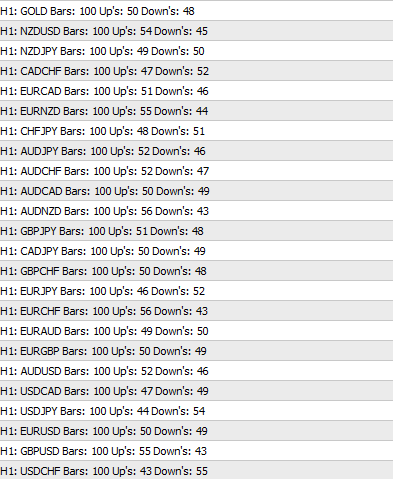
This shows that in most cases, the chance of you picking a winning trade is always around 50%.
So suppose you are trading blindfolded by just hitting the buy and sell buttons at any given time without looking, you will always be right 50% of the time.
Also, next to you is sitting supposedly the 'pro' trader who is using all his technical indicator library to his advantage to accurately try to 'predict' the future, which is impossible, will also be correct 50% of the time.
This is a fixed number, nothing can change it, anything can happen at all times.
So, it's not about how or when you enter the market, it is about how many times you enter, and how you play it out.
Forum on trading, automated trading systems and testing trading strategies
Food for thought and brainstorming
Simon Gniadkowski, 2013.03.14 23:13
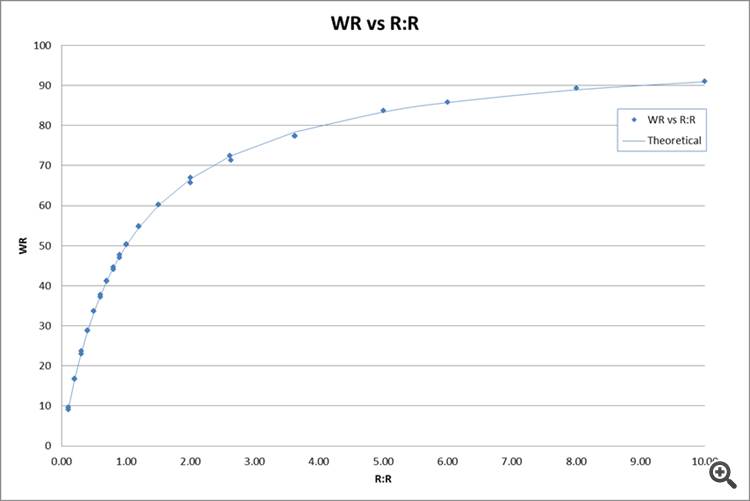
Take a look at this chart, it shows the relation between Win rate (WR) and Risk:Reward (R:R), in this case the spread was 0 and uses a simulated coin toss with an even number of Long and Short trades taken at random with no attempt to predict the direction of the market. You will see for a 50:50 R:R scenario the WR is 50%.
You said TP and SL are 40 pips, did you mean 40 pips or 40 points ? Yo need a figure that is at last 10 times the spread or the spread will play a big part in your results.
This is exactly what I was saying about statistical point of view.
Just to give you some idea of what I mean by the statical point of view and using this graphs, for SL/TP = 10, you have 90% of chance of winning whereas if you SL/TP = 1, you have 50% chance of winning (just according to this graph).
Also what we don't take consideration here is real life scenario where price moves in zig zag where pure statistical calculation is difficult to handle.
Interesting graph though.
I am not sure how you get to these 'statistical' values you speak of.
If you analyze a 100 Bars you will find the following:
This shows that in most cases, the chance of you picking a winning trade is always around 50%.
So suppose you are trading blindfolded by just hitting the buy and sell buttons at any given time without looking, you will always be right 50% of the time.
Also, next to you is sitting supposedly the 'pro' trader who is using all his technical indicator library to his advantage to accurately try to 'predict' the future, which is impossible, will also be correct 50% of the time.
This is a fixed number, nothing can change it, anything can happen at all times.
So, it's not about how or when you enter the market, it is about how many times you enter, and how you play it out.
You are very correct. However, most of time, with tight or small stop loss, we are punished by many successive loss and most of traders are quite scared of this mentally. This is probably why some scalping EA is quite popular even if some catastrophic result is waiting for it in the future.
I am just spicing up on your comments with some real world scenario. :)
Here i have another one for you:
Expectations vs Prediction.
It is very easy to calculate how many times a specific event took place in a certain time span.
Then, you can just wait for it to happen here is an example:
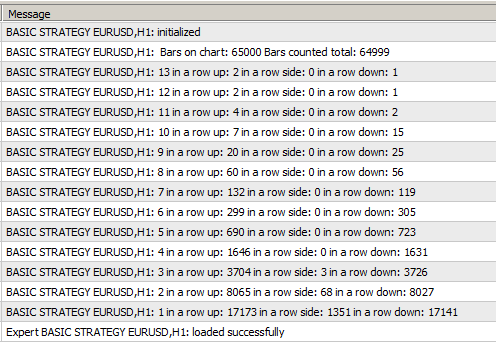
So beside the 50% chance of hitting a correct direction, there are also events that happen on a regular basis like for example, more bars in a row one after another.
If we put this in a chart it looks something like this:

So now we can calculate what i call the "trading bandwidth" as you can see on the chart, in 65000 bars we only had one occasion of 15 bars in a row, so this specific event has a low expectation value.
But on the other hand you can see we had 7,652 events of four bars in a row, in the same direction.
This means it is possible to calculate when and how often these events are expected to happen this is not the same as prediction, which is impossible.

You can think of the bars in a row having an axis and the time also has an axis so you can calculate the boundaries to trade in between.
Certainly 15 in a row is possible but i am not expecting it soon and so i am not betting on it.
Then there are also the volume axis and the spread axis.
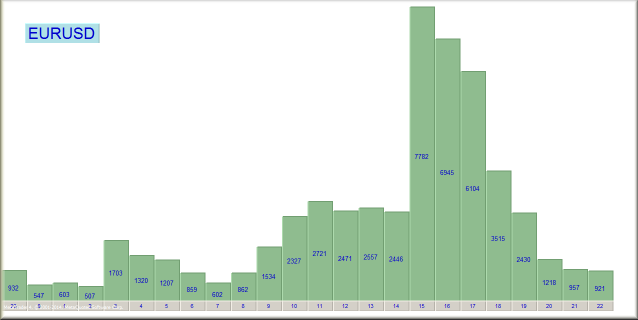
You might have more trades on the fastest moving pair,
And more chance by trading only the the pairs that got the lower spreads.
It's like cooking a good soup, really.
A lot of ingredients go into the soup, a lot of heat, cooking time is important, a little bit of spread, a lot of volume, everything has to be optimized to maximize the quality of your soup.
Then there are also things like for example hedging which can be used to either maximize your profits, or to diversify risk, by staying "virtually flat".
Do you want your soup to be spicy, you drop in some more risk.
Or maybe you want your soup to be safe, and keep it neutral most of the time ?, only taking a sip, occasionally..
As you can see, there is still hope.
About the punishment you speak of, this is simply a result of setting things too close, fear comes to mind..
I is quite easy to calculate maximum risk.
So, in essence you have to calculate how hard you not want to but how hard you CAN get get hit, before the game is over, and this is one of the most important calculations to be made.
There are also those who claim you should only trade with the trend and never against it, which i think is one of the most stupid things i ever heard, it is literally like saying once you enter a trade in the direction of the trend it will continue in that direction forever!! it will not and it can not !!
Here is a chart which clearly shows what i mean.
In a live environment all these elements are moving, shifting the most valued pair to the left, spreads up and down and etc.
You will know exactly when and where to get some soup.
Here i have another one for you:
Expectations vs Prediction.
It is very easy to calculate how many times a specific event took place in a certain time span.
Then, you can just wait for it to happen here is an example:
So beside the 50% chance of hitting a correct direction, there are also events that happen on a regular basis like for example, more bars in a row one after another.
If we put this in a chart it looks something like this:
So now we can calculate what i call the "trading bandwidth" as you can see on the chart, in 65000 bars we only had one occasion of 15 bars in a row, so this specific event has a low expectation value.
But on the other hand you can see we had 7,652 events of four bars in a row, in the same direction.
This means it is possible to calculate when and how often these events are expected to happen this is not the same as prediction, which is impossible.
You can think of the bars in a row having an axis and the time also has an axis so you can calculate the boundaries to trade in between.
Certainly 15 in a row is possible but i am not expecting it soon and so i am not betting on it.
Then there are also the volume axis and the spread axis.
You might have more trades on the fastest moving pair,
And more chance by trading only the the pairs that got the lower spreads.
It's like cooking a good soup, really.
A lot of ingredients go into the soup, a lot of heat, cooking time is important, a little bit of spread, a lot of volume, everything has to be optimized to maximize the quality of your soup.
Then there are also things like for example hedging which can be used to either maximize your profits, or to diversify risk, by staying "virtually flat".
Do you want your soup to be spicy, you drop in some more risk.
Or maybe you want your soup to be safe, and keep it neutral most of the time ?, only taking a sip, occasionally..
As you can see, there is still hope.
About the punishment you speak of, this is simply a result of setting things too close, fear comes to mind..
I is quite easy to calculate maximum risk.
So, in essence you have to calculate how hard you not want to but how hard you CAN get get hit, before the game is over, and this is one of the most important calculations to be made.
There are also those who claim you should only trade with the trend and never against it, which i think is one of the most stupid things i ever heard, it is literally like saying once you enter a trade in the direction of the trend it will continue in that direction forever!! it will not and it can not !!
Here is a chart which clearly shows what i mean.
In a live environment all these elements are moving, shifting the most valued pair to the left, spreads up and down and etc.
You will know exactly when and where to get some soup.
Hi. My friends.
Very good presentation. I am really impressed.
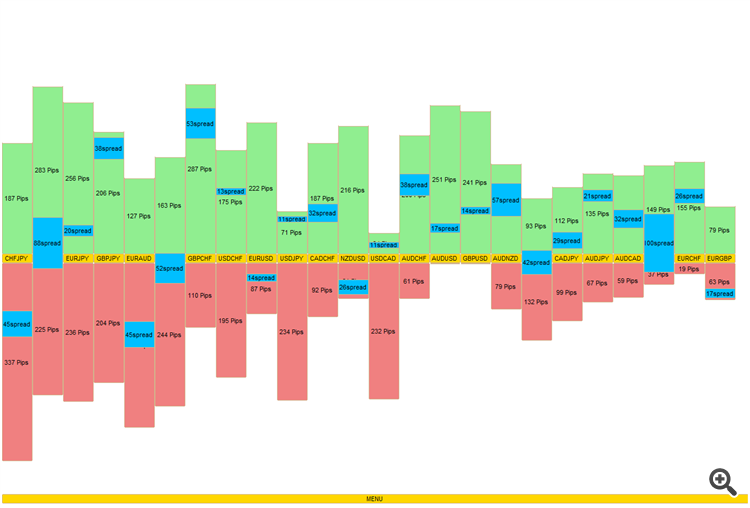
Can you explain bit more about this graphs? What are the greens and reds? Why blue spread box is not in the middle always?
Very impressive chart though. Ha ha.
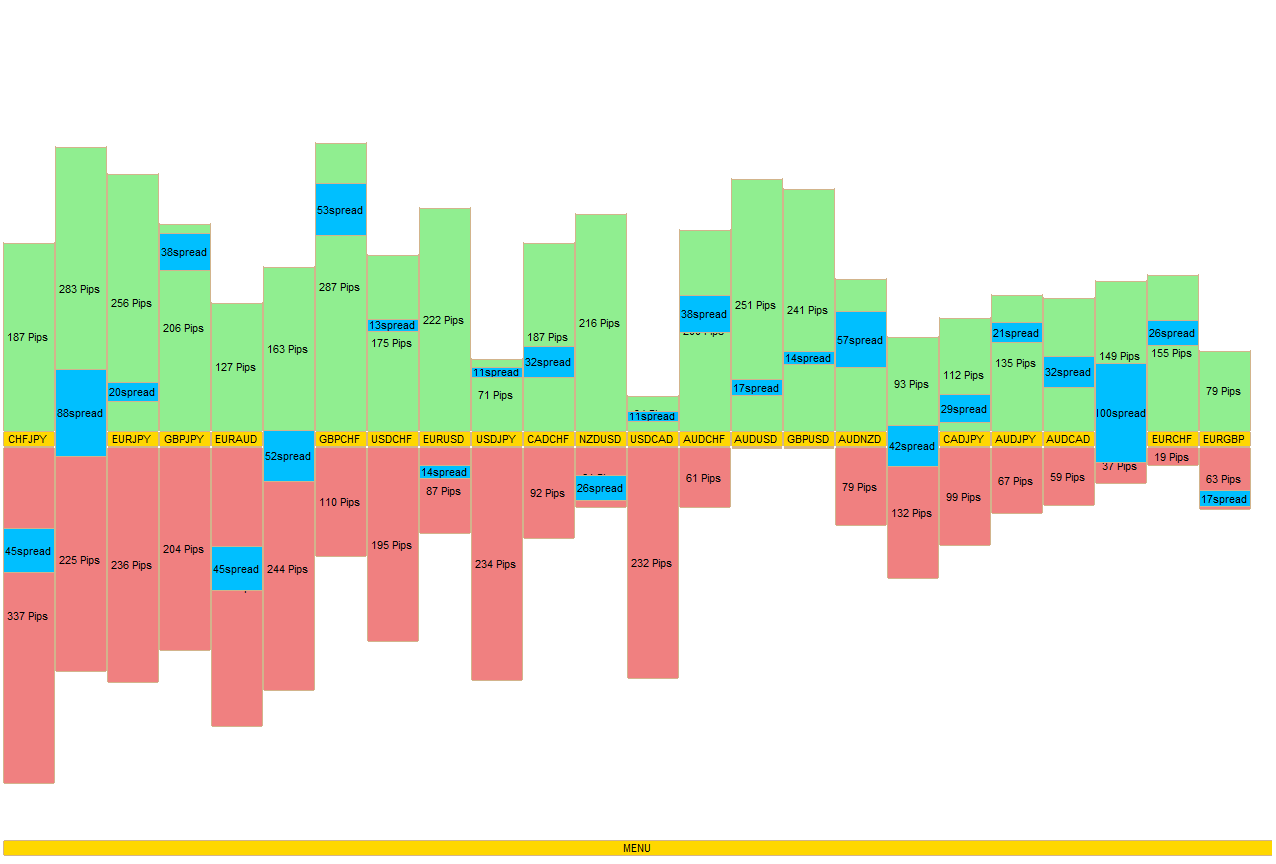
It's a OHLS multi chart.
It's a OHLS multi chart.
It's a OHLS multi chart.
- Free trading apps
- Over 8,000 signals for copying
- Economic news for exploring financial markets
You agree to website policy and terms of use

Hi. Traders.
Lately I have an interesting question in regards to Risk Reward Ratio.
Text book will suggest to keep Risk Reward ratio (take profit /stop loss) > 1.0 often for your trading.
One thing I am struck with at the moment is statistical thinking.
If your take profit is greater than stop loss, of course it is harder to hit. So statistically you will have more losing trades than winning trades (low success rate).
On the other hands, if your take profit is smaller than stop loss, it is easier to hit. So statistically you will have more winning trades than losing trades (high success rate).
After this statistical justification, is there any reason still Risk Reward ratio (Take profit/ stop loss) 2:1 is preferred over Risk Reward ratio (take profit/ stop loss) 1:1 ?
Please share your thought. I am really interested in to hearing different view.
Kind regards.