Optimisation results.
 darker green with lower results.
Dark green is a better value then light green. But again it is a better value relative to the other values of the same category. The result column shows the cumulative color.
It says nothing, zero, nada about stability. Stability you check with out of sample.
Dark green is a better value then light green. But again it is a better value relative to the other values of the same category. The result column shows the cumulative color.
It says nothing, zero, nada about stability. Stability you check with out of sample.
I'm familiar with the robust checks however the results tab is something I'm looking into more. realistically i should be looking into the darker green only to run my robust checks you recommend?
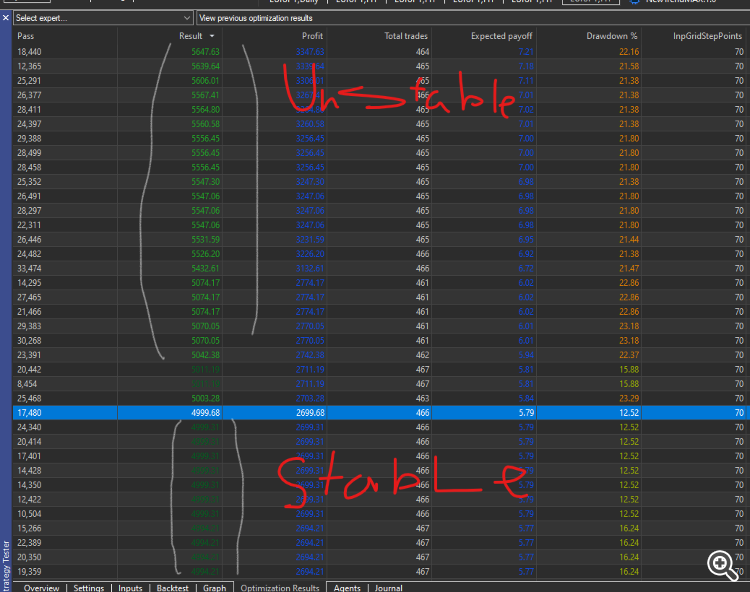
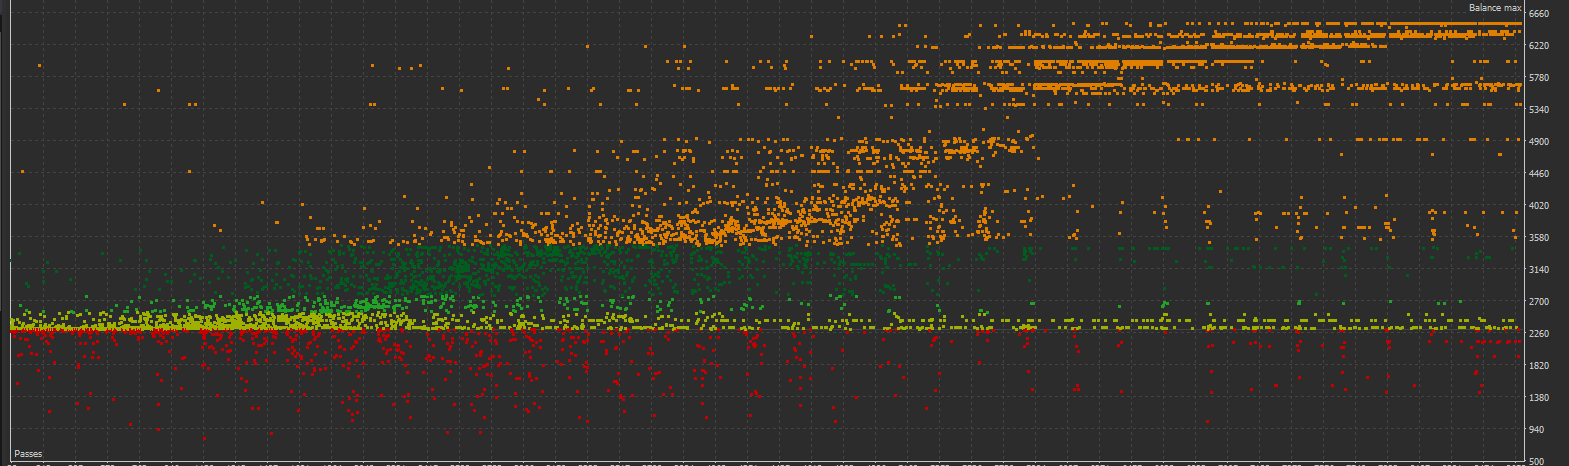
Okay here is the real question for those using optimsiation feature on MT5. I optimise with "1 minute OHLC" to get my results in qucik and cheap. then i select one of the result to run the test again this time with "Every tick based on real ticks". i get 100% data but here is the catch. I optimise with balance max and at the top we have the most profit made but the colour code on the top result is amber or light green, then going down the list we see solid green results. even though the profit is less. now when i pick the amber result to test with "real ticks" the results fail. then when i pick the solid green result and test with real ticks, its more stable. My Question is does the colour code in the results show which test or result is more stable regardless of the rank its in? look at these images.
The color depicts a "goodness" estimation according to the built-in complex criterion, provided by MQ and its formula is not disclosed.
I think the formula is engineered (meta-optimized on many strategies, in a sense) by MQ to provide more stable results that what you get when use a simple estimation criterion, such as a balance, profit factor or sharpe ratio.
- Free trading apps
- Over 8,000 signals for copying
- Economic news for exploring financial markets
You agree to website policy and terms of use
Okay here is the real question for those using optimsiation feature on MT5. I optimise with "1 minute OHLC" to get my results in qucik and cheap. then i select one of the result to run the test again this time with "Every tick based on real ticks". i get 100% data but here is the catch. I optimise with balance max and at the top we have the most profit made but the colour code on the top result is amber or light green, then going down the list we see solid green results. even though the profit is less. now when i pick the amber result to test with "real ticks" the results fail. then when i pick the solid green result and test with real ticks, its more stable. My Question is does the colour code in the results show which test or result is more stable regardless of the rank its in? look at these images.