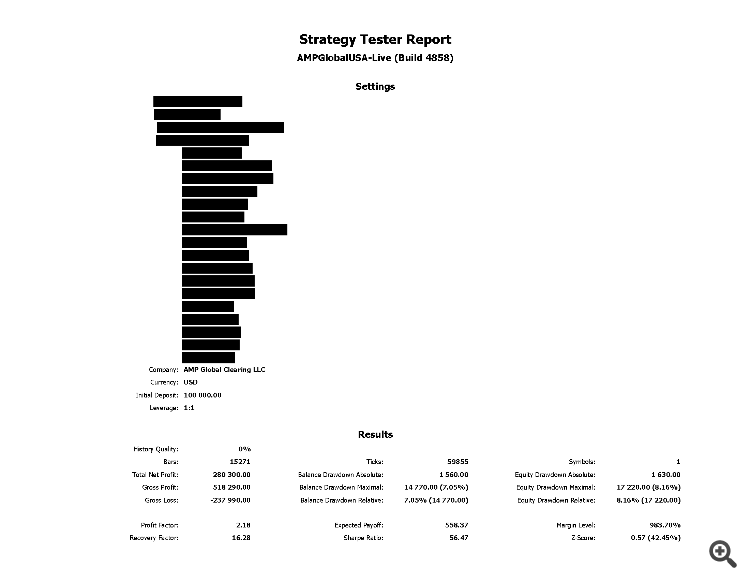
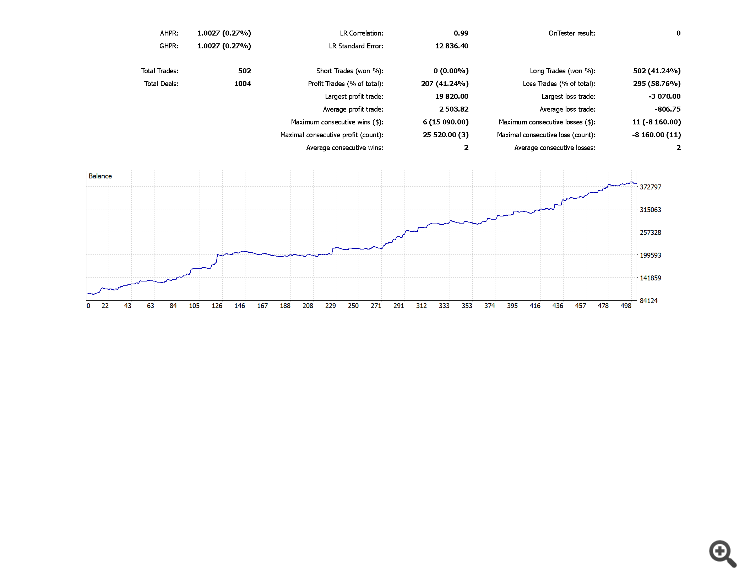
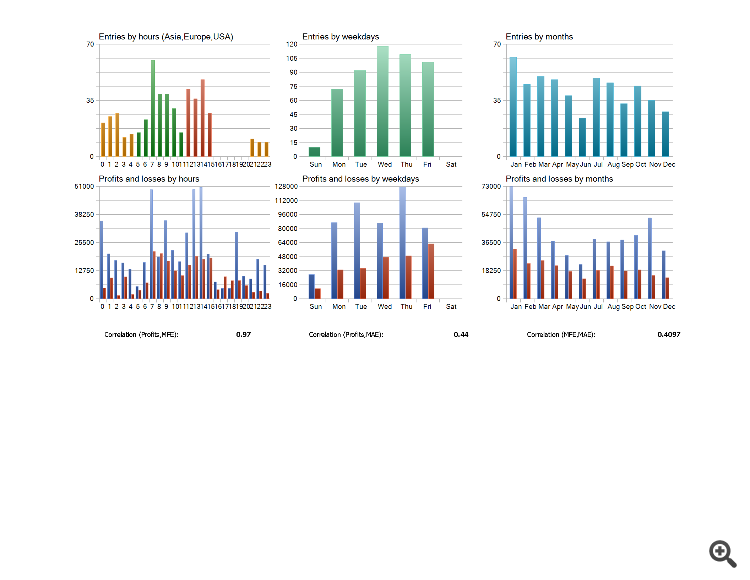
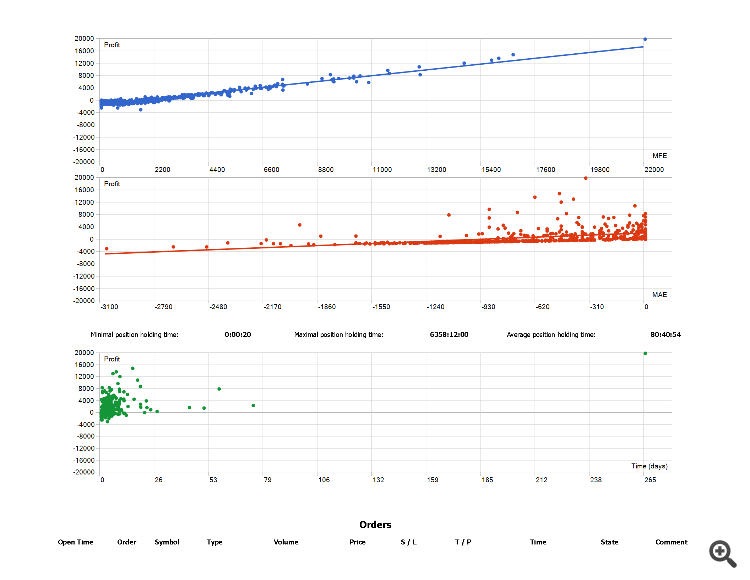
Hey traders 👋
I’ve been thinking a lot lately about how much we rely on indicators in our trading strategies—RSI, MACD, Bollinger Bands, Moving Averages, and the list goes on...
Some say indicators are essential tools for analyzing market behavior and timing entries/exits. Others argue they lag behind price action, create noise, and often lead to overcomplicated strategies.
So I wanted to start an open discussion here:
🔹 Do you actively use indicators in your trading?
🔹 Which ones do you find most reliable or profitable?
🔹 Have you ever found success with pure price action instead?
🔹 Can indicators work as standalone strategies, or should they always be combined with other tools?
Let’s hear your experiences and opinions. Whether you’re new or experienced, I’d love to know how indicators fit into your trading toolbox—or if they do at all.
Unless we're trying to front-run the market by using the order book and/or news events, technical indicators seem to be all that we have. And yes, indicators inherently rely upon data which already exists so in that sense, they lag. Even if we have a "leading" indicator, it still relies upon historic data in order make its predictions.
2 or 3 indicators are all that the average trader needs. But I digress... Let's actually begin with eliminating noise. If we're entering and exiting the market based purely on bar close, then why are we looking at candle wicks on a chart? Get rid of the wicks. Still too noisey? Consider a different chart structure, e.g., Renko bricks, range bars, etc. Remember, the goal is to make the price runs as straight, lengthy, and repetitive as possible. Ours eyes, brains, and indicators will appreciate this. I recommend running through the Fibonacci Sequence for brick/bar sizes to experiment with. When the price runs in the chart become glaringly obvious, we'll know that we have the right brick/bar size.
For indicators, 2 moving averages (let's say, EMA's) and 1 oscillator should do (let's say, the MACD). This isn't exactly rocket science, but merely more experimentation. If an EMA 8 and an EMA 21 don't work well, try an EMA 13 and an EMA 34 (Fibo's again). Rinse and repeat as necessary. I don't recommend messing with the MACD settings. It's rather universal as-is. Some things to analyze: (1) the slopes of the EMA's (up, down, or flat), (2) the positions of the EMA's and price (in relation to each other), and (3) the position of the MACD line(s) in relation to its zero level.
Remember that price history drawn in a chart format is really just an indicator in and of itself. A time-based chart structure is merely one type of indicator, while Renko and range chart structures are other types of indicators. The most basic form or price data would be a bare ticker tape. If we're trading "naked price action" in the form of price bars on a chart, we're trading an indicator.
There are no magic indicators. Combinations of 2 or 3 indicators can identify statistically profitable patterns that repeat over time. Although this seems simple on its face, 90% of traders never reach this point. It requires persistence and time, but can be expedited by way of programming, backtesting, and optimizing.
The best strategy is the one that we devise, ourselves, and that no one else has.😉
Sure! here’s a tight, pro-level summary for a chart comment:
Keep it clean: remove wicks if not using them. Try Renko/range bars for smoother trends. Use EMA 13 & 34 + MACD for clarity. Focus on slope, position, momentum. Price is the main indicator — keep tools minimal and consistent. Simple wins.
I use 1 indicator on chart and I make money, I have friend who uses 7 indicators on chart and he makes money too, I know a girl who uses no indicator at all and she makes money too.
Indicator is the tool, whether the tool is used effective depend on the person who use them.
- Free trading apps
- Over 8,000 signals for copying
- Economic news for exploring financial markets
You agree to website policy and terms of use


Hey traders 👋
I’ve been thinking a lot lately about how much we rely on indicators in our trading strategies—RSI, MACD, Bollinger Bands, Moving Averages, and the list goes on...
Some say indicators are essential tools for analyzing market behavior and timing entries/exits. Others argue they lag behind price action, create noise, and often lead to overcomplicated strategies.
So I wanted to start an open discussion here:
🔹 Do you actively use indicators in your trading?
🔹 Which ones do you find most reliable or profitable?
🔹 Have you ever found success with pure price action instead?
🔹 Can indicators work as standalone strategies, or should they always be combined with other tools?
Let’s hear your experiences and opinions. Whether you’re new or experienced, I’d love to know how indicators fit into your trading toolbox—or if they do at all.