Discussing the article: "From Novice to Expert: Support and Resistance Strength Indicator (SRSI)"
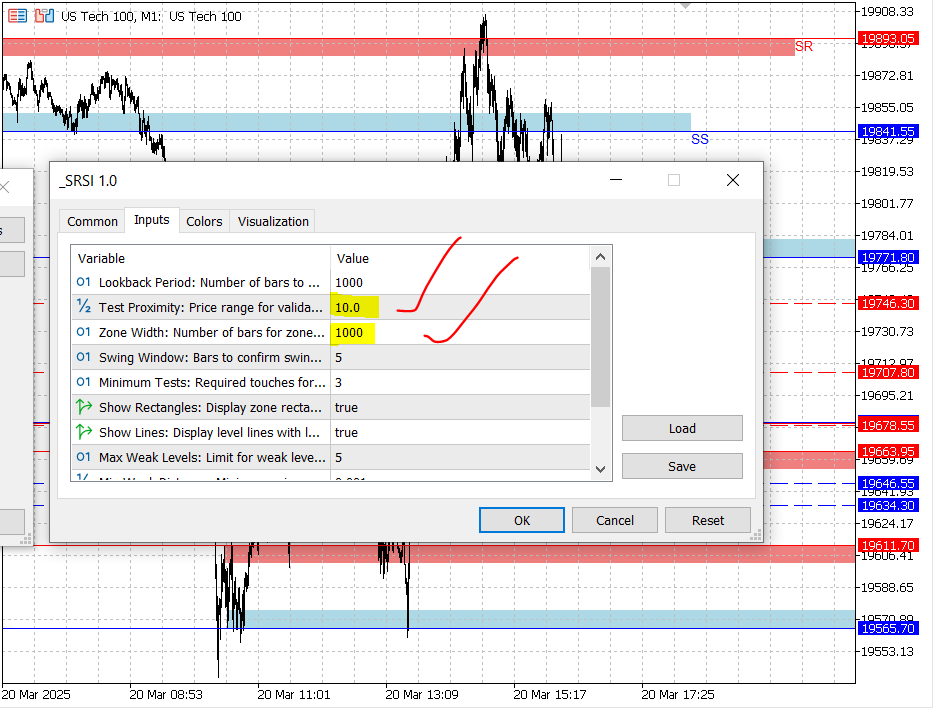
I really like your article and tried it on FX pairs which seem to work well... How about Indexes like US30? what are the setting would you recommend? i tried setting the text proximity to 0.035 and the results seems funny
Thank you!
Thank you!
Hello Friend
I am following your articles and they are informative. Thanks for sharing and spreading knowledge.
I have tried 21Period ATR multiple as below:
gTestProximity = (MathMax((75/_Digits),0.10*getATR(rates_total - 1))); // (n*getATR(index) replaced for ...InpTextProximity;
gMinDistance = (MathMax((150/_Digits),0.20*getATR(rates_total - 1))); // (n*getATR(index) replaced for ...InpMinWeakDistance;
This helped me getting SRZones for both EURUSD and XAUUSD pairs with quite difference in there values 1.08000 to 3000.00.
May be useful for the readers of your article with further fine tuning a little bit. Then the indicator settings could be universal for most of symbols.
Hi, my good friend @Anil Varma.
Thank you for sharing this unique approach! I’ll definitely give it a try.
Hello Friend
I am following your articles and they are informative. Thanks for sharing and spreading knowledge.
I have tried 21Period ATR multiple as below:
gTestProximity = (MathMax((75/_Digits),0.10*getATR(rates_total - 1))); // (n*getATR(index) replaced for ...InpTextProximity;
gMinDistance = (MathMax((150/_Digits),0.20*getATR(rates_total - 1))); // (n*getATR(index) replaced for ...InpMinWeakDistance;
This helped me getting SRZones for both EURUSD and XAUUSD pairs with quite difference in there values 1.08000 to 3000.00.
May be useful for the readers of your article with further fine tuning a little bit. Then the indicator settings could be universal for most of symbols.
Could you share your version of the ATR indicator?
First sorry for replying too late, actually I have diverted my attention to Quant Financial Modeling course.
Secondly I did not created any indicator for myself, just tried Clemence Benjamin indicator code with the tweak suggested in my post.
Hope this helps you out.

- Free trading apps
- Over 8,000 signals for copying
- Economic news for exploring financial markets
You agree to website policy and terms of use
Check out the new article: From Novice to Expert: Support and Resistance Strength Indicator (SRSI).
In this article, we will share insights on how to leverage MQL5 programming to pinpoint market levels—differentiating between weaker and strongest price levels. We will fully develop a working, Support and Resistance Strength Indicator (SRSI).
I began my analysis with a synthetic pair under Volatility Indices—Volatility 75 (1s) Index—on the weekly timeframe. When this pair was introduced around 2020, it was initially expensive but soon experienced a prolonged crash, forming a strong downtrend for weeks. Traders who shorted the pair during that period likely made significant profits. However, my primary focus is on market structure, particularly over the past three years.
The sustained downtrend likely conditioned traders to adopt a trend-following mindset, expecting further declines. However, as shown in the image below, the market dynamics have shifted. The higher timeframe now exhibits a choppy ranging structure, with similar characteristics observed in lower timeframes. Such conditions make it difficult for swing traders to navigate effectively.
In these circumstances, price action based on support and resistance becomes crucial for identifying key trading opportunities. The image below illustrates this market behavior, reinforcing the importance of a structured approach to technical analysis.
Author: Clemence Benjamin