Discussing the article: "Deconstructing examples of trading strategies in the client terminal"
Hi Artem, it's a pity there are no test results of these strategies. Is there really a grain of usefulness in the patterns?
For sure there is, if you use the indicator as a plug-in instead of describing all the work yourself (it will be better to try it out).
I still haven't described the work of the indicators I need in the best way. Consumption is low.
I'm sure there is, if you use the indicator as a plug-in instead of describing all the work yourself (it's better to try it out).
I still haven't described the operation of the indicators I need in the best way. Consumption is low.
When I used to talk rubbish at school, a wise teacher told me that sometimes it is better to keep quiet....
Why doesn't the Dark Cloud Cover code have an above average previous candle body size condition, but the Piercing Line does?
Try to compare the pattern search codes and descriptions of these formations:
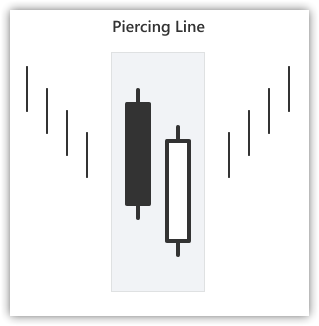
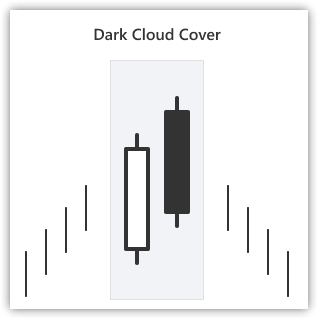
Dark Cloud Cover - Piercing LineDark Cloud Cover - Piercing Line pattern
The Piercing Line pattern is a combination of a bearish and bullish candlestick. It is the opposite analogue of the Dark Cloud Cover pattern. First comes a big black candle, the next one has a low opening (below the previous candle's low) and closes above the middle of the first candle. It is a signal of a possible reversal of the downtrend (bearish).
The pattern "Cloud Gap" looks like "Bullish Engulfing", only in the case of "Cloud Gap" the white body only partially overlaps the preceding black one, while in the case of Bullish Engulfing - the whole body. The greater the part of the black body overlapped, the higher the probability of a reversal at the base. But if a long black candle then appears on the chart with a closing price below the lows reached at the occurrence of a Cloud Gap or a Bullish Takeover, it will mean that the reversal signal has not worked and the downtrend is likely to continue.
Dark Cloud Cover pattern.
The Dark Cloud Cover pattern is a combination of a bullish and a bearish candlestick. It starts with a large white candle, the next candle has a high opening (above the high of the previous candle) and closes below the middle of the first candle. This is one of the few cases where the high and low are taken into account. It is a signal of a possible reversal of the uptrend (bullish).
The stronger the body of the black candle overlaps the body of the white candle, the higher the probability of a top formation. Note that a Bearish Engulfing will form at full overlap. The dark cloud veil can be compared to a partial solar eclipse, while the engulfing pattern is a total eclipse, hence the latter is a stronger reversal signal. But if a long white candle appears on the chart afterwards, with a closing price that exceeds the highs of the Dark Cloud Eaves or Bearish Takeover, it may indicate a continuation of the uptrend.
If you notice a discrepancy, just add it in your code.
Try comparing pattern search codes and descriptions of these formations
I did, that's why the question came up:
//--- check Dark Cloud Cover
   if((Close(2)-Open(2)>AvgBody(1))  && // long body of the white candlestick (long white)
      (Close(1)<Close(2))            && // followed by a black candlestick
      (Close(1)>Open(2))             && // close within the previous candlestick body (white)
      (MidOpenClose(2)>CloseAvg(2))  && // uptrend
      (Open(1)>High(2)))                // open above the previous day's High price (open at new high)
     {
      ExtPatternDetected=true;
      ExtSignalOpen=SIGNAL_SELL;
      ExtPatternInfo="\r\nDark Cloud Cover detected";
      ExtDirection="Sell";
      return(true);
     }

//--- check Piercing Line
   if((Close(1)-Open(1)>AvgBody(1)) && // long body of the white candlestick (long white)
      (Open(2)-Close(2)>AvgBody(1)) && // long body of the previous black candlestick (long black)
      (Close(1)>Close(2))           && // close within the body
      (Close(1)<Open(2))            && // of the previous candlestick (close inside previous body)
      (MidOpenClose(2)<CloseAvg(2)) && // downtrend
      (Open(1)<Low(2)))                // open lower than previous Low
      return(true);
     {
      ExtPatternDetected=true;
      ExtSignalOpen=SIGNAL_BUY;
      ExtPatternInfo="\r\nPiercing Line detected";
      ExtDirection="Buy";
      return(true);
     }
- Free trading apps
- Over 8,000 signals for copying
- Economic news for exploring financial markets
You agree to website policy and terms of use
Check out the new article: Deconstructing examples of trading strategies in the client terminal.
The article uses block diagrams to examine the logic of the candlestick-based training EAs located in the Experts\Free Robots folder of the terminal.
The folder contains 28 EAs - examples of trading strategies for independent study and application of the principles laid down in the strategy for your own developments. The trading strategies presented in the Free Robots folder are EAs that trade on candlestick patterns supported by indicator signals.
To confirm candlestick pattern signals, the values of one of four oscillator indicators are used: CCI, MFI, RSI and Stochastic Oscillator. Thus, 7 EAs trading on candlestick patterns are presented for study (each with two patterns - one pattern for long and one for short positions), and each of these EAs is presented in four copies - according to the number of confirming indicators.
Author: Artyom Trishkin