How to cover trade history markers with rectangle object
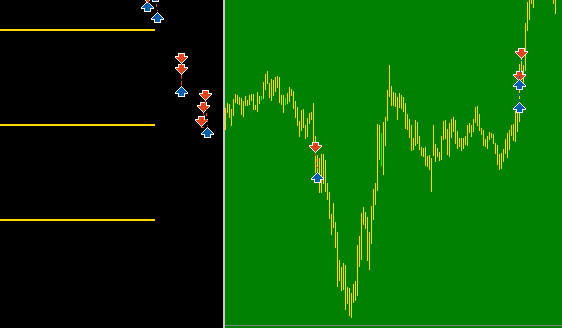
Can someone show me how to make a rectangle/label with background cover the position history markers that mt5 automatically plots on the chart. Here is my code. On the image you can see what i mean. those little blue and red arrows are popping through the black background of the panel. I have tried several things including ObjectSetInteger(0, bgName, OBJPROP_BACK, false); but just cant find the correct way..
- How to open a Chart Sub Window without using an indicator? MT5
- How to read object width size?
- Impossible to create a rectangle on the chart
Jesper Christensen: Can someone show me how to make a rectangle/label
- There is no such thing as a "rectangle/label." There are only Rectangles and rectangle Labels.
- If you want the rectangle to move with the bars, use a rectangle. You are creating a rectangle label with (X/Y) offsets, irrelevant to any bar.
William Roeder #:
- There is no such thing as a "rectangle/label." There are only Rectangles and rectangle Labels.
- If you want the rectangle to move with the bars, use a rectangle. You are creating a rectangle label with (X/Y) offsets, irrelevant to any bar.
I tried both with a rectangle and a label. But with non of them was i able to cover the markers. I also tried with OBJ_BITMAP_LABEL.. You didnt make any hints as to how to cover the markers though.
Anyone?
You are missing trading opportunities:
- Free trading apps
- Over 8,000 signals for copying
- Economic news for exploring financial markets
Registration
Log in
You agree to website policy and terms of use
If you do not have an account, please register