Discussing the article: "Developing a Replay System — Market simulation (Part 23): FOREX (IV)"
Hello dear Daniel,
Congratulations on this great system you have designed.
I have encountered some problems while testing your system and I need your help.
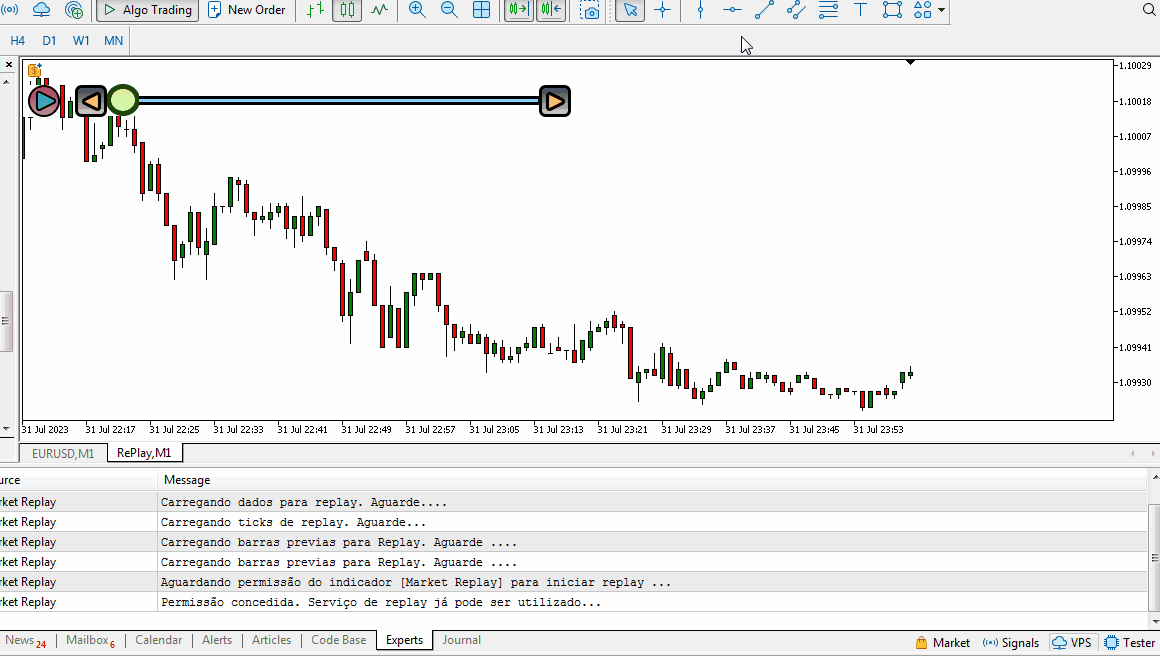
The first thing is that I saved the tick data for a month and put it for replay. However, in the 1 minute TimeFrame for the replay in a month with the change of the pin on the slider, the number of candles shown does not match the position of the pin on the slider, I have shown this in the attached video. I took the pin all the way to the end, but the candles only repeat for a small number of 1-minute bars (about 20 bars).
The second thing is that I need to change this system so that the way the bars move is like Strategy Tester, i.e. the position of the pin represents the speed at which the bars are displayed, or I have the possibility of moving bar by bar like the TradingView website. Your system is in such a way that it can be changed like this????
I would be grateful if you could guide me.
Yours sincerely,
OK, let's go in parts, as JACK would say...😁👍
You may be very confused about this application, or rather, you may be expecting this application to be used for something that it wasn't intended to be used for in the first place. I'm not saying that it can't be used for something in particular, such as a strategy tester. But that wasn't the initial objective for implementing it.
On the first question: You may not have really understood how the replay/simulation will take place. Forget about the slider for a moment. When you play the system, it will retrieve the data that has been loaded, either as ticks or bars, and display it as bars on the graph, based on a time of 1 minute. This is regardless of the chart time you want to use. That's why the data in the file should be thought of as 1-minute bars. You shouldn't look at the data in the file as individual data. This application doesn't see it that way. It will always interpret bars, even two-hour bars, as 1-minute bars. Always.
If you are using bars, the application will automatically notice this and create a simulation so that each bar is approximately 1 minute long. By creating as many ticks as necessary for the values to be plotted correctly on the graph. If the data in the file is ticks, the system will launch each tick at the approximate interval defined between them, see previous articles to understand this. This interval can vary from a few milliseconds to several hours. But by doing this, anything in the interval will be treated as an auction or a trading halt. So if you use data with an interval of more than a day, or 24 hours, the application will most likely not be able to recognise the bars properly. This is the case if you use the slider to search for a new study point. For this reason, you should avoid using data with a time span of more than one day.
Remember, the application is designed to be used in a time equivalent to real time. In other words, short periods. To enter long periods in the study. If you need to use an average or indicator that requires many bars to be plotted. You MUST NOT use the data in the replay or simulator. You should use them as previous bars. This is the first point you should try to understand.
As for the second question: You imagine that the slider will search for a specific point. Indeed it does, but not in the way you want or imagine. To understand this better, take a look at the previous articles where the slider was implemented. There you'll see in detail how it actually searches for a particular position. But in this very question, you're confusing the use of the control. Since you also raise the idea that it might be used to modify the speed at which the bars are plotted. This doesn't happen at all. The plotting that you notice, when you drag the control and then press the play button, happens at a higher speed. It's actually an illusion created by the application. To show how the bars were created up to the point where you indicated for the simulation or replay to start, so that you can carry out your study.
My suggestion is: Read the previous articles carefully, and if you have any questions, post them as comments. This will make it much easier for you to understand what is really going on and how you can use the application with a good user experience. If you have any questions you can ask in the comments ... 😁👍
Okay. Let's break it down as JACK would say...😁👍
Perhaps you are very confused about this application, or rather, perhaps you are hoping that this application will come to serve something, which in fact it was not intended to be used in principle. I'm not saying that it can't be used for something in particular, like for example a strategy tester. But this was not the initial objective for it to be implemented.
About the first question: You might not have really understood how the replay / simulation will happen. Forget about the slider for a moment. When you press play on the system, it will fetch the data that has been loaded, either as ticks or bars, and will display them as bars on the chart, based on a time of 1 minute. This is independent of the timeframe you want to use. For this reason, the data, which must be in the file, must be thought of as bars of 1 minute. You should not look at file data as individual data. Because this application doesn't see them that way. It will always interpret bars even two hour bars as being 1 minute bars. Always .
If you are using bars, the application will automatically notice this, and will create a simulation so that each of the bars is approximately 1 minute long. Creating as many ticks as necessary for the values to be correctly plotted on the chart. If the data present in the file are ticks, the system will record each of the ticks in the approximate interval that is defined between them. See previous articles to understand this. Such an interval can vary from a few milliseconds to several hours. But by doing this, anything that is in range will be treated as either an auction or a trading hold. Thus, if you use data with an interval of more than one day, that is, 24 hours, the application most likely will not be able to recognise the bars properly. This is if you use the slider to look for a new study point. Therefore, one should avoid using data with a time greater than one day.
Remember the application was thought to be used in a time equivalent to real time. In other words, short periods. To enter with long periods in the study. In case you need to use some average or indicator that needs many bars to be plotted. You MUST NOT use the data in the replay or simulator. You must place them as prebars. This is the first point you should try to understand.
Now about the second question: You imagine that the slider will look for a specific point. Indeed it does, but not in the way you might want or imagine. To better understand, see the previous articles, where the control was implemented. There you will see in detail how he actually does to seek a certain position. But in this same question, you are confusing the use of the control. Since you also raise the idea that it maybe serves to modify the speed in plotting the bars. This actually doesn't happen at all. Such a plot that you notice, when dragging the control and then pressing the play button, in this at a higher speed. It is actually an illusion created by the application. To show how the bars were created up to the point where you indicated that the simulation or replay should start,
My suggestion is: Read the previous articles calmly, and if in doubt, post them as a comment. Because it will be much easier for you to understand what is actually happening and how you can use the application having a good user experience. Any questions you can ask in the comments... 😁👍
Changing the speed is very simple. Just go to the C_Replay class and look for the LoopEventOnTime function. There is a Sleep call there. This is where we control the plotting speed when we're in play mode. But I believe this has been adequately explained in previous articles.
Changing the speed is very simple. Just go to the C_Replay class and look for the LoopEventOnTime function. There is a Sleep call there. This is where we control the plotting speed when we are in play mode. But I believe this has been adequately explained in previous articles.
- Free trading apps
- Over 8,000 signals for copying
- Economic news for exploring financial markets
You agree to website policy and terms of use
Check out the new article: Developing a Replay System — Market simulation (Part 23): FOREX (IV).
Now the creation occurs at the same point where we converted ticks into bars. This way, if something goes wrong during the conversion process, we will immediately notice the error. This is because the same code that places 1-minute bars on the chart during fast forwarding is also used for the positioning system to place bars during normal performance. In other words, the code that is responsible for this task is not duplicated anywhere else. This way we get a much better system for both maintenance and improvement.
In the previous article, "Developing a Replay System — Market simulation (Part 22): FOREX (III), we made some changes to the system to enable the simulator to generate information based on the Bid price, and not just based on Last. But these modifications did not satisfy me, and the reason is simple: we are duplicating the code, and this does not suit me at all.
However, since the code for the article was ready and the article was almost completed, I left everything as is, but this really bothered me. It makes no sense for code to work in some situations and not in others. Even debugging the code and trying to find the cause of the error, I could not find it. But after leaving the code alone for a moment and looking at the system flowchart (yes, you should always try to use a flowchart to speed up coding), I noticed that I could make some changes to avoid code duplication. And to make matters worse, the code was actually duplicated. This caused a problem that I could not solve. But there is a solution, and we will start this article with a solution to this problem, since its presence can make it impossible to correctly write simulator code to work with forex market data.
Author: Daniel Jose