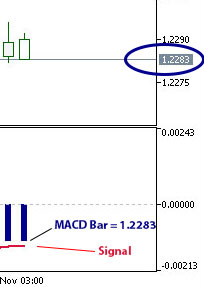
how did you get 1.2283 from the example you used to demonstrate and why subtract 12 from it ?
Noble #:
how did you get 1.2283 from the example you used to demonstrate and why subtract 12 from it ?
how did you get 1.2283 from the example you used to demonstrate and why subtract 12 from it ?
Based on the image above [GBPUSD, Monthly], please focus on the 'Range difference between Signal to MACD Bar'.
To find the R/S level '1.2283-12', refer to [GBPUSD, H1] image.
The number 12.0000 indicates the distance between the MACD Bar and Signal, with the price at that time is 1.2283.

The current bar represents the current price.
When the Bar touches the Signal, the price need to down 12 pip to price 1.2271 (1.2283-12), forming the R/S level based on 'Bar-MACD signal'.
In forex trading, multiple R/S lines are established when the current bar equals the previous bar, and when the current Bar equals the Signal.
You are missing trading opportunities:
- Free trading apps
- Over 8,000 signals for copying
- Economic news for exploring financial markets
Registration
Log in
You agree to website policy and terms of use
If you do not have an account, please register
wd.Range_MACD:
This indicator calculates the range difference between the 'MACD and Signal lines' and also the range distance between 'the last two MACD bar'.
Author: Widy Prasetyo