Optimization Results coloring
It is just simply a kind of a gradient map, where the best results are green and the worst are red, with a gradient between them.
EDIT: See reference in the documentation in the next post ...
Where to View the Optimization Results
The table with optimization results is colored as follows to enable a more efficient visual analysis:
- Balance: values greater than the initial deposit are colored in blue, and those less than the initial deposit are shown in red.
- Profit: blue is used for values greater than zero, and red is used for values less than zero.
- Expected Payoff: blue is used for values greater than zero, and red is used for values less than zero.
- Drawdown: from green (0-5%) to red (greater than 30%).
- Sharpe Ratio: from green (greater than 2) to red (less than 0).
- Recovery Factor: from green (greater than 2) to red (less than 1).
- Complex Criterion — from dark green (greater than 80) to red (less than 20).
- www.metatrader5.com
Fernando Carreiro #:
It is just simply a kind of a gradient map, where the best results are green and the worst are red, with a gradient between them.
EDIT: See reference in the documentation in the next post ...
I originally thought that too but if you look at the results I attached previously that doesn't make sense. You can see that it isn't a progression of colors. There are random red, black, light and dark greens.
I don't see any attached image.
Also, if the results are not sorted by that column, then obviously it may look like that. So sort, by the column in question.
I don't see any attached image.
Also, if the results are not sorted by that column, then obviously it may look like that. So sort, by the column in question.
Yes, I can confirm your findings.
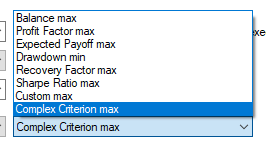
Independently of what criterion you choose, the colouring of the "Results" column, is always in accordance with the "Complex Criterion" results.
If after the optimisation, you change the "Select criterion" option in the "Optimisation Results" table to "Complex Criterion" instead, and sort the "Results" column, you will see that the colouring is then correct.
The other columns however. maintain the correct colouring according to the documentation.
- Free trading apps
- Over 8,000 signals for copying
- Economic news for exploring financial markets
You agree to website policy and terms of use
I have looked everywhere but I cannot find an answer to this.
When I am testing a bot and looking at the optimization results, in the result column the numbers are different colors. What does that mean/indicate?