Can some one help me understand this normalizated graph?
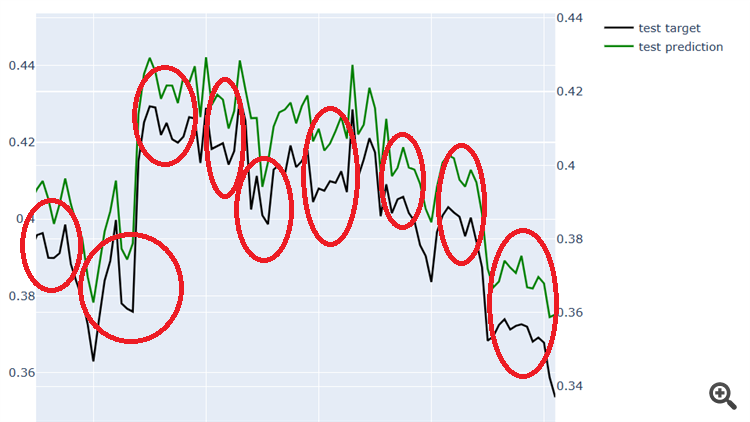
There are many divergences. Those would be the moments of entry. On when to buy or sell you will have to do your own statistical research.
Hi
I'm not so sure of what to do with this data.
I have this graph:
I understand what is normalization as a formula, and the bell curve, but dont know when to buy or sell watching this... can some one explain this for me please?
this is one output node ? Which normalizer did you use ?
There are many divergences. Those would be the moments of entry. On when to buy or sell you will have to do your own statistical research.
hi, thanks the response.
In economics, what do they mean by divergence (for example in this plot)?, I know the divergence is de derivate by the space variable ... so I understand it's the change of direction. But you mark both lines, so, do I have to understand its the change in direction of both plots? so when there is a divergence in both, It might be a good decision to make an order?.
What does it mean when only one of the lines change?
When live you won't have the target figure just the prediction.
If you have both the target and the prediction you are in the training set , or , after the trade.
The graph is meant to show you the performance of the test data, analyze it based on what you are trying to achieve, To obtain the real values you can reverse normalize the values using the mean and standard deviation of the normalized data. This process should be done with the same normalization technique that was used
pd: If the normalization has this formula:
     y - mean(y)
y' = -----------
      stdev(y)
denormalize is:
y = y' * stdev(y) + mean(y)
remember to transpose to multipli a matrix with a vector.
remember from algebra,
- Free trading apps
- Over 8,000 signals for copying
- Economic news for exploring financial markets
You agree to website policy and terms of use
Hi
I'm not so sure of what to do with this data.
I have this graph:
I understand what is normalization as a formula, and the bell curve, but dont know when to buy or sell watching this... can some one explain this for me please?