Indicators: Ergodic MACD Oscillator Blau_Ergodic_MACD
Forum on trading, automated trading systems and testing trading strategies
Indicators: Moving Average of Oscillator (OsMA)
newdigital, 2014.03.21 07:04
Scalping with MACD (based on dailyfx article)
- Scalpers should look to systematize their approaches and strategies.
- Multiple Time Frame Analysis can help day-traders see ‘the bigger picture.’
- Traders can use MACD to initiate positions in a day-trading approach.
When a scalper begins their day, there are usually quite a few questions that need to be answered before ever placing a trade.
What’s moving the market this morning?
Which markets are most active?
What drivers (or news) might come out to push the market further?
Is my coffee ready yet?
These are just a few examples… but suffice it to say that those who are day-trading in markets have quite a bit on their mind every single trading day.
The Setup
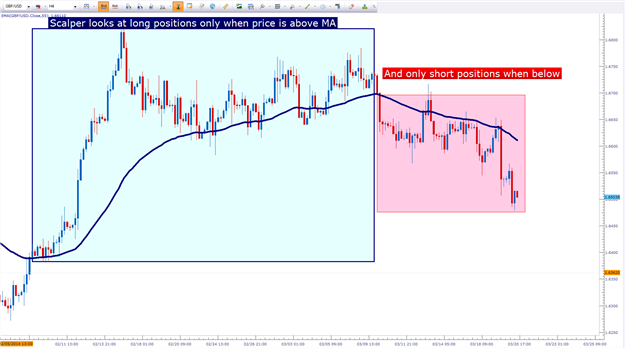
Before a scalper ever triggers a position they need to first find the appropriate market environment.
For fundamental-based traders, Multiple Time Frame Analysis can be helpful; but more important is their outlook or opinion and the fact that that outlook or opinion should mesh with the ‘bigger picture’ view of what’s going on at the moment.
For scalpers, the hourly and 4-hour charts carry special importance, as those are the ideal timeframes for seeing the bigger picture.
After that, traders should look to diagnose the trend (or lack thereof).
A great indicator for investigating trend strength is the Average Directional Index (ADX). Also popular for investigating trends is the Moving Average Indicator.
The Entry
After the day-trader has found a promising setup, they then need to decide how to trigger into positions, and MACD can be a very relevant option for such situations.
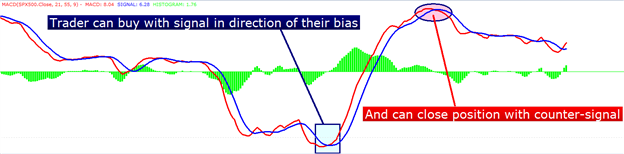
Because the trader already knows the direction they want to trade in, they merely need to wait for a corresponding signal via MACD to initiate the position.
When MACD crosses up and over the signal line, the trader can look to go long.
After a long position is triggered, the trader can look to close the position when MACD moves down and under the signal line (which is usually looked at as a sell signal, but because you did the ‘bigger picture analysis’ with the longer-term chart, this is merely a ‘close the long signal.’)
Scalpers can trigger positions when MACD Signal takes place in direction of their bias
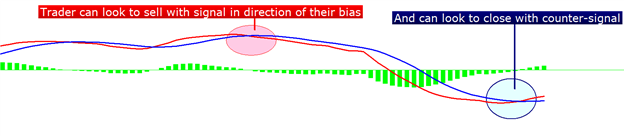
On the other side of this equation: If the trader had determined the trend to be down on the longer-term chart or if their fundamental bias is pointing lower, they can look for MACD to cross down and under the signal line to trigger their short position.
And once MACD crosses up and over the signal line, the trader can look to cover their short position.
Scalpers can close positions when opposing MACD Signal takes place
The Context
The aforementioned approach can work phenomenally in a day-trading/scalping approach. But the fact-of-the-matter is that scalping profitably entails a lot more than just a trading plan, and an entry strategy.
Risk management is the undoing of most new traders; and day-traders and scalpers fall victim to this susceptibility even more so than most.
Forum on trading, automated trading systems and testing trading strategies
Something Interesting in Financial Video July 2013
newdigital, 2013.07.07 09:19
20. How to Trade the MACD Indicator Like a Pro Part 1lesson on how to trade the Moving Average Convergence Divergence (MACD) in the stock, futures, and forex markets.
The indicator, which was developed by Gerald Appel, is constructed by taking a 12 period exponential moving average of a financial instrument and subtracting its 26 period exponential moving average. The resulting line is then plotted below the price chart and fluctuates above and below a center line which is placed at value zero. A 9 period EMA of the MACD line is normally plotted along with the MACD line and used as a signal of potential trading opportunities in the stock, futures and forex markets.
When the MACD line is above zero this tells the trader that the 12 period exponential moving average is trading above the 26 period exponential moving averages. When the MACD line is below zero this tells the trader that the 12 period exponential moving average is below the 26 period exponential moving average. Traders will watch the MACD line as when it is above zero and rising this is a sign that the positive gap between the 12 and 26 EMA's is widening, a sign of increasing bullish momentum in the financial instrument they are analyzing. Conversely when the MACD line is below zero and falling this represents a widening in the negative gap between the 12 and 26 day EMA's, a sign of increasing bearish momentum in the financial instrument they are analyzing.
The purpose of the 9 period exponential moving average line is to further confirm bullish changes in momentum when the MACD crosses above this line and bearish changes in momentum when the MACD crosses below this line.
Forum on trading, automated trading systems and testing trading strategies
Something Interesting in Financial Video July 2013
newdigital, 2013.07.08 08:58
21. MACD Indicator: Trade it Like a Pro (Part 2)
The second lesson of two on how to trade the moving average convergence divergence (MACD) for day traders and investors using technical analysis in the stock market, futures market, and forex market.
In addition to being able to tell if the stock, futures contract, or currency you are analyzing is trending or not from simply looking at its price action on the chart, you can also use the MACD indicator. Very simply if the MACD line is at or close to the zero line, this indicates that the financial instrument you are analyzing is not exhibiting strong trending characteristics, and thus should not be traded using the MACD.
Example of Trending and Non Trending Markets
Once it is determined that the financial instrument you are analyzing is exhibiting trending characteristics, there are three ways that you can trade the MACD.
1. Positive and Negative Divergence
2. The MACD/Signal Line Crossover
3. The zero line crossover
Trading the MACD Divergence:
Divergence occurs when the direction of the MACD is not moving in the same direction of the financial instrument you are analyzing. This can be seen as an indication that the upward or downward momentum in the market is failing. Traders will thus look to trade the reversal of the trend and consider this signal particularly strong when the market is making a new high or low and the MACD is not.
- Free trading apps
- Over 8,000 signals for copying
- Economic news for exploring financial markets
You agree to website policy and terms of use
Ergodic MACD Oscillator Blau_Ergodic_MACD:
Ergodic MACD Oscillator by William Blau is described in the book "Momentum, Direction, and Divergence: Applying the Latest Momentum Indicators for Technical Analysis".
Author: Andrey N. Bolkonsky