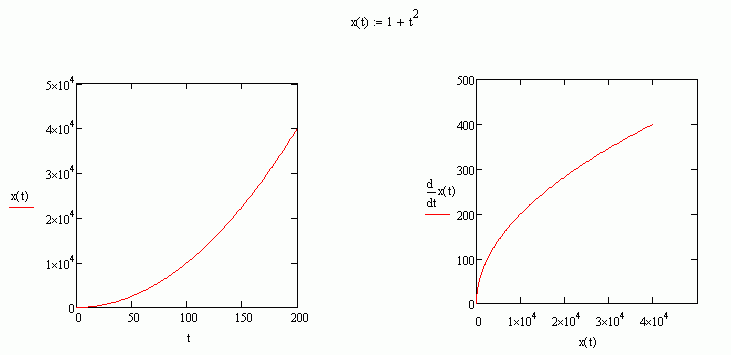
Yusuf, such a construction, called a phase portrait, has long been used successfully in mathematics, physics, etc. As far as I remember, the author is Henri Poincaré.
avtomat:
But, show it in forex. Maths techniques are used everywhere, the main thing is to see where and what to use.
Yusuf, such a construction, called a phase portrait, has long been used successfully in mathematics, physics, etc. As far as I remember, the author is Henri Poincaré.
avtomat:
This is just more crookedness and irrelevant to the topic, sorry, Oleg. I am interested in the application side of the issue.
yosuf:
But, show on forex.
But, show on forex.
On the Broko forum it was :
yosuf:
This is just more crookedness and irrelevant to the topic, sorry, Oleg. I am interested in the application side of the issue.
This is just more crookedness and irrelevant to the topic, sorry, Oleg. I am interested in the application side of the issue.
It's not crookedness, it's the very essence of the matter.
"Incorrect redirection on page", correct the link please.
yosuf:
Incorrect redirection on page
Incorrect redirection on page
There is something wrong with the redirection.
Copy the link directly into the brouser :
http://procapital.ru/showthread.php?t=28075&page=14
avtomat:
Doesn't help, it still goes through µl
There's something wrong with the redirection.
Copy the link directly into the brouser :
You are missing trading opportunities:
- Free trading apps
- Over 8,000 signals for copying
- Economic news for exploring financial markets
Registration
Log in
You agree to website policy and terms of use
If you do not have an account, please register

Hello forum users!
I have decided to present to your judgment, an alternative to the usual candlestick chart, a new, so far, called dynamic chart, which does not depend on time, but depends on the movement (dynamics) of prices. I will show you the chart at once, you will probably understand it, and then we will discuss it in more detail:
Another example:
Now, I suggest that instead of TFs (timeframes), you use DFs (dynamos).
The principle of constructing a DF needs to be discussed.
1. We can, for example, build "daily" BFs in the same way as D1, and start summing up the movement from the beginning of the day, for weekly - from the beginning of the week, etc., also with OHLC prices.
2. A dynamo can be built based on a round sum of total price movements, for example, BF 1000 (announcing a new BF every 1000 points), BF100, BF10, BF1, BF0.1,...
Dynamoframes may appear much more informative than timeframes.
Programmers, please give your feedback so that the idea can be implemented in a real timeframe as soon as possible. See the "work" section.
A rough description:
Let us imagine that we are working on DF 1. It means that from the moment when the price comes to this bar with the price O, the bar will start to be filled with the absolute increments of the price as the difference of tick prices: 0.00015 + [-0.00010] ("absolute value" symbol) + 0.00036 + 0.00014 + [-0.00024] + [-0.00231] + [-0.00012] + 0.00145 + ........ until the sum equals 1 and then the price will leave the dynamic bar with the price C, in between having visited the maximum H and minimum L, as well as any other values inside the bar. Dynamic bar DF 1 is complete! Let's move on to the next bar. The price has created the bar itself by its own movement, without time services. SUMMA ABS(Pi - Pi-1) =1. This bar contains 100,000 five-digit points or 10,000 four-digit points of price movement. You can also arrange both smaller and larger TFs (dynamos) from BFs (dynamos bars).