The regularities of price movements: Part 2. Series of bars
my results show a series probability of 0.5^n
On MA it is the same
According to my results, the probability of a series is 0.5^n
would have fallen out the last time around Christmas time (a couple thousand years ago).
There is a reason why they call "short" a short and "long" a long.
In equities the disproportion will mostly be good, in forex it should be quite blurred.
Is the length of the series interrupted by a doj or an opposite candle with a small body?
It is clear that yes.
The question was about a long series being interrupted by a doj or an opposite candle and then the previous series can repeat again.
There is no profit here, but there is a topic to talk about.)
I can't figure out what such an analysis can do, but let's chalk it up to my ineptitude.
But there is an observation about the essence of the analysis.
As I understood it, zero-height candlesticks are excluded from the calculation. Are candlesticks of minimal height (1, 2, 3) very much different from them? I think it doesn't differ much.
I think it would be more correct to consider only the candlesticks of "significant" length. As a criterion of significance we can take a modulus of (O-C)/(H-L) ratio.
The threshold value should be considered separately.
This is what the result looks like for a 4 o'clock series:
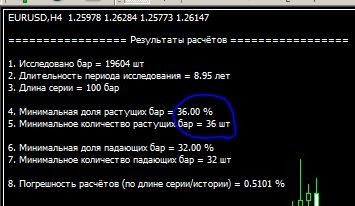
A series of 100 bars should have at least 36 rising bars.
From this you can conclude that if on a series of 50 bars you have already had 10 rising bars,
then on the next 50 bars you must have at least 36-10=26 rising bars (at least).
Consequently, the falling bars there will be about 50-26=24.
I.e. there will be about the same number of falling and rising bars.
Of course, the height of the bar is not taken into account.
This is what the result looks like for a 4 o'clock series:
A series of 100 bars should have at least 36 rising bars.
From this you can conclude that if on a series of 50 bars you have already had 10 rising bars,
then on the next 50 bars you must have at least 36-10=26 rising bars (at least).
Consequently, the falling bars there will be about 50-26=24.
I.e. there will be about the same number of falling and rising bars.
Of course, the height of the bar is not taken into account.
I can't get a handle on what this kind of analysis can do_
However, it is quite possible to benefit from the totality of elements.
What good is a processor? None, as long as it is the only one. But if you add a motherboard, a graphics card, a power supply, etc ... - you know what happens.
This ficus picus can easily be eliminated by digitising the price, i.e. converting it to a digital format - a grid with a set pitch. But more on that later.
- Free trading apps
- Over 8,000 signals for copying
- Economic news for exploring financial markets
You agree to website policy and terms of use
This part will focus on exploring bar (candlestick) series.
In the script below I have used the following terminology: a rising bar is a bar with a closing price higher than the opening price and a falling bar is a bar with a closing price lower than the opening price.
To begin with, I will publish the script. I ask professionals in the field of programming to check it for logical errors in bar calculations. If there are logic errors in the calculations - I will be
grateful for your feedback.
The script calculates the minimal share of increasing and decreasing bars in a series of the given length. The series length is set in the window of source data, it is specified by default as 100 bars.
The script operation results are displayed on the chart some time after starting the script. For example, for a series of 100 bars for EURUSD TF H1, the minimum historical number of increasing bars is
34 bars (34%):
I want to draw your attention to the fact that the script runs through the whole history and if the history is long (small TF) or has large series (more than 100) the script
can perform calculations long enough, up to several minutes (depending on the PC capabilities):
Script:
I would also like to draw your attention to the fact that the script does not take into account zero bars, i.e. bars with the opening price equal to the closing price.If anyone has any criticism of the script's calculations or any results in the field of similar research, please speak up.
Later I will join the discussion of regularities related to the series of bars and some tasks related to this topic.